My Account
My Slides
Search by Category
Templates
Leave Feedback
Login
Logout
Get Started
Browse all Slides
Browse all Slides
Create a FREE Account
Instant access to 1,000+ real slides from top companies like McKinsey, BCG, Goldman Sachs, Google and many more!
First Name
Last Name
Email
Password
I agree to all
Terms & Privacy Policy
Thank you! Your submission has been received!
Oops! Something went wrong while submitting the form.
Have an account?
Sign in
Saved Slides
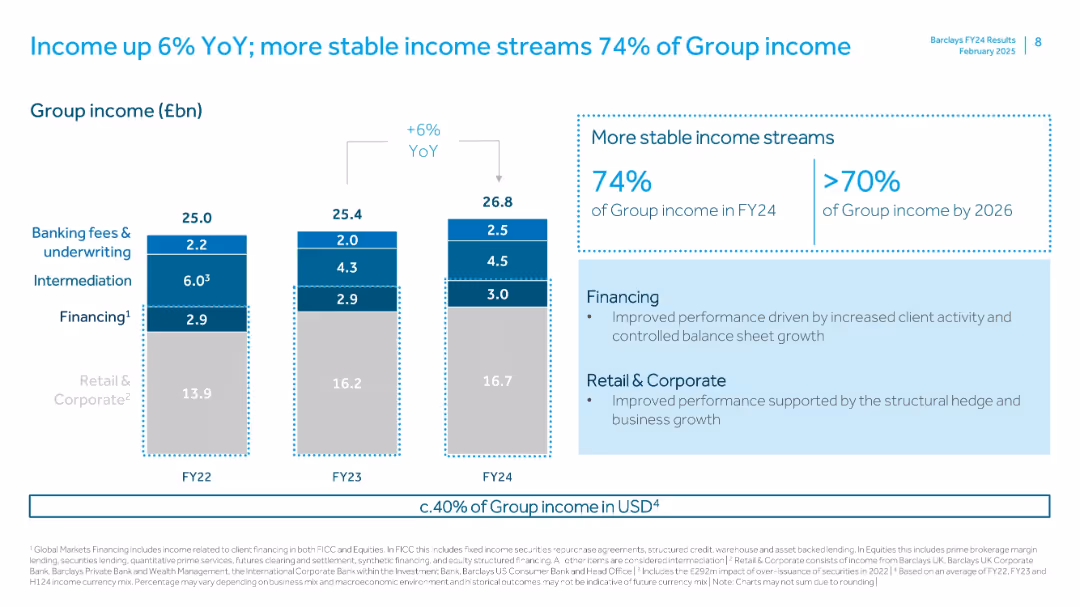
Stacked column chart with category annotations and a highlighted percentage summary. Large text for key takeaways.
Financial Performance
Financial Services
Demonstrates Barclays' FY24 group income increase of 6% YoY, with more stable income streams making up 74% of total income. Emphasizes growth in financing and retail & corporate income segments.
Income, Barclays, FY24, YoY, Retail, Financing, Corporate, Growth, Group
Mixed Chart
Barclays
Saved
The slide features two large column charts representing CCB expenses for 2018 and 2019, with overlaid text describing contributing factors to the changes in expenses.
Operational Efficiency
Financial Services
It showcases how operational leverage was achieved through a breakdown of expenses in Consumer & Community Banking. The contributing factors to the financial performance and efficiency are listed to provide insight into expense management strategies.
leverage, operational, expenses, revenue, efficiency, banking, CCB
Single Chart
JP Morgan
Saved
Contains a column chart that compares SACU receipts over three fiscal years, with each year represented by a column colored in orange.
Regulatory and Compliance
Government & Public Sector
Analyzes the SACU receipts from previous, current, and projected fiscal years, providing insights into economic trends and regional financial contributions. This information is crucial for assessing economic health and regional cooperation within the Southern African Customs Union.
SACU, Receipts, Budget, Forecasting, Economic analysis
Single Chart
PwC/Strategy&
Saved
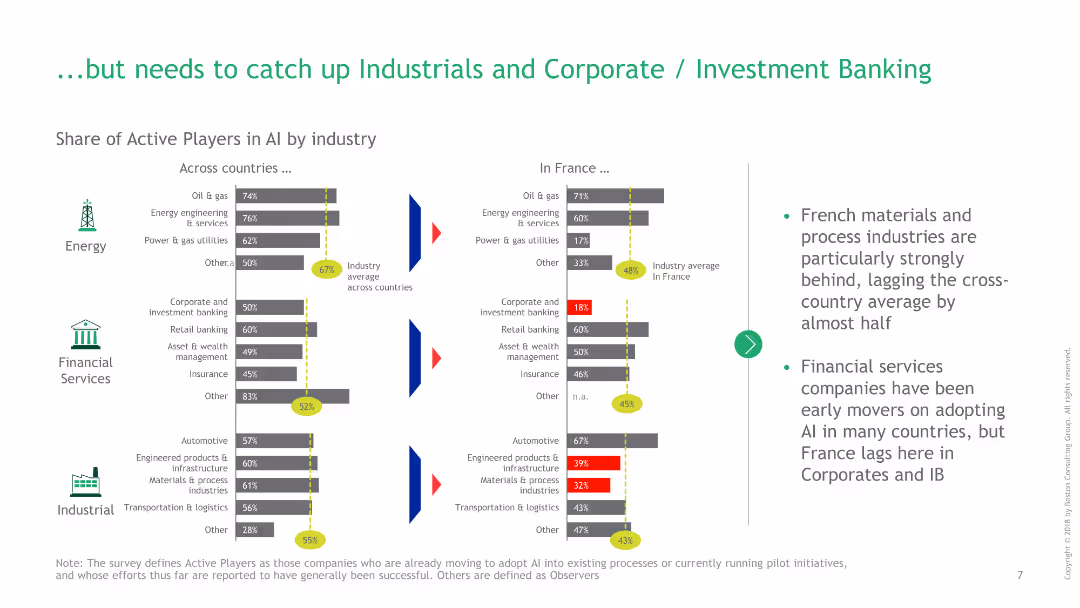
Bar charts showing the share of active AI players in energy, financial services, and industrial sectors between France and other countries.
Competitive Landscape
Financial Services
This slide highlights areas where France lags in AI adoption, particularly in industrial and corporate banking sectors, compared to other countries.
AI, France, financial services, industrial, investment banking, energy, comparison, active players, bar charts, industry average
Multiple Chart
BCG
Saved
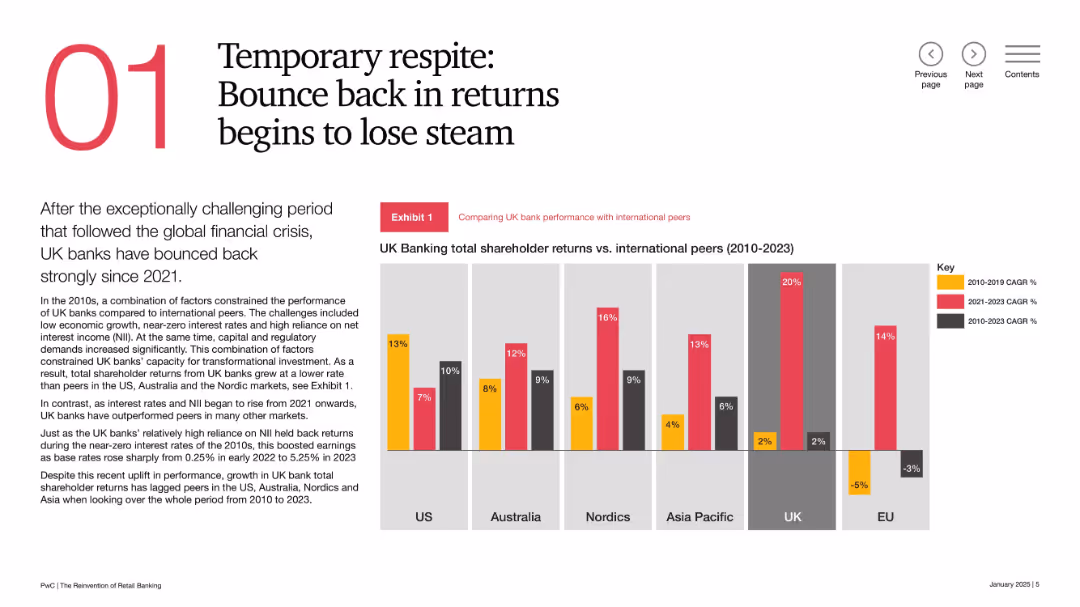
Split layout with large numeral “01”, narrative text block, and vertical bar chart comparing shareholder returns across regions; color-coded CAGR segments.
Financial Performance
Financial Services
This slide reviews the performance of UK banks vs. international peers from 2010–2023. While UK banks rebounded post-2021, they still trail in overall shareholder returns. Strong recent returns have been driven by rising interest rates, but momentum may be weakening.
UK banks, shareholder returns, international comparison, financial recovery, interest rates, CAGR, performance trends, banking sector
Mixed Chart
PwC/Strategy&
Saved
The slide is text-heavy with a large title and several subsections, including key initiatives and actions, alongside country examples. It outlines the role of universities in generating ICT talent and ensuring they possess the necessary skills. There's central text with green color highlights featuring key points. The layout is informative and arranged in lists and text blocks with distinct headers.
Strategic Planning
Education & Training
The slide outlines key initiatives and actions for universities to address the ICT talent gap. It suggests increasing investment in education, enhancing accessibility to ICT majors, and ensuring diversity. The slide also provides international examples of how these initiatives are implemented, framing the role of universities as crucial in producing job market-ready graduates.
Universities, ICT Talent, Strategic Planning, Key Initiatives, Investment, Accessibility, Diversity, Education Policy, Skill Development, Global Examples
Header Vertical
Kearney
Saved
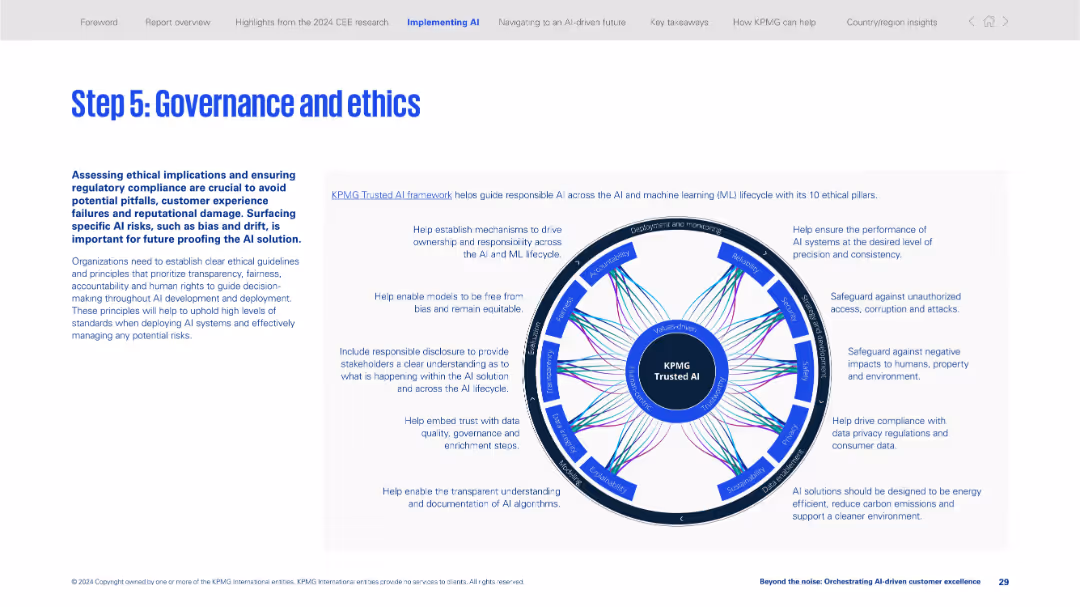
Two-section layout with explanatory text on left and a circular infographic on the right visualizing KPMG Trusted AI ethical pillars.
Regulatory and Compliance
Artificial Intelligence
Emphasizes the importance of ethics and governance in AI deployment. Introduces the KPMG Trusted AI framework and its 10 ethical pillars to ensure responsible, transparent, and compliant AI implementation.
AI ethics, governance, compliance, trusted AI, responsible AI, fairness, transparency, data security, bias, regulations
Framework
KPMG
Saved
Column chart with key drivers of growth listed and an arrow pointing to the longer-term profit goal. Simple blue and white design.
Financial Performance
Financial Services
Showcases the strategy for doubling Morgan Stanley's Wealth Management pre-tax profit, highlighting key growth drivers and goals.
Pre-tax profit, wealth management, growth drivers, Morgan Stanley, doubling profit, strategic goals
Single Chart
Goldman Sachs
Saved
Contains multiple bar charts aligned horizontally displaying the percentages of consumers delaying, maintaining, or increasing vehicle maintenance and repairs post-COVID-19. Colors differentiate actions across several countries.
Market Analysis and Trends
Transportation & Logistics
Discusses the impact of COVID-19 on consumer behaviors related to vehicle maintenance and repair, showing trends of postponement and additional work done across different nations.
COVID-19 impact, vehicle maintenance, consumer behavior, repair trends, international comparison
Single Chart
McKinsey
Saved
Features dual column charts detailing leverage exposure and risk-weighted assets in various categories, with textual overlays indicating specific figures and changes over quarters.
Risk Assessment and Management
Financial Services
Provides a comprehensive view of the bank's leverage exposure and risk-weighted assets, crucial for assessing financial stability and compliance with regulatory capital requirements. Aids in internal risk assessments and informing stakeholders about financial positioning and risk management strategies.
leverage exposure, risk-weighted assets, financial stability, regulatory compliance, risk management
Multiple Chart
Deutsche Bank
Saved
Two charts: a bar chart on the left comparing fixed and variable compensation across countries, and a scatter plot on the right showing the relationship between total compensation and fixed compensation percentage.
Market Analysis and Trends
Financial Services
This slide shows how fixed and variable compensation differs for senior executives in various countries, emphasizing that North America tends to have higher variable compensation while other regions favor fixed elements.
Compensation, Fixed, Variable, Markets, Executives
Multiple Chart
Deloitte
Saved
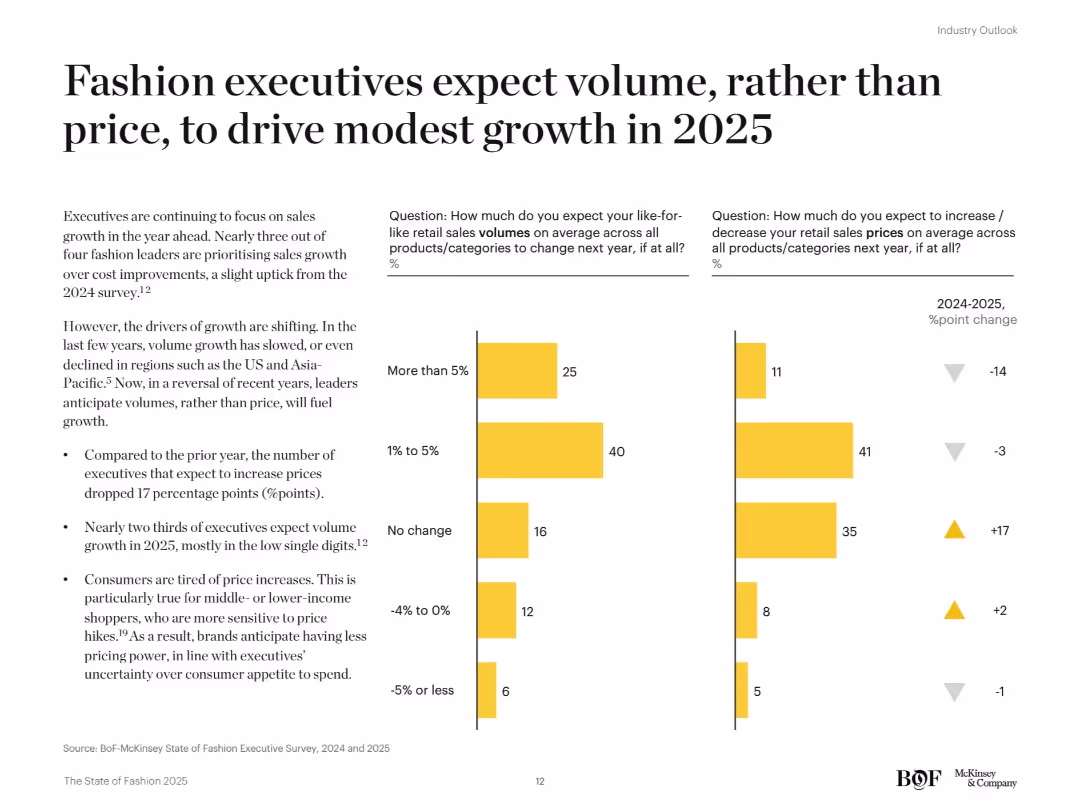
Two-bar chart columns comparing 2024 vs. 2025 executive expectations for volume and price changes. Yellow theme consistent with related slides. Additional commentary on trends provided in side text.
Market Analysis and Trends
Consumer Goods
Executives are shifting their focus from price-driven growth to volume growth for 2025, especially in low single-digit ranges. Fewer expect price increases than in 2024. This reflects consumer resistance to pricing and a focus on affordability and competitive market positioning.
pricing strategy, volume growth, executive expectations, consumer spending, fashion industry, 2025 forecast
Mixed Chart
McKinsey
Saved
The slide uses a white background with two large, concentric pie charts contrasting shades of blue and green to depict changes over the years 2020 and 2021. Adjacent to the charts, explanatory text and percentages are provided in a clear, readable font. The layout is simple and focuses the viewer’s attention on the comparative data of the pie charts.
Market Analysis and Trends
Financial Services
The slide highlights the growing importance of innovation and increased budgets for it over the span of one year. It is likely to be used for demonstrating the trend towards innovation in business strategy, showing a substantial percentage increase in companies prioritizing innovation and allocating budgets accordingly. This slide could serve as a tool for convincing stakeholders of the necessity of increased investment in innovation.
innovation importance, budgets, business strategy, trends, year-over-year increase
Multiple Chart
BCG
Saved
Slide with a pie chart showing the 2017 Equities Client Mix, a column chart depicting investment growth, and several bullet points. The design integrates visual data representation and narrative elements.
Market Analysis and Trends
Financial Services
Discusses the progress in equities execution, with emphasis on electronic execution, acquisitions, and partnerships. It details the improvement in client service and the growth of the quant industry.
Equities, Electronic Execution, Client Service, Investment Growth, Acquisitions, Partnerships, Quant Industry, AUM, Latency Improvement
Multiple Chart
Goldman Sachs
Saved
Features a detailed flow diagram showing the various processes syngas can undergo based on its purity, including PSA purification and methanol synthesis.
Technology and Digital Transformation
Energy & Utilities
Describes the multiple processes that syngas can undergo to either extract hydrogen or convert into liquid fuels, depending on its purity and composition.
Syngas, hydrogen extraction, liquid fuels, PSA purification, methanol synthesis
Diagram
Kearney
Saved
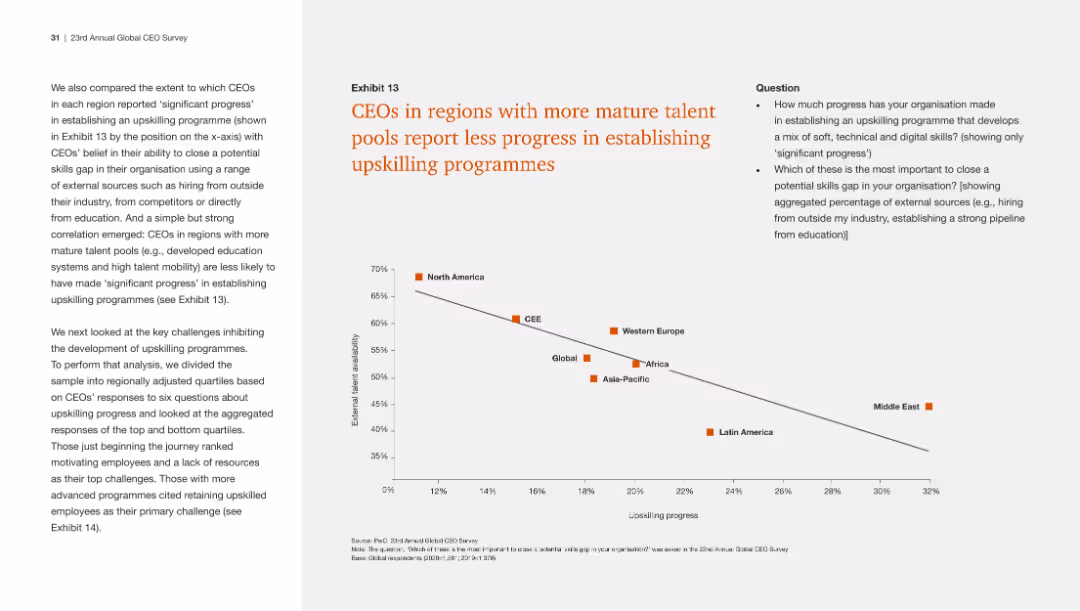
The slide contains a scatter plot showing the correlation between talent pool maturity and progress in upskilling programs across different regions.
Human Resources and Talent Management
Professional Services
The slide reveals that regions with more developed talent pools see less progress in upskilling initiatives, indicating a potential complacency or other barriers.
Upskilling, talent pools, regional comparison, scatter plot, progress
Mixed Chart
PwC/Strategy&
Saved
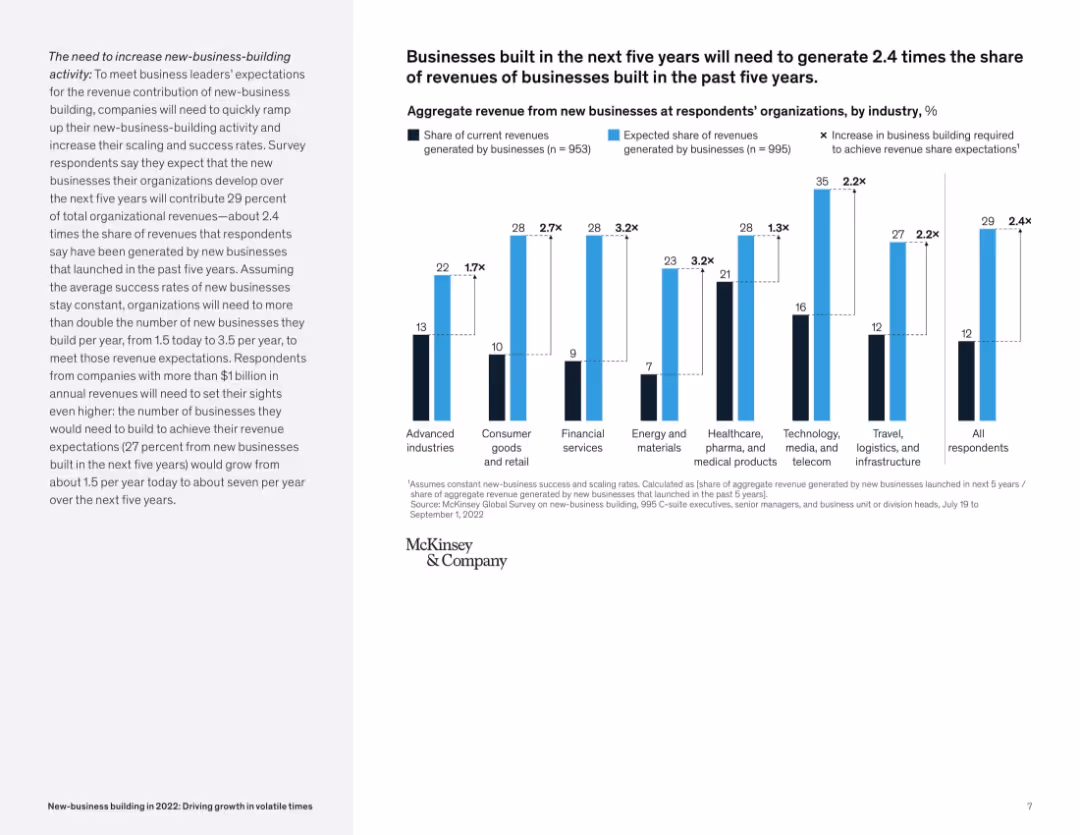
Clustered bar chart with three bars per industry: current share, expected share, and required increase; detailed textual explanation.
Strategic Planning
Professional Services
Companies project that new businesses must contribute 2.4x more revenue in the next five years than those from the past five years. This necessitates a significant increase in the rate of new-business creation and scaling.
revenue expectations, new-business, growth strategy, scaling, forecast, industry comparison
Mixed Chart
McKinsey
Saved
The slide utilizes a mix of graph types, including a column chart and a pie chart, along with descriptive text and bullet points. It presents information using blue tones and is structured into two sections to illustrate customer solutions across the wealth spectrum.
Product and Service Analysis
Financial Services
This slide showcases how JPMorgan Chase & Co. has built a range of solutions to meet customer needs, emphasizing the student segment's new checking accounts and the card ownership among Sapphire and Private Client households. It's used to illustrate product segmentation and relationship deepening within various customer wealth brackets.
Solutions, Wealth Spectrum, Banking, Student Segment, Accounts, Sapphire, Private Client, Card Ownership, JPMorgan Chase & Co.
Multiple Chart
JP Morgan
Saved
Slide displays two charts on commercial real estate risk. Left side includes a bar chart showing bank loan exposure to CRE as percentage of total assets for various countries. Right side has pie charts detailing CRE debt ownership in US and Europe.
Risk Assessment and Management
Financial Services
This slide provides a visual analysis of commercial real estate risks, focusing on the exposure of banks' and financial institutions' balance sheets in the US and Europe. Useful for discussions on market risk management.
CRE risk, financial exposure, US, Europe, banks, balance sheets
Multiple Chart
Accenture
Saved
The slide features two line charts with time-series data from 2007 to 2023. The charts depict the JPMorgan Global Purchasing Managers’ Index for Manufacturing and Services. The visual elements are placed on a white background with a top header in blue containing the slide title and source information.
Market Analysis and Trends
Industrial & Manufacturing
This slide presents the stability of the global manufacturing sector and the visible expansion in services as of July, with a detailed analysis of the JPMorgan Global PMI. It could be used to discuss market trends and economic outlooks.
PMI, Manufacturing, Services, Economic Outlook, Stability, Expansion, JPMorgan, Index, Global Sector, July
Mixed Chart
McKinsey
Saved
Column charts showing tax-equivalent yield and correlation with municipals.
Investment Analysis
Financial Services
Analysis of municipal bonds yields, assessing tax implications and correlations for investment choices.
Municipal Bonds, Tax-equivalent Yield, Correlation, Investment Choices, Bar Chart, Column Chart, Morgan Stanley, Market Monitor
Multiple Chart
Morgan Stanley
Saved
Includes a column chart listing additional governmental priorities as perceived by the public and a bar graph showing concerns about public debt from 2022 to 2023.
Strategic Planning
Government & Public Sector
Highlights additional public priorities for government commitment beyond existing reforms and tracks public sentiment regarding national debt over two years.
government priorities, public debt, public opinion, fiscal policy, national budget, government commitment, debt concerns, economic strategy, policy development
Multiple Chart
Bain
Saved
The slide includes imagery, a large figure highlight, and a side column for detailed text explanation, with a moderate visual complexity.
Investment Analysis
Education & Training
It details the apprenticeship opportunities the Tempest programme will offer, highlighting the importance of skill development and its impact on the UK economy.
apprenticeships, skill development, Tempest programme, BAE Systems, MBDA, STEM education, UK economy, training
Boxed
PwC/Strategy&
Saved
The slide has a dual-axis line chart showing the University of Michigan survey inflation expectations for one-year ahead (in blue) and five to ten years ahead (in orange) from 2012 to 2022. The chart exhibits upward trends, especially in the one-year ahead predictions.
Market Analysis and Trends
Financial Services
This slide depicts the short-term and medium-term inflation expectations based on survey data, useful for discussing consumer sentiment, economic outlook, and monetary policy considerations. It highlights the importance of inflation expectations in economic forecasting and strategy formulation.
Inflation Expectations, Survey Data, Economic Forecasting, Short-term, Medium-term, Consumer Sentiment, Michigan Survey
Single Chart
JP Morgan
Saved
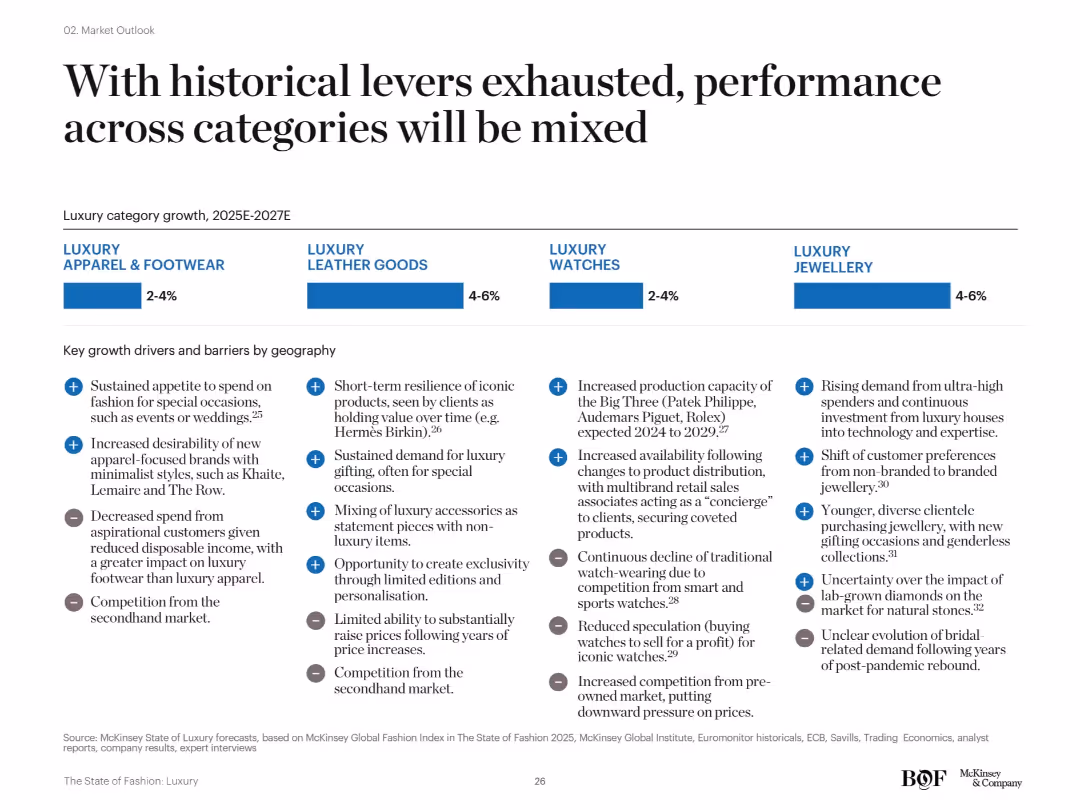
Four-segment layout comparing apparel & footwear, leather goods, watches, and jewellery. Each includes forecasted growth rates and key regional drivers and barriers in bullet format.
Strategic Planning
Consumer Goods
This slide emphasizes diverging performance among luxury categories from 2025–2027. While jewellery and leather goods are expected to grow 4–6%, apparel and watches will see only moderate growth. Key factors include secondhand market pressures, economic shifts, and consumer behavior changes.
category performance, growth forecast, secondhand competition, McKinsey, jewellery, apparel
Mixed Chart
McKinsey
Saved
Previous
Next
If nothing, comes up, please save your slides first
Create a FREE account to continue browsing
Receive Instant Access to 1,000+ slides from companies like McKinsey, Google, and Goldman Sachs
First Name
Last Name
Email
Password
I agree to all
Terms & Privacy Policy
Thank you! Your submission has been received!
Oops! Something went wrong while submitting the form.
Have an account?
Sign in
Column Chart
Heatmap
Chevron
Org Chart
Infographic
Callouts
Timeline
List
Graphic
Picture
Process Flow
Diagram
Paragraph
Map
Table
Framework
Subtitle
Takeaway Box
Icon
Other Chart
Radar Chart
Waterfall Chart
Mekko Chart
Pie Chart
Scatter Plot
Line Chart
Bar chart
Bullet points