My Account
My Slides
Search by Category
Templates
Leave Feedback
Login
Logout
Get Started
Browse all Slides
Browse all Slides
Create a FREE Account
Instant access to 1,000+ real slides from top companies like McKinsey, BCG, Goldman Sachs, Google and many more!
First Name
Last Name
Email
Password
I agree to all
Terms & Privacy Policy
Thank you! Your submission has been received!
Oops! Something went wrong while submitting the form.
Have an account?
Sign in
Saved Slides
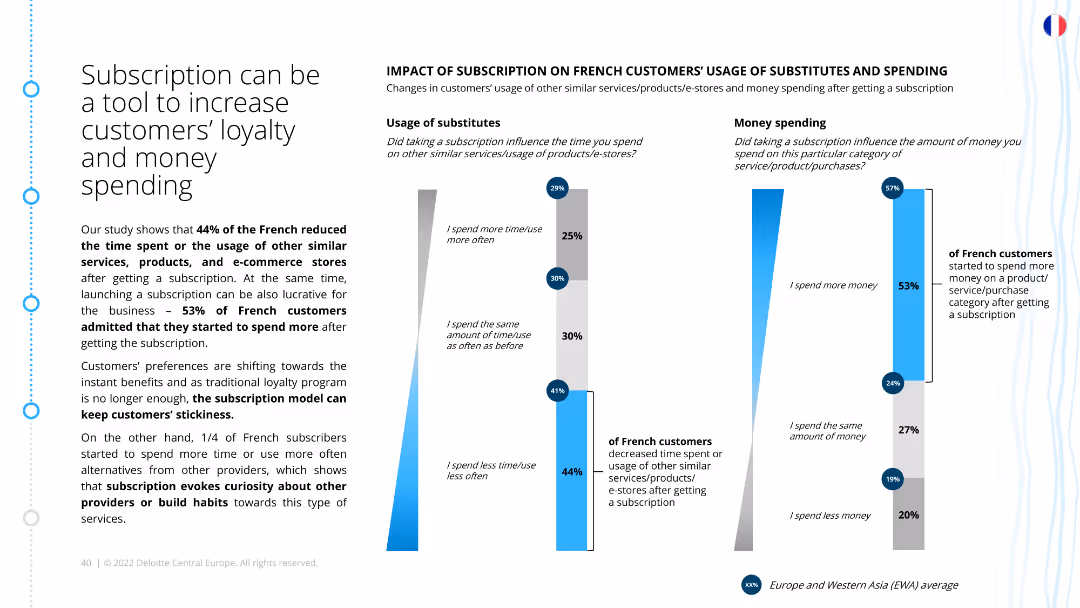
The slide features a bar chart and a column chart. The bar chart shows changes in the usage of substitutes after getting a subscription, and the column chart illustrates changes in spending habits among French customers after subscribing to services or products.
Strategic Planning
Consumer Goods
The slide presents findings on how subscriptions can enhance customer loyalty and spending. It shows that a significant portion of French customers reduced their use of substitutes and increased their spending after subscribing, indicating the effectiveness of subscription models.
Customer loyalty, spending habits, subscription impact, substitutes usage, French market, customer retention, spending increase, loyalty strategy
Multiple Chart
Deloitte
Saved
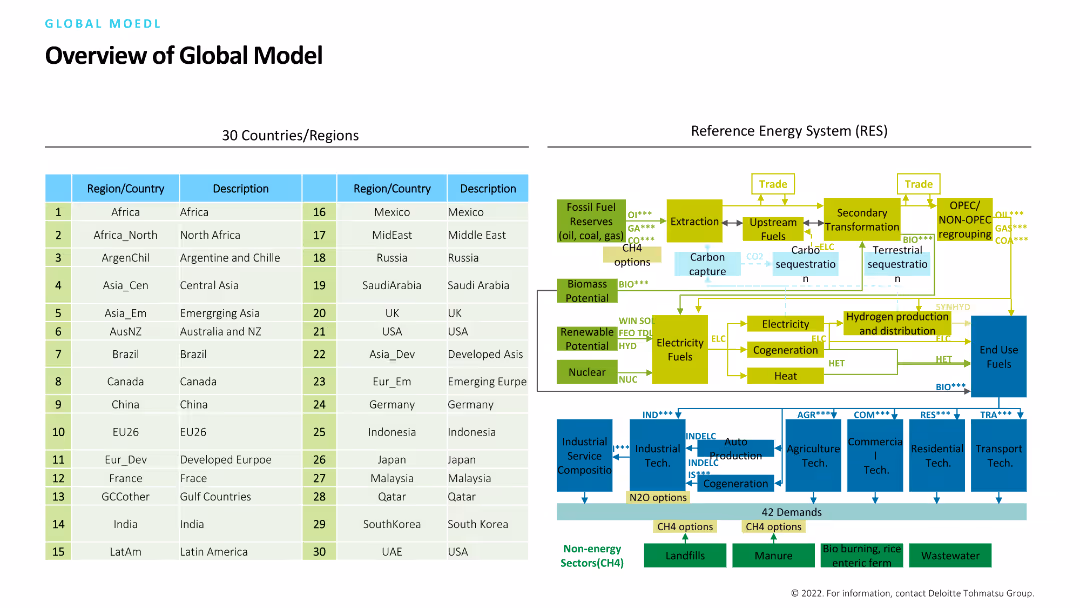
The slide is divided into two sections: a table listing 30 countries/regions with descriptions, and a complex flow diagram illustrating the reference energy system (RES), including fossil fuel reserves, renewable potential, and more.
Strategic Planning
Industrial & Manufacturing
The slide provides a comprehensive overview of a global model, detailing regions and their energy systems. It's intended for strategic planning in the energy and manufacturing sectors, showing resource and energy flows.
Global model, energy system, regions, strategic planning, reference energy system
Header Horizontal
Deloitte
Saved
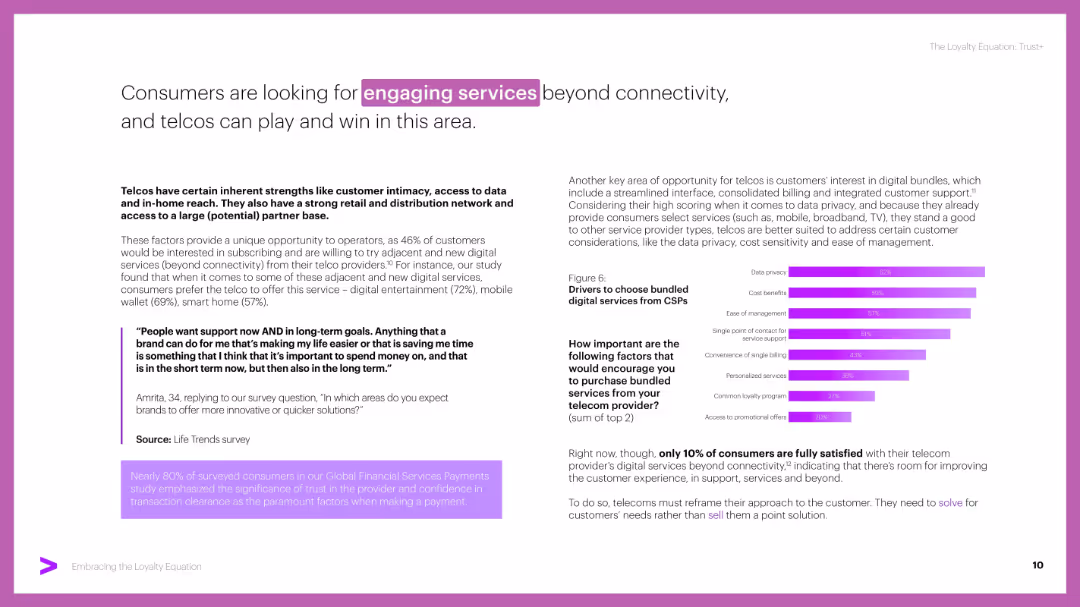
Two-column layout with bold headers, a quote in a purple box, and a horizontal bar chart on the right. Purple accent colors and highlighted keywords add emphasis.
Customer and Market Segmentation
Telecommunications
Highlights consumers’ demand for engaging services like digital entertainment, mobile wallets, and smart home devices. Emphasizes trust and bundled digital services as key drivers, with data from customer surveys and usage preferences.
digital services, CSPs, telco, bundling, trust, engagement, loyalty, privacy
Mixed Chart
Accenture
Saved
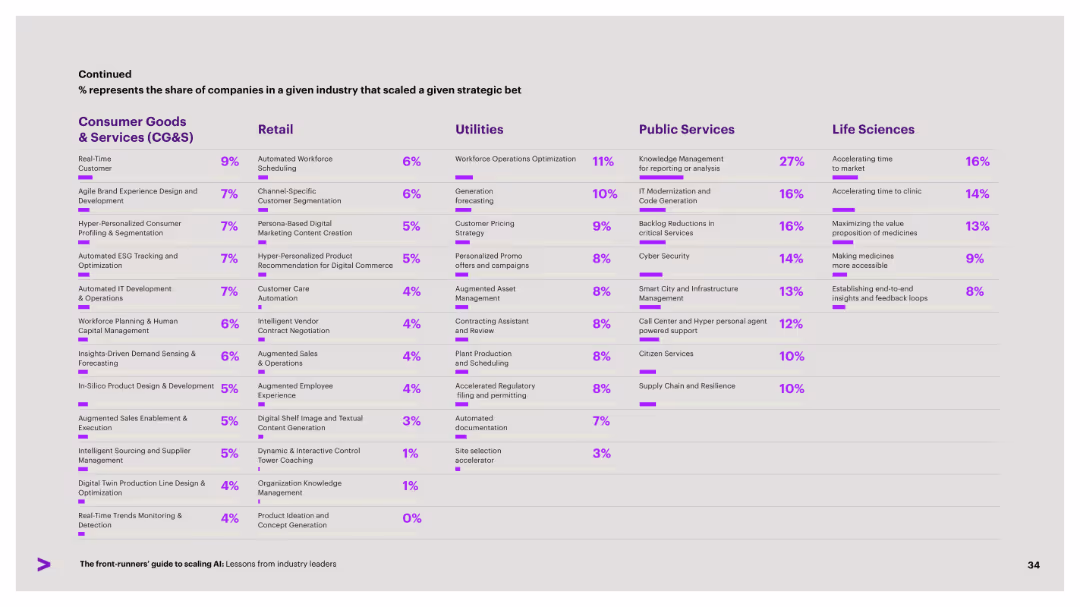
Continuation of previous slide in same layout, showing strategic AI bets by industry. Purple % bars illustrate adoption.
Strategic Planning
Artificial Intelligence
A continuation of strategic AI initiatives by industry, covering sectors like CG&S, Retail, Utilities, Public Services, and Life Sciences. The slide emphasizes the percentage of companies scaling each initiative.
industry scaling, AI strategy, CG&S, Life Sciences, digital innovation
Single Chart
Accenture
Saved
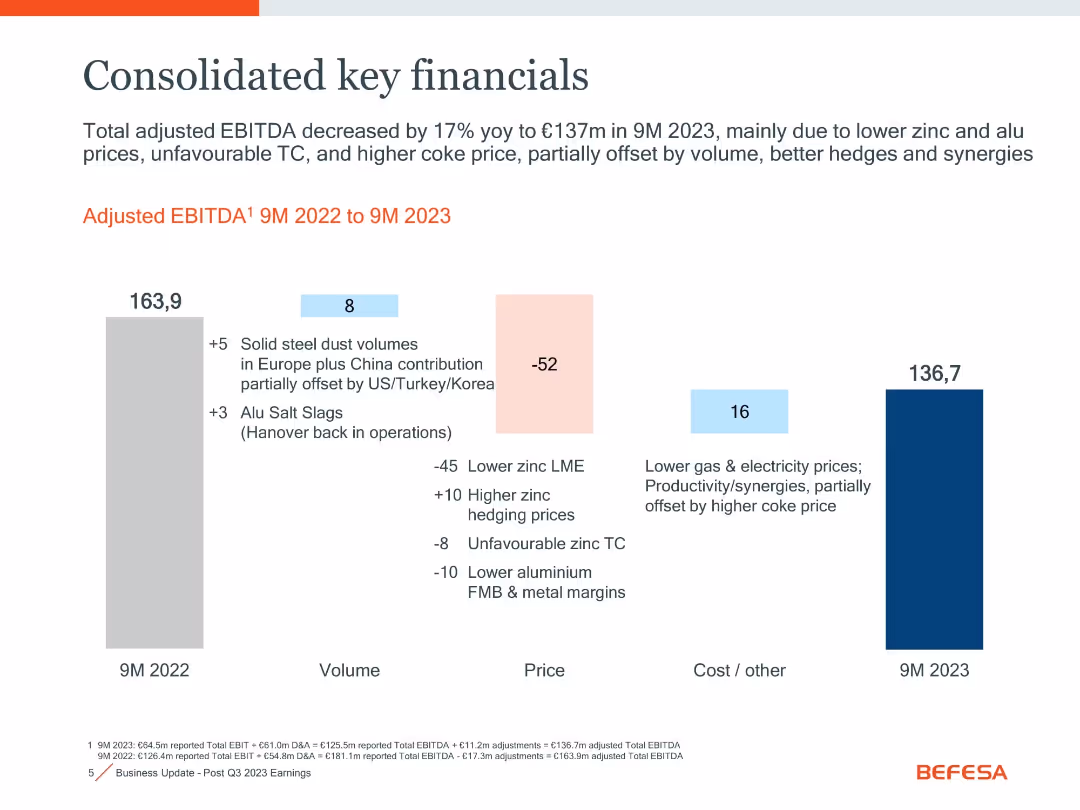
Bar chart with annotated vertical bars comparing 9M 2022 to 9M 2023 EBITDA, color-coded by volume, price, and cost/other factors
Financial Performance
Industrial & Manufacturing
The slide illustrates a 17% YoY decrease in adjusted EBITDA from €163.9m to €136.7m for 9M 2023. The drop is attributed to lower zinc/aluminium prices and unfavorable treatment charges, partially offset by volume and synergies.
EBITDA, zinc prices, aluminium, cost reduction, volume, hedging, synergy
Single Chart
Goldman Sachs
Saved
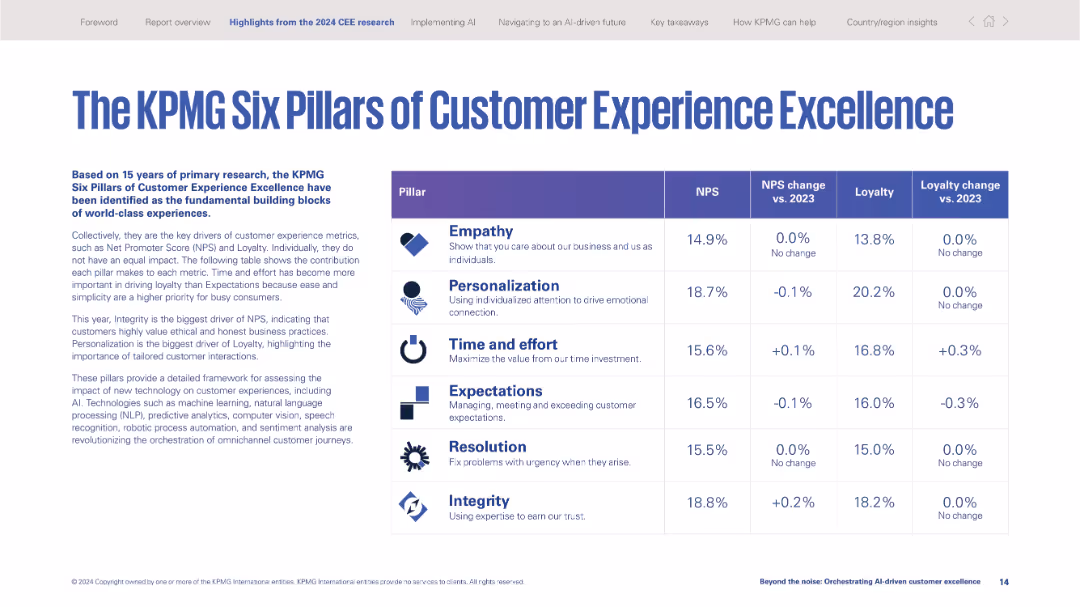
Table format listing six pillars with corresponding metrics (NPS, loyalty) and year-over-year changes.
Performance Metrics and KPIs
Professional Services
Summarizes KPMG's customer experience framework: Empathy, Personalization, Time and Effort, Expectations, Resolution, and Integrity. Shows data impact on NPS and loyalty metrics, emphasizing value alignment.
customer experience, KPIs, NPS, loyalty, empathy, personalization, integrity, KPMG framework, performance
Table
KPMG
Saved
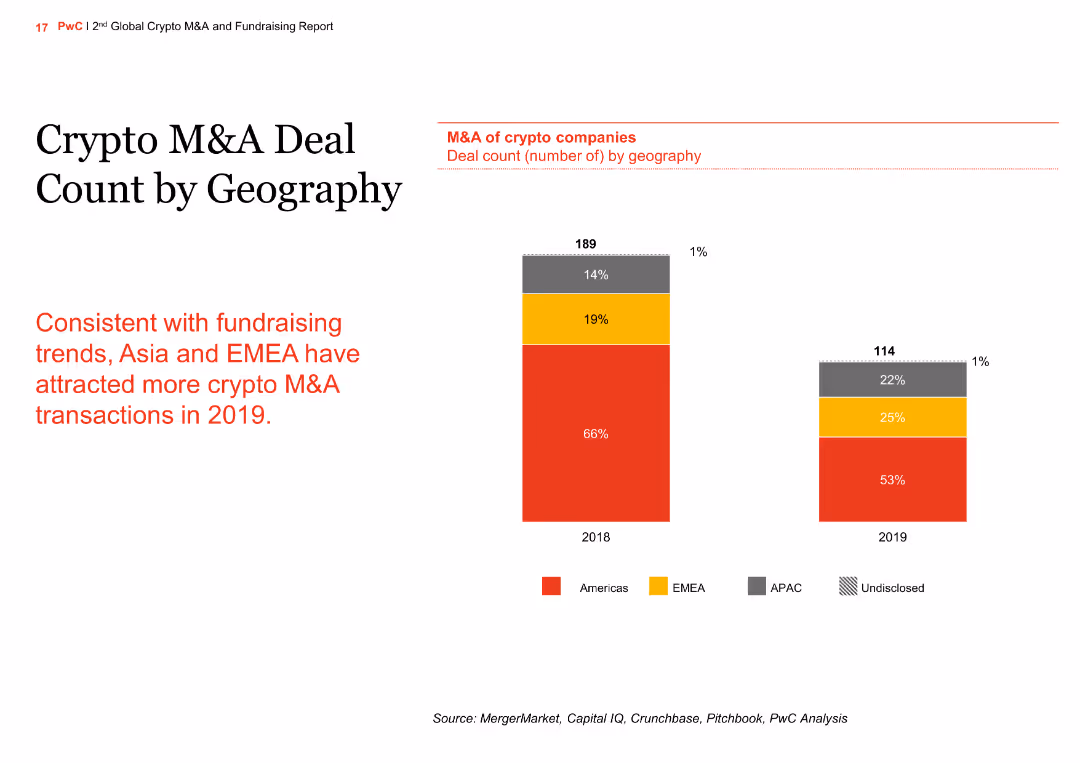
The slide features a column chart comparing the M&A deal count by geography for 2018 and 2019. The regions include the Americas, EMEA, APAC, and undisclosed.
Market Analysis and Trends
Financial Services
The slide shows the geographic distribution of M&A deals in the crypto sector, with an increase in deals in Asia and EMEA in 2019 compared to 2018, aligning with fundraising trends.
crypto, M&A, geography, column chart, comparison
Mixed Chart
PwC/Strategy&
Saved
This slide is similar in design to slide 5, focusing on equities with horizontal column chart for intermediation and financing, utilizing a blue and gray color palette to denote different financial quarters.
Financial Performance
Financial Services
Evaluates the equities segment within global markets, analyzing net revenues and the impact of market conditions on the financial performance over different quarters.
equities, global markets, net revenues, financial performance, market conditions
Mixed Chart
Goldman Sachs
Saved
Slide contains two sections: one with a green semi-transparent overlay with text, and another with icons representing various types of workers spiraling towards the word 'DISRUPTED'.
Market Analysis and Trends
Professional Services
Illustrates the transformation and disruption in the workforce with traditional employee roles compared to new forms of work like freelancers and robots. Useful for analyzing the evolving talent landscape.
Workforce, Transformation, Talent, Disruption
Pillar
Deloitte
Saved
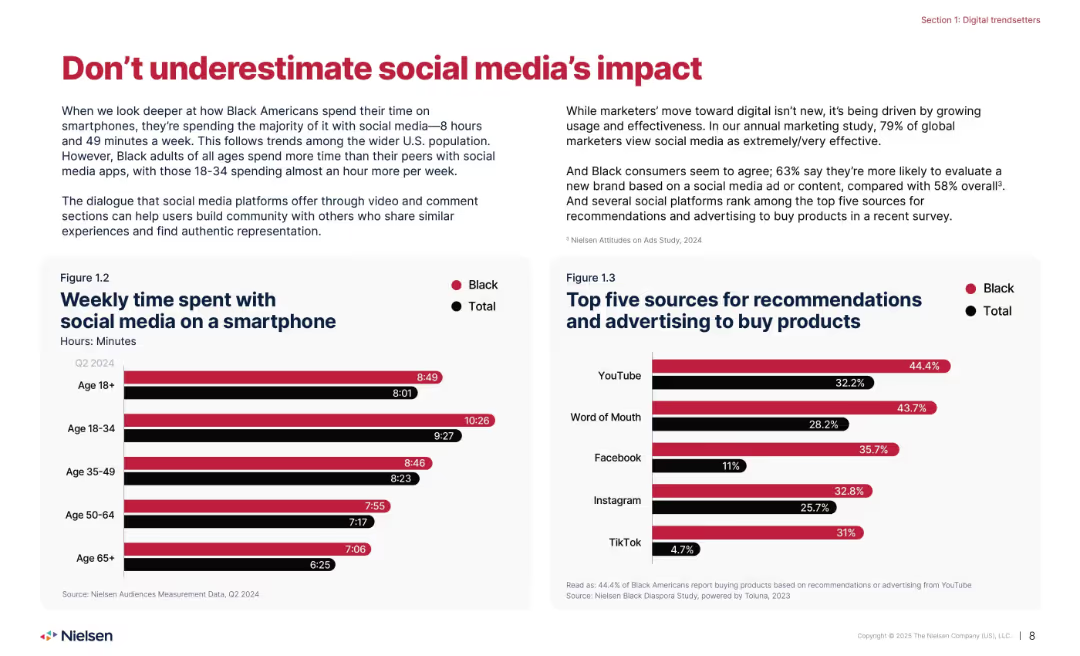
Two charts: weekly social media use by age and source of product recommendations.
Market Analysis and Trends
Media & Entertainment
Details how Black Americans use social media, particularly on smartphones, and identifies top platforms influencing purchase decisions. Younger demographics spend significantly more time on social media, and YouTube and word of mouth are top recommendation sources.
social media, smartphone, YouTube, recommendations, engagement
Multiple Chart
Nielsen
Saved
The slide displays three column charts. The first illustrates a significant increase in global private bank client advisor joiners. The second shows a dramatic increase in training hours per new hire. The third exhibits a sharp rise in client asset flows from new hires. Each chart has a key takeaway indicated by an upward arrow and a multiplier.
Human Resources and Talent Management
Financial Services
It focuses on the investment in human capital, showcasing the hiring and training of financial advisors and their contribution to client asset flows. Ideal for discussions on talent acquisition strategies or HR analytics.
hiring, advisors, training, human resources, talent acquisition
Multiple Chart
JP Morgan
Saved
Combines text, icons, and pie charts to illustrate principles of operation and the impact across business segments.
Industry Overview
Financial Services
Discusses the strength and completeness of a financial institution's Corporate and Investment Banking (CIB) segment and client impact.
CIB, client engagement, product offering, revenue opportunity, cross-business impact
Multiple Chart
JP Morgan
Saved
This slide details various European and national funding schemes available to the T&T sector. It categorizes the schemes into thematic areas of investment, such as green transition, entrepreneurship, and cultural heritage, with descriptions of each.
Financial Performance
Hospitality & Tourism
Describes funding opportunities for the T&T sector, covering EU and national programs aimed at green transition, digital capacities, entrepreneurship, and infrastructure. Lists specific funding schemes and their objectives.
Funding, EU programs, Investment, Green transition, Entrepreneurship
Mixed Chart
EY
Saved
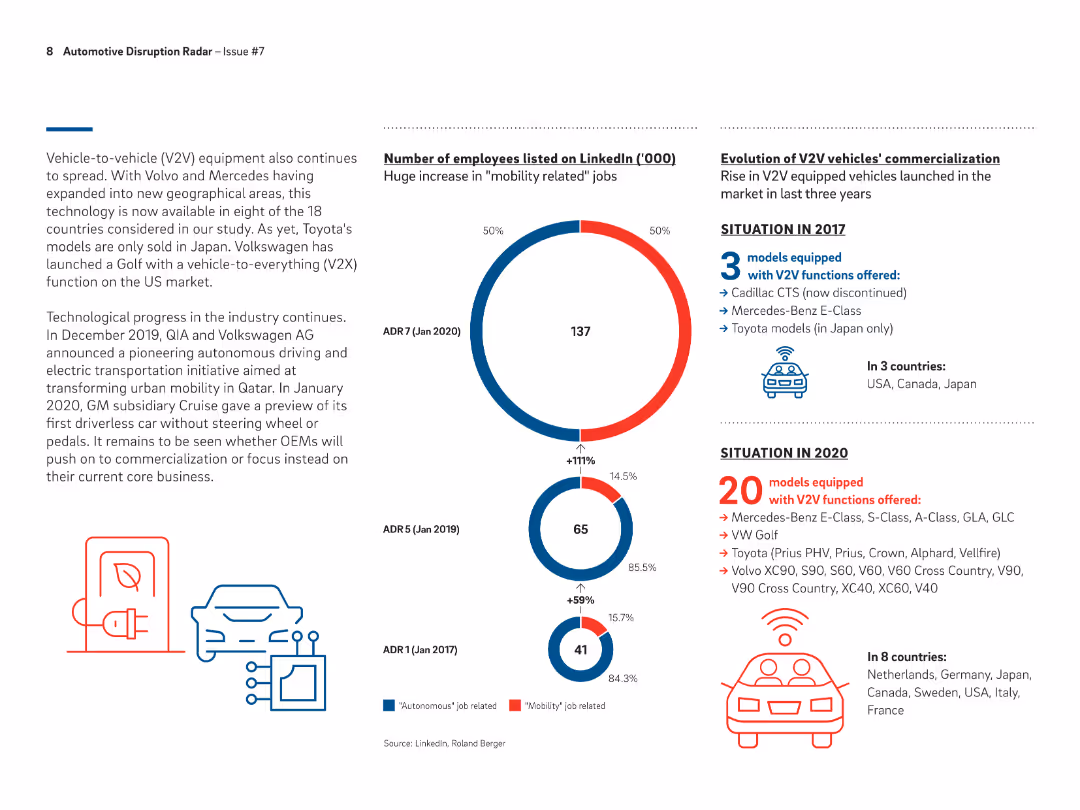
Bubble chart showing venture capital investment trends in mobility platforms and transport technology from 2016 to 2019, with a comparison to AI investment.
Investment Analysis
Financial Services
Analyzes the trends in venture capital investments in mobility and transport technology, highlighting a decline in mobility investment and an increase in AI investment.
venture capital, mobility platforms, transport technology, AI
Mixed Chart
Roland Berger
Saved
Three pie charts represent funding sources, remaining maturities, and funding by currency for UBS Group in Q4 2023.
Strategic Planning
Financial Services
Details UBS Group's funding diversification strategy, highlighting sources of funds, maturity timelines, and currency breakdowns.
UBS, funding, diversification, sources, maturity, currency, strategy, wholesale, financial
Multiple Chart
UBS
Saved
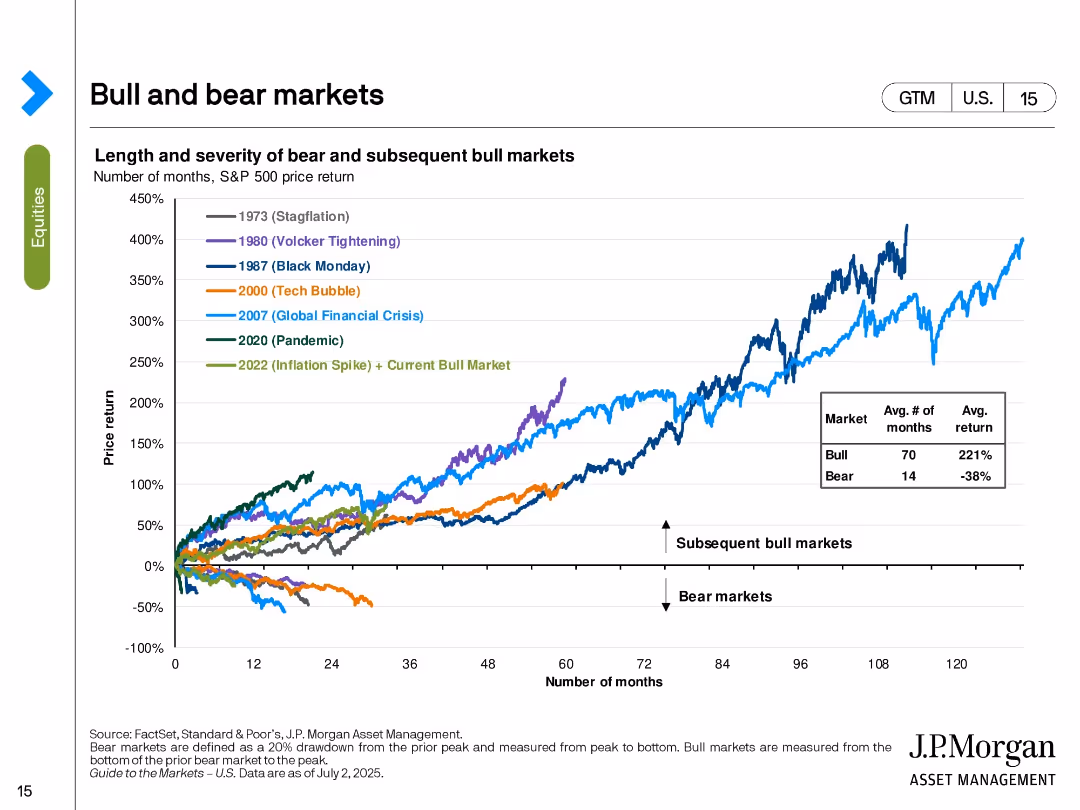
Line chart tracking the S&P 500’s performance in various historical bull and bear markets. Color-coded by major economic events.
Strategic Planning
Financial Services
The slide shows the price return trajectories of the S&P 500 in different market cycles including stagflation, tech bubble, GFC, and pandemic. It contrasts the length and return of bear vs. bull markets, with bull markets averaging 70 months and 221% return. The current bull market (since 2022) is included.
bull markets, bear markets, S&P 500, historical returns, market cycles, investment strategy, macroeconomic events, recovery
Single Chart
JP Morgan
Saved
It includes a line chart of leverage measures and a column chart of global credit maturity schedules.
Financial Performance
Financial Services
The slide examines U.S. high yield bond fundamentals, focusing on leverage ratios and the maturity schedule of global credit.
leverage ratios, credit maturity, high yield bonds, financial analysis, credit risk
Multiple Chart
JP Morgan
Saved
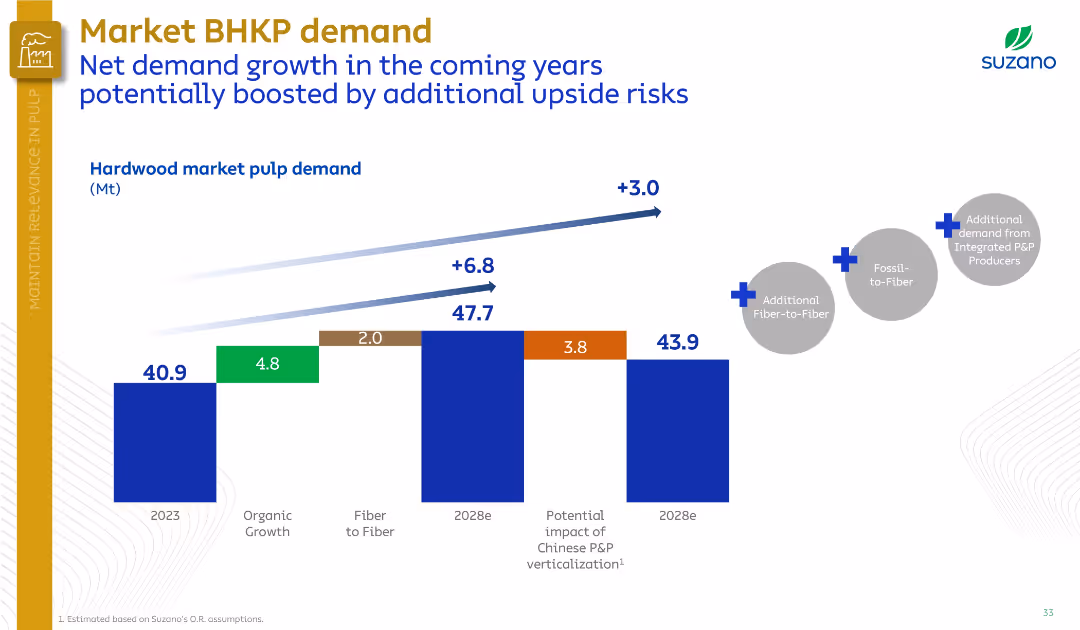
Horizontal bar chart tracks demand growth drivers; annotations highlight upside potential. Minimalist layout with emphasis on data.
Market Analysis and Trends
Industrial & Manufacturing
Suzano outlines projected demand growth for market BHKP from 2023 to 2028, driven by organic growth, fiber substitution, and potential upside from Chinese market changes and fossil-to-fiber trends.
BHKP demand, fiber-to-fiber, organic growth, pulp market, China, fossil substitution
Single Chart
Goldman Sachs
Saved
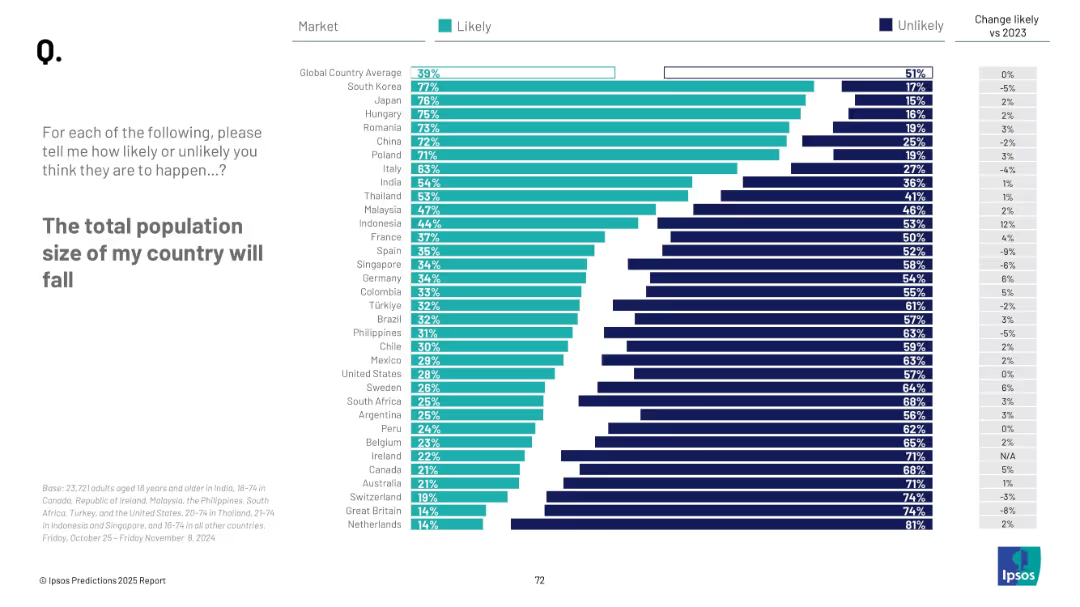
Horizontal bar chart by country showing % who think population will fall; Unlikely vs. Likely comparison; change vs. 2023 included.
Market Analysis and Trends
Government & Public Sector
The slide ranks countries by the perceived likelihood of population decline. East Asian countries like South Korea and Japan rank highest in concern. Global average is 39%, indicating moderate concern. Trend shifts from 2023 are also noted.
population decline, demographics, Ipsos, global sentiment, aging society, fertility, forecast, public perception, 2025 predictions
Mixed Chart
IPSOS
Saved
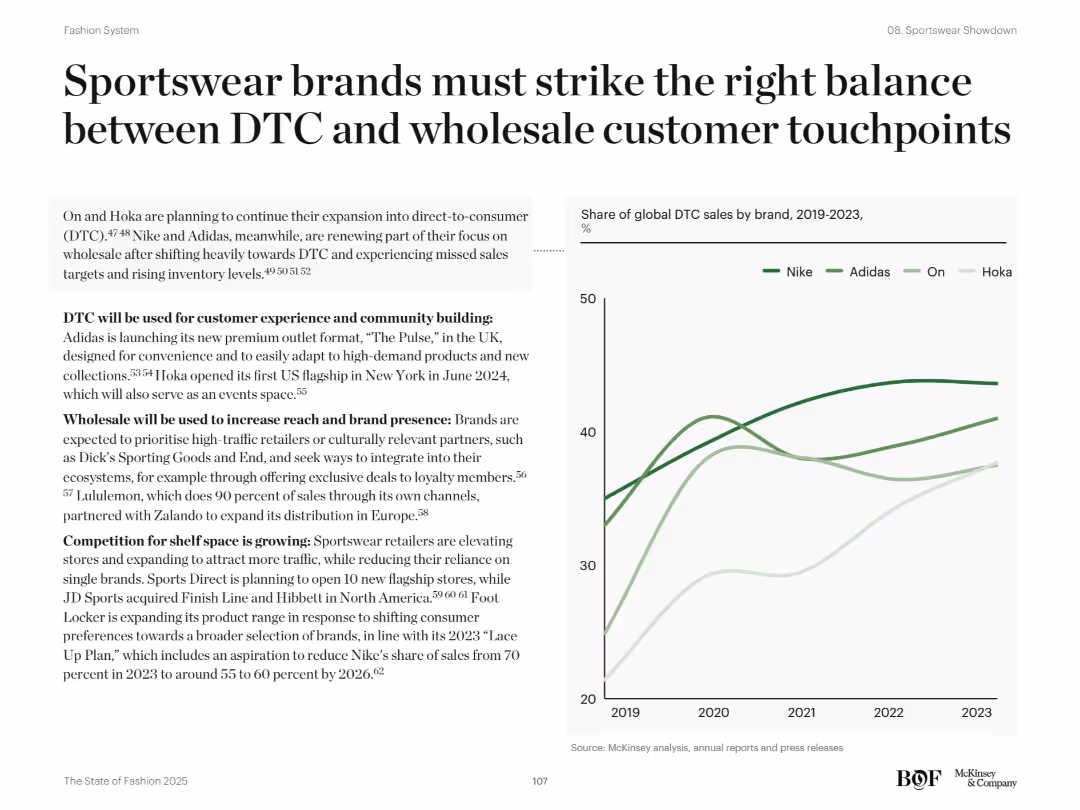
Text on left highlights DTC vs wholesale strategies; right line chart tracks DTC sales share by brand (2019–2023)
Sales and Business Development
Consumer Goods
This slide compares direct-to-consumer (DTC) vs wholesale strategies for major sportswear brands like Nike, Adidas, Hoka, and On. It emphasizes using DTC for brand control and wholesale for reach. The chart shows how DTC share has evolved over time, highlighting Nike's decline and On’s and Hoka’s rise.
DTC, wholesale, Nike, Adidas, On, Hoka, sales strategy, distribution, touchpoints
Mixed Chart
McKinsey
Saved
Slide includes column charts comparing cost-income ratios and efficiency savings across various business units.
Competitive Landscape
Financial Services
Compares financial efficiency across different sectors of the business from 2021 to 2026.
CIR, efficiency, 2026, comparison, sectors
Multiple Chart
Barclays
Saved
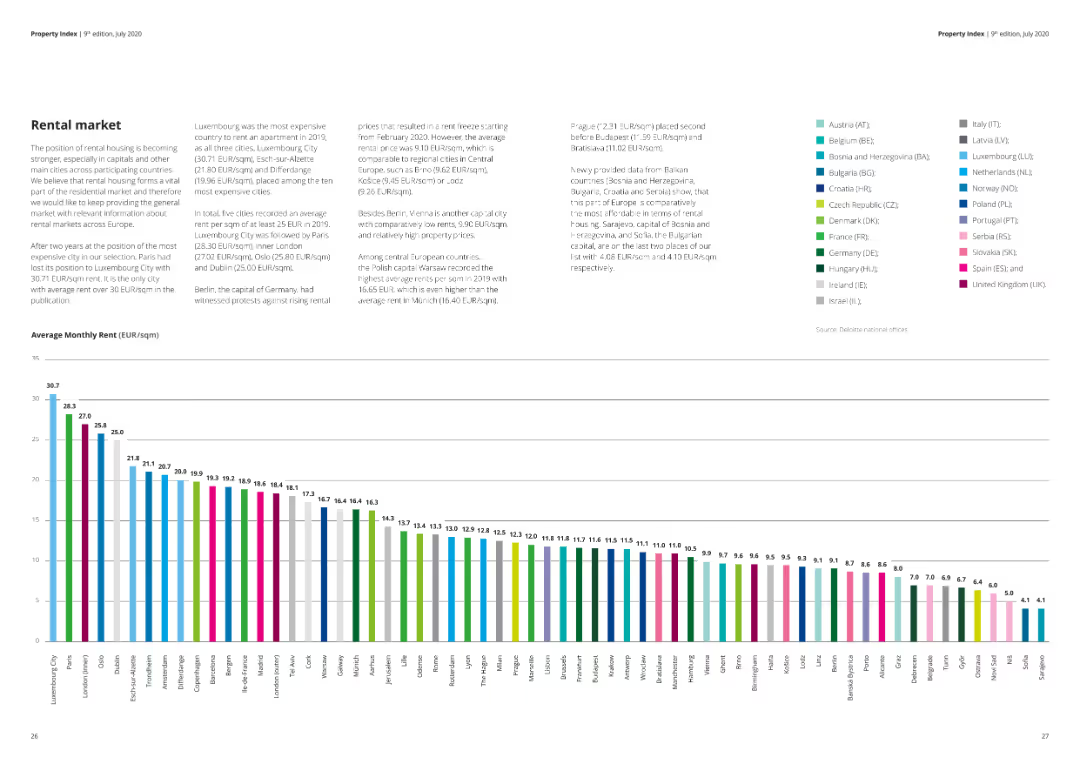
A column chart showing the average monthly rent (EUR/sqm) for different cities, with a text summary of rental market trends.
Market Analysis and Trends
Real Estate & Construction
The slide details the average monthly rent prices in various cities, offering insights into the rental market across different regions.
rental market, average rent, EUR/sqm, city comparison, market trends, real estate
Mixed Chart
Deloitte
Saved
Contains a line chart detailing the percentage of social media activities handled by outside agencies over time, segmented by economic sector.
Operational Efficiency
Professional Services
Analyzes trends in outsourcing social media activities, useful for strategic planning and optimizing operational efficiency in professional services.
social media, agencies, outsourcing, trend, professional services, operational efficiency, strategic planning, analysis
Mixed Chart
Deloitte
Saved
Title, detailed bar charts illustrating potential impacts across sub-sectors like "Living Travel Experiences" and "Digital Enterprise".
Market Analysis and Trends
Transportation & Logistics
Analyzes the potential value unlocked by digitalization in the aviation, travel, and tourism sectors, discussing both business and societal impacts.
aviation, digitalization, travel, tourism, societal impact
Mixed Chart
Accenture
Saved
Circular diagram segmented into different types of partnerships, with associated thematic areas around the circle.
Market Analysis and Trends
Financial Services
Analyzes various market partnership types, emphasizing the shift towards enhanced digital experiences.
Partnerships, Market Types, B2B, Middleware, Digital Experience, Fintech, Banking
Uncategorized
Citigroup
Saved
Previous
Next
If nothing, comes up, please save your slides first
Create a FREE account to continue browsing
Receive Instant Access to 1,000+ slides from companies like McKinsey, Google, and Goldman Sachs
First Name
Last Name
Email
Password
I agree to all
Terms & Privacy Policy
Thank you! Your submission has been received!
Oops! Something went wrong while submitting the form.
Have an account?
Sign in
Column Chart
Heatmap
Chevron
Org Chart
Infographic
Callouts
Timeline
List
Graphic
Picture
Process Flow
Diagram
Paragraph
Map
Table
Framework
Subtitle
Takeaway Box
Icon
Other Chart
Radar Chart
Waterfall Chart
Mekko Chart
Pie Chart
Scatter Plot
Line Chart
Bar chart
Bullet points