My Account
My Slides
Search by Category
Templates
Leave Feedback
Login
Logout
Get Started
Browse all Slides
Browse all Slides
Create a FREE Account
Instant access to 1,000+ real slides from top companies like McKinsey, BCG, Goldman Sachs, Google and many more!
First Name
Last Name
Email
Password
I agree to all
Terms & Privacy Policy
Thank you! Your submission has been received!
Oops! Something went wrong while submitting the form.
Have an account?
Sign in
Saved Slides
Text-heavy slide with bullet points outlining the demographics, financial literacy, and behavior of crypto asset owners, along with a doughnut chart.
Customer and Market Segmentation
Financial Services
Detailed profile of crypto asset owners, discussing demographics, investment behaviors, financial literacy, and the influence of advertising on ownership decisions.
crypto owners, demographics, financial literacy, investment behavior, advertising influence
Mixed Chart
IPSOS
Saved
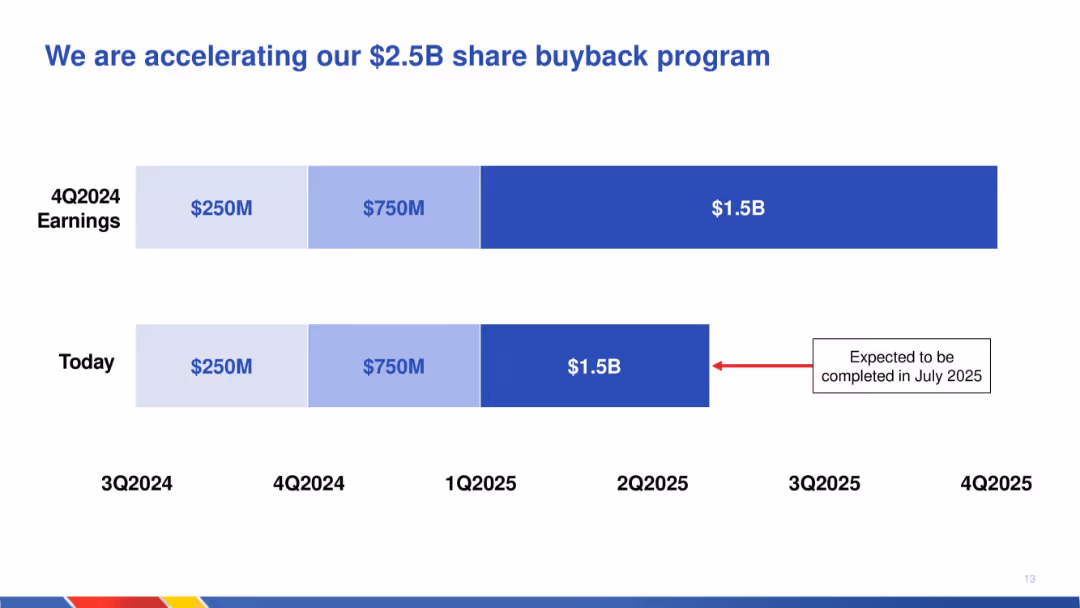
Timeline graphic comparing previous and current schedules for executing a $2.5B share repurchase; horizontal bars show acceleration.
Corporate Finance and Valuation
Transportation & Logistics
Illustrates the expedited schedule for completing a $2.5B share buyback program, with updated completion now expected by July 2025. Emphasizes return of capital to shareholders through repurchases.
share buyback, capital return, acceleration, timeline, financial planning, corporate finance, transportation, repurchase schedule
Single Chart
JP Morgan
Saved
This slide presents a list of steps for increasing organizational speed with corresponding descriptive icons, suggesting methods for operational improvements.
Organizational Structure and Change
Professional Services
Offers a blueprint for accelerating decision-making and operational speed within organizations, focusing on structural and strategic adjustments.
decision-making, speed, operational efficiency, strategy, organizational
Table
McKinsey
Saved
Includes pie charts and bar graphs detailing deposit sources and allocations by business unit within Citibank. Highly detailed with key financial figures.
Financial Performance
Financial Services
Provides a comprehensive view of Citibank's deposit diversification and stability, highlighting key business units and regional contributions. Useful for understanding liquidity management and investment safety.
deposit sources, financial stability, Citibank, business units, liquidity management
Multiple Chart
Citigroup
Saved
Features two column charts side by side comparing Gen Zs’ and millennials’ satisfaction with their organizations' societal impact, diversity and inclusion efforts, and sustainability commitments.
Human Resources and Talent Management
Professional Services
The slide examines the correlation between job loyalty and satisfaction with companies' commitments to societal impact, diversity, and sustainability among Gen Zs and millennials. It includes data visuals comparing satisfaction levels and job loyalty metrics.
Job loyalty, societal impact, diversity, inclusion, sustainability
Multiple Chart
Deloitte
Saved
Column charts on this slide rank the most challenging aspects of the HCP engagement process based on a survey.
Risk Assessment and Management
Healthcare & Pharmaceuticals
Analyzes the challenges faced in the HCP engagement process, helping to identify areas needing improvement and focus.
challenges, HCP engagement, survey analysis, process improvement, risk management
Single Chart
Deloitte
Saved
The slide presents a column chart detailing perceptions of France’s support for AI transformation, with a breakdown of responses ranging from very negative to very positive, alongside strategic quotes from industry experts.
Market Analysis and Trends
Technology & Software
Focuses on the business perceptions of France's readiness to support AI advancements, highlighting both the optimism about public initiatives and concerns regarding funding and international competitiveness.
AI, support, France, public initiatives, business perception
Mixed Chart
Bain
Saved
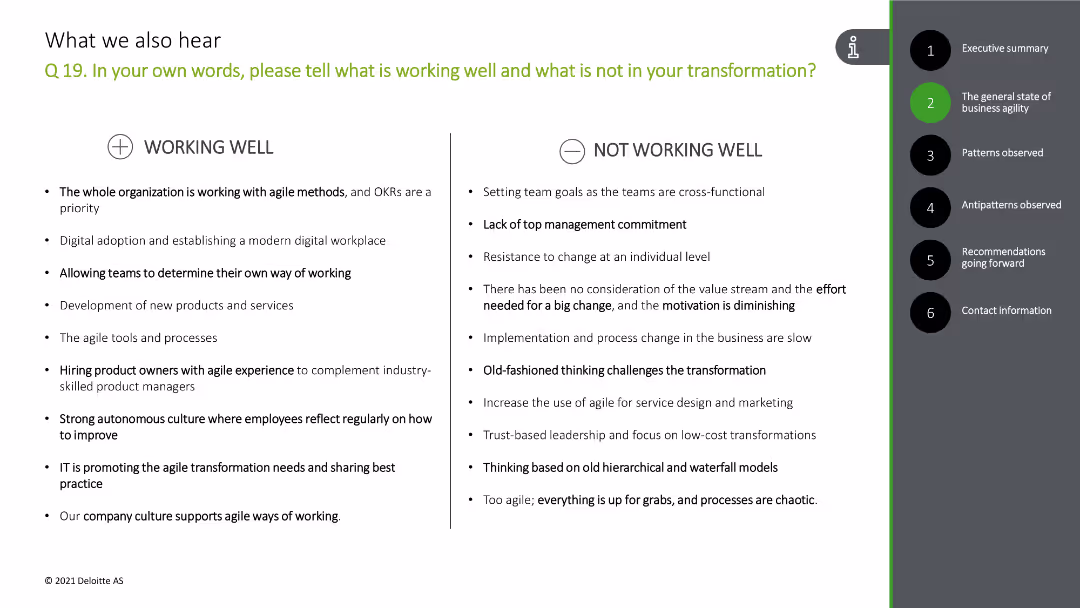
The slide has a comparative layout with two columns: "Working Well" and "Not Working Well." Each column lists several bullet points.
Risk Assessment and Management
Professional Services
This slide analyzes what is working well and what is not in the organization's transformation process based on client feedback.
agile, transformation, feedback, working well, challenges
Header Horizontal
Deloitte
Saved
Column chart with different concerns people have during COVID-19, showing data comparison between May 2020 and Dec 2020.
Market Analysis and Trends
Healthcare & Pharmaceuticals
Highlights major worries about physical and mental health of family and friends during COVID-19, comparing data between two time points.
COVID-19, mental health, physical health, comparison, family concerns
Single Chart
IPSOS
Saved
Displays a column chart with various reasons why Canadians purchase crypto assets, categorized by different motivations.
Market Analysis and Trends
Financial Services
The slide lists various reasons for purchasing crypto assets, such as long-term investment, speculative investment, diversification, and other financial motivations. It highlights demographic differences in these reasons.
Crypto assets, purchase reasons, investment
Multiple Chart
IPSOS
Saved
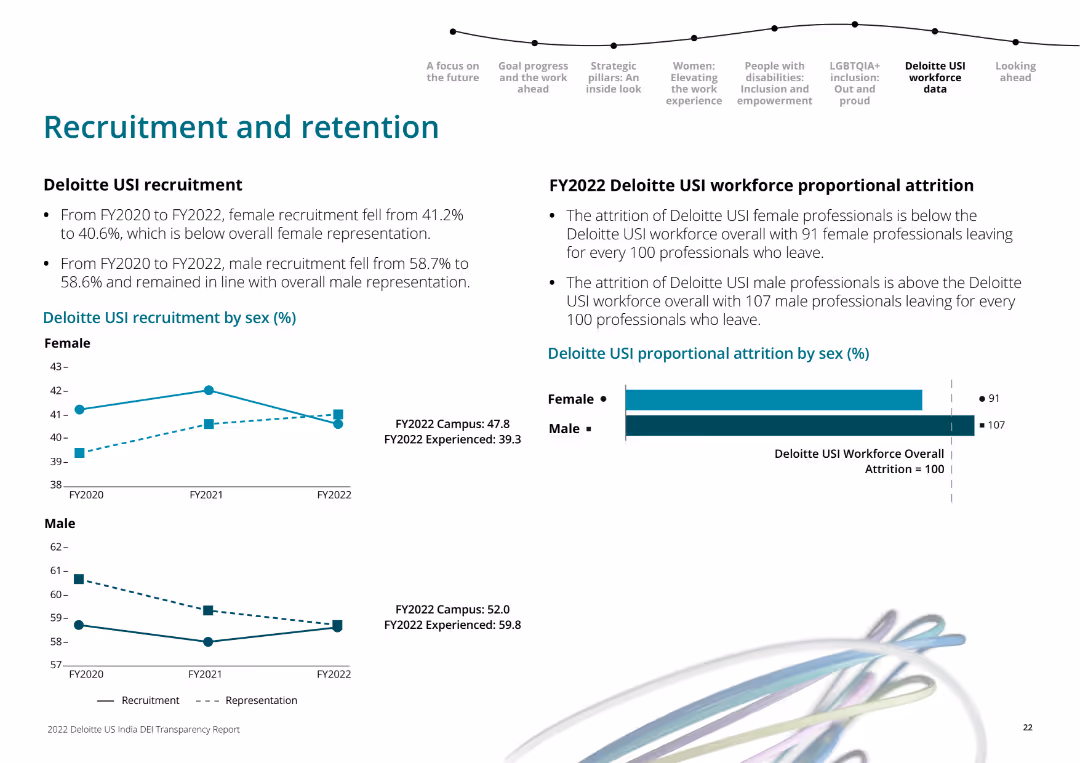
Line charts showing recruitment trends by sex over FY2020 to FY2022, and horizontal bar chart for proportional attrition by sex in FY2022.
Human Resources and Talent Management
Professional Services
It examines Deloitte USI's recruitment and retention trends over three fiscal years, highlighting gender differences in attrition rates.
workforce, recruitment, retention, Deloitte, gender, FY2022, line chart, bar chart
Multiple Chart
Deloitte
Saved
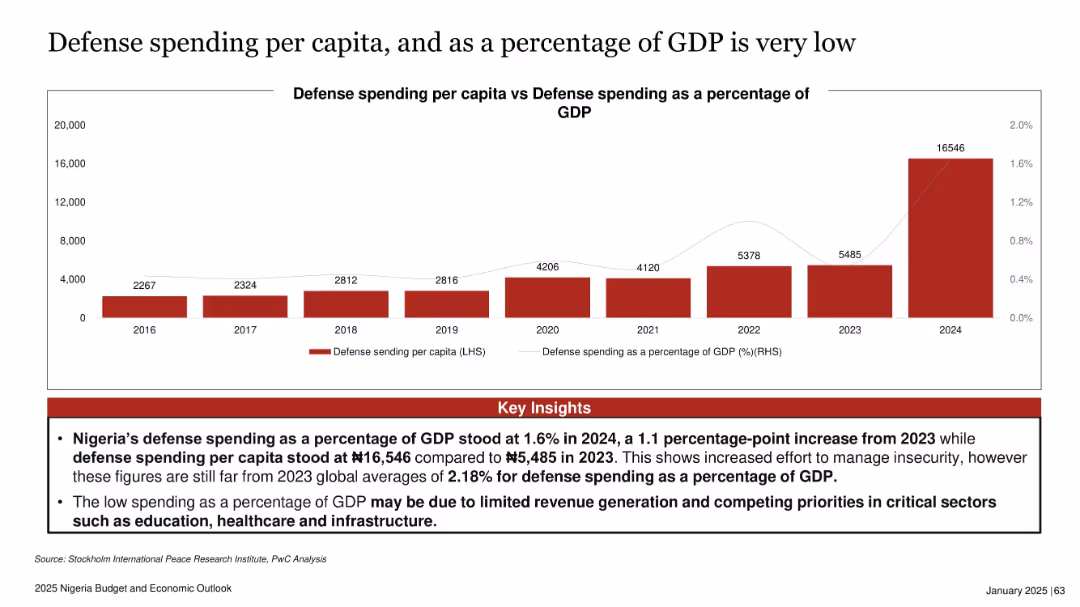
Dual-axis bar and line chart with red bars for per capita spending and a thin grey line for % of GDP
Financial Performance
Government & Public Sector
This slide compares Nigeria’s defense spending per capita with its GDP percentage from 2016 to 2024. While there’s a sharp increase in per capita spending in 2024, it still remains below global averages. Insights explain that low spending relative to GDP is due to revenue challenges and competing sectoral priorities like education and infrastructure.
defense, Nigeria, GDP, budget, security, spending, inflation, infrastructure, public finance
Mixed Chart
PwC/Strategy&
Saved
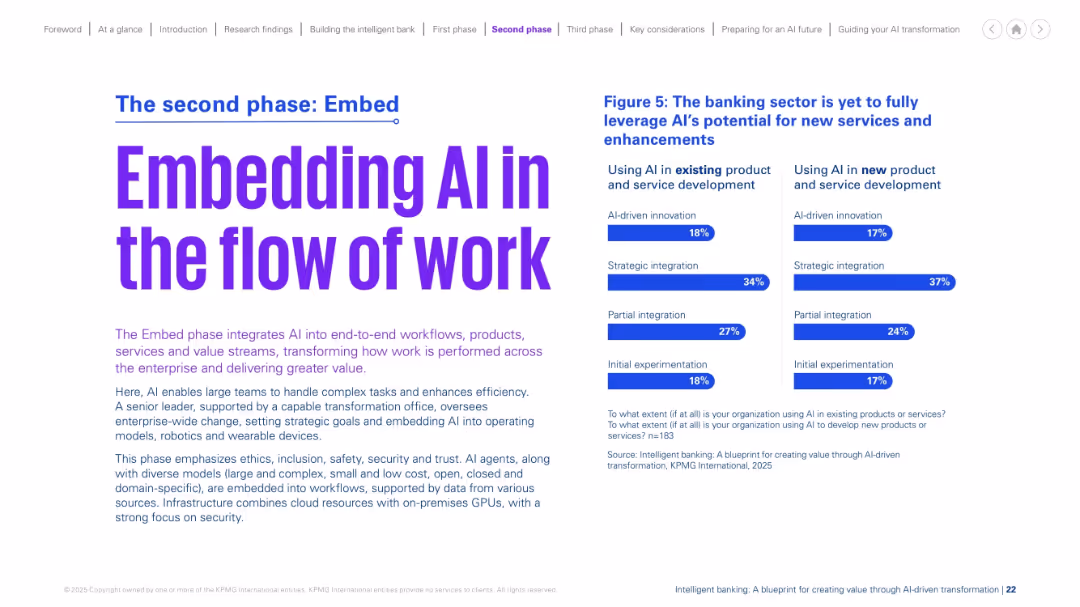
Bold purple headline on left, detailed explanation below. Bar charts on the right show AI adoption in existing vs. new products. Light and clean layout, evenly spaced sections.
Technology and Digital Transformation
Financial Services
This slide introduces the "Embed" phase of AI adoption, which integrates AI into workflows and value streams. It discusses AI's limited current use in product innovation, highlighting gaps in strategic integration. The layout contrasts usage in existing versus new services, reflecting untapped AI potential within banking.
embed, AI workflows, adoption, innovation, product development, banking
Mixed Chart
KPMG
Saved
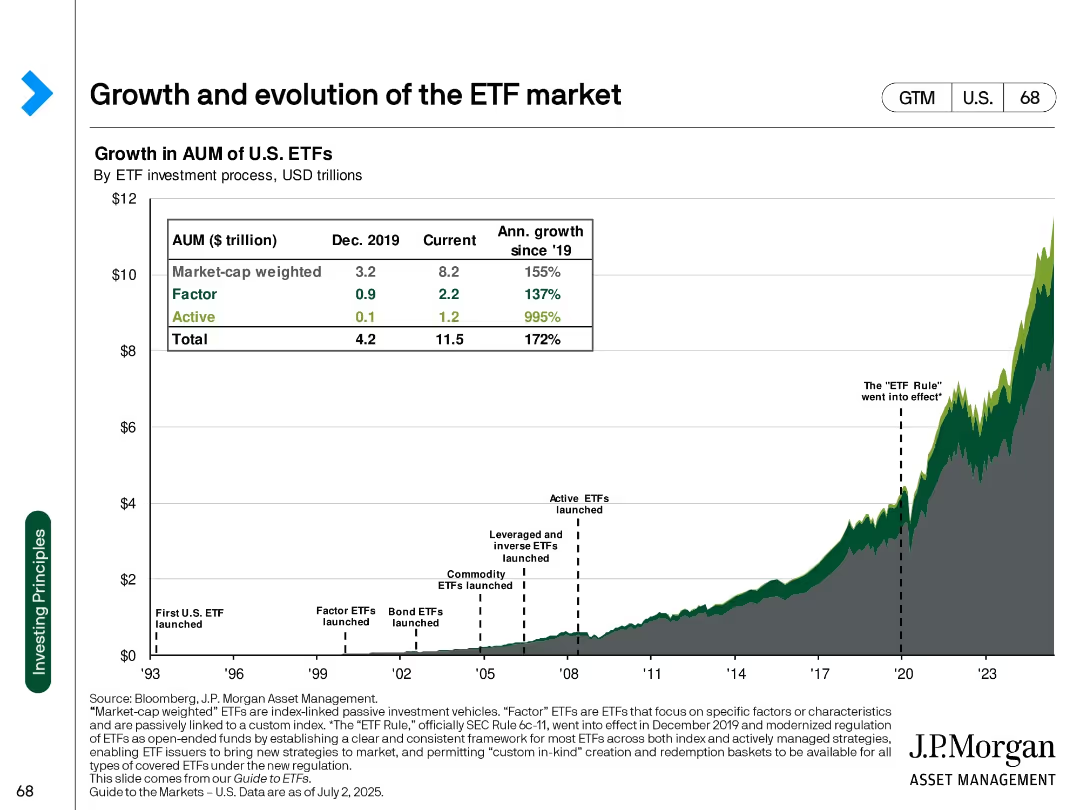
Line and area chart with annotation markers, table overlay showing AUM growth across ETF types
Market Analysis and Trends
Financial Services
Illustrates the historical growth of U.S. ETFs by investment strategy (market-cap weighted, factor, active) with notable regulatory milestones and growth metrics.
ETF, AUM, passive investment, market-cap, growth, regulation, active ETFs, factor, J.P. Morgan, U.S. market
Single Chart
JP Morgan
Saved
Slide with a process timeline and funding source breakdown, including bar and line graphics to represent stages from pre-commercial development to market roll-out.
Market Analysis and Trends
Energy & Utilities
Discusses the EU’s support mechanisms for hydrogen technology through various funding stages, from proof of concept to market readiness, highlighting different EU funding sources.
EU, Funding, Hydrogen, Innovation, Scale-up
Linear Flow
McKinsey
Saved
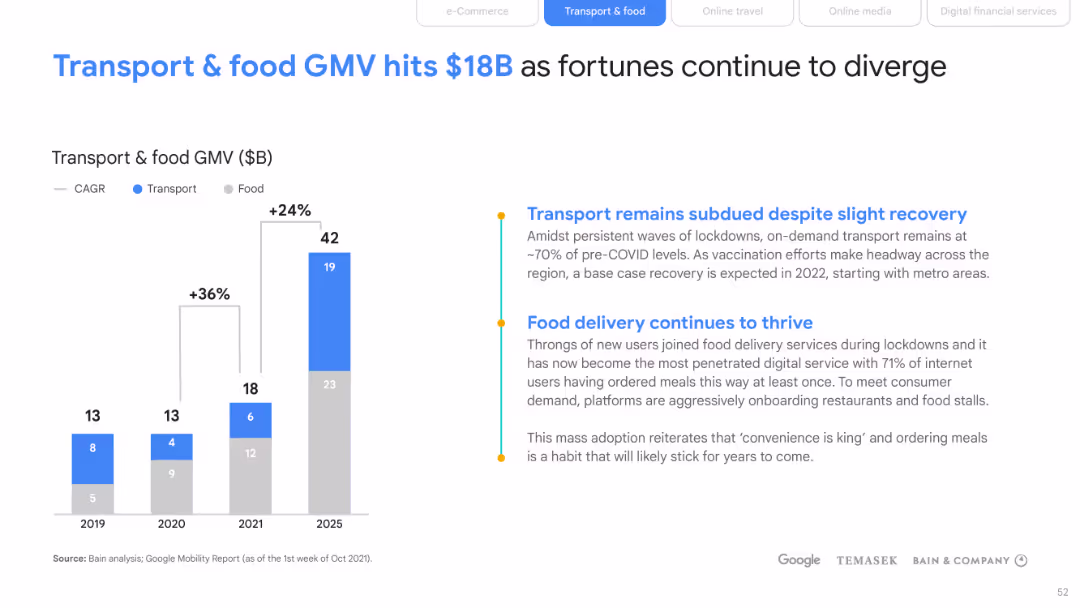
Includes a bar and column chart combo showcasing the GMV in transport and food, with color differentiation and growth percentage annotations.
Market Analysis and Trends
Transportation & Logistics
Examines the divergent fortunes of transport and food segments within the GMV, highlighting the resilience and growth of food delivery services compared to transport. It is useful for stakeholders in the transport and food industries to assess current market conditions and plan accordingly.
Transport, Food, GMV, Growth
Mixed Chart
Bain
Saved
A column chart comparing current online privacy concerns to one year ago across various global regions, indicating changes in concern levels.
Risk Assessment and Management
Technology & Software
The slide assesses the change in online privacy concerns over the past year in different regions, showing the percentage increase or decrease.
column chart, online privacy, concern, comparison, regions, survey, global
Single Chart
IPSOS
Saved
The slide shows a packet of cigarettes broken down into cost components (VAT, excise duty, actual cost) alongside a column chart displaying the number of cigarettes per cost component.
Regulatory and Compliance
Government & Public Sector
Explains the taxation and cost structure of cigarettes with a detailed graphical breakdown of each component's financial contribution to the total cost.
Taxation, cigarettes, VAT, excise duty, consumer cost
Mixed Chart
PwC/Strategy&
Saved
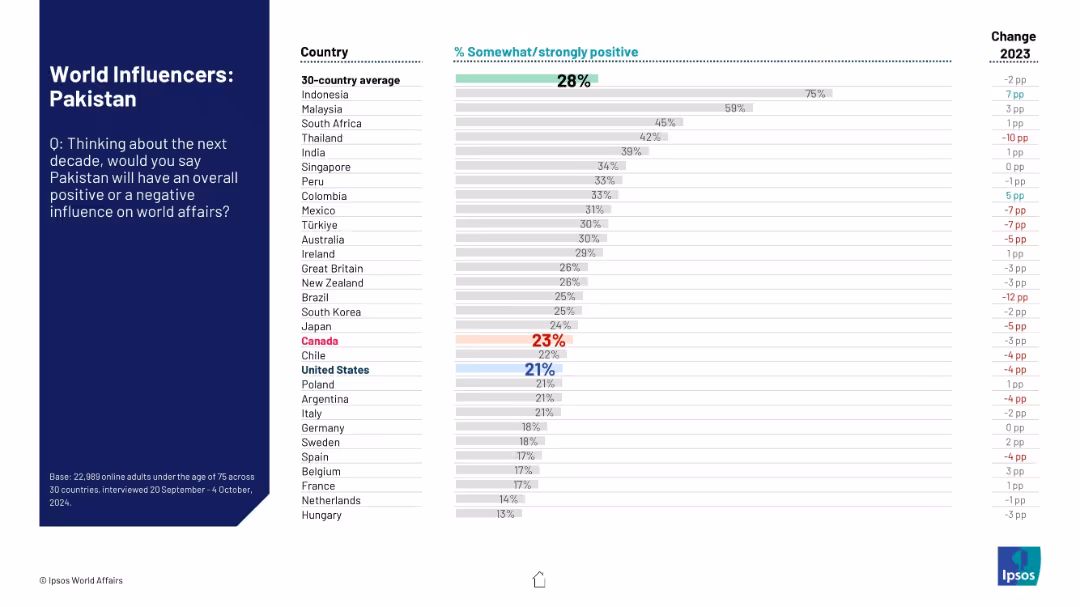
Split layout with dark blue question panel on the left and ranked horizontal bar chart on the right; shows positive perception data across countries with % change from 2023.
Market Analysis and Trends
Government & Public Sector
This slide displays international perceptions of Pakistan's influence on world affairs over the next decade. A 30-country average is shown, with comparative rankings and year-on-year change, highlighting regional sentiment.
global perception, Pakistan, influence, international opinion, Ipsos, world affairs, trends, survey, sentiment shift, geopolitical
Mixed Chart
IPSOS
Saved
Features two sets of column charts comparing equity investments and lending asset yields over a three-year period. It utilizes a simple color scheme to differentiate data from the background.
Financial Performance
Financial Services
Analyzes on-balance sheet investment performance, showing asset yields for equity investments and lending, indicating a consistent track record of strong performance over recent years.
Asset Yield, Performance, Equity, Lending
Multiple Chart
Goldman Sachs
Saved
Multiple line graphs track retail goods sales, excluding auto and fuel, across various countries.
Strategic Planning
Retail & E-commerce
Discusses the shift in retail sales during the pandemic, comparing growth or decline across months and countries, offering insights into consumer behavior changes.
retail sales, trends, pandemic, analysis
Table
BCG
Saved
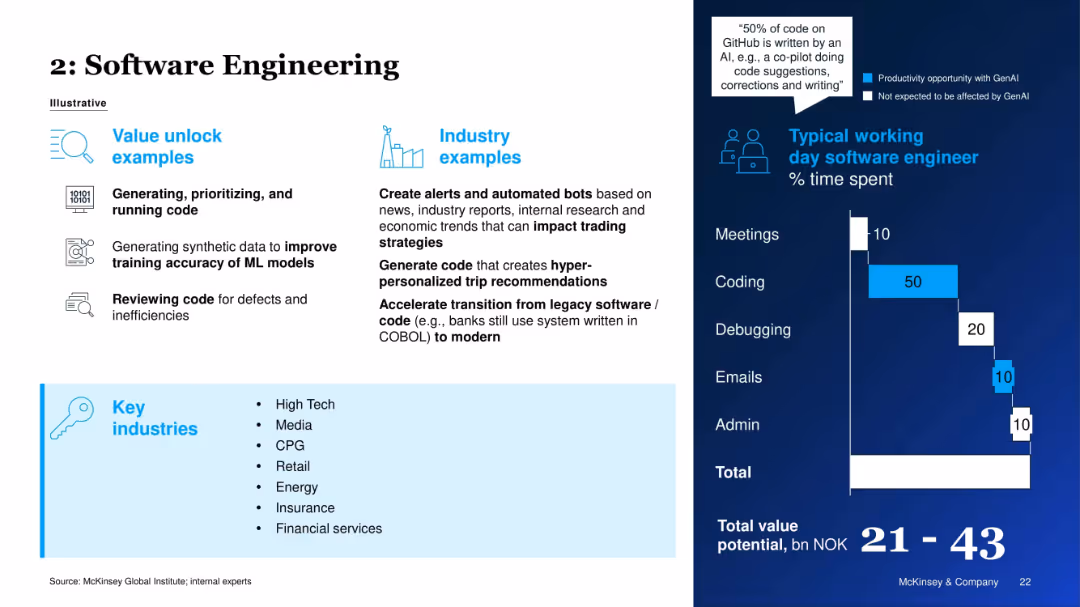
Split layout with value unlock and industry examples on the left; right side shows time spent chart for engineers.
Technology and Digital Transformation
Technology & Software
This slide outlines how GenAI enhances software engineering via code generation, debugging, and synthetic data creation. It shows the daily work distribution of a software engineer, highlighting large GenAI productivity gains in coding tasks.
Software Development, GenAI, Coding Automation, Productivity, Tech Industry, AI Tools, Code Review, Time Allocation
Mixed Chart
McKinsey
Saved
The slide features bar charts showing risks and opportunities percentages. Text boxes detail risks and opportunities, and a summary box highlights key takeaways.
Market Analysis and Trends
Financial Services
It shows survey results indicating a high need for repositioning in financial services functions due to digitalization, with a focus on service, procurement, and WCM.
Digitalization, financial services, risks, opportunities, service, procurement, WCM
Multiple Chart
Roland Berger
Saved
Slide depicting the number of jobs supported by Ford USA, with a bar graph and a worker assembling a vehicle in the background.
Human Resources and Talent Management
Transportation & Logistics
This slide quantifies the impact of Ford USA on job creation, illustrating the multiplier effect of Ford employment on the broader economy.
Ford, employment, multiplier effect, American jobs, automotive industry, manufacturing, dealers, community impact
Single Chart
BCG
Saved
The slide presents various graphical representations, including pie charts, bar graphs, and an illustrative side panel with an image of an industrial scenario. It utilizes green, black, and white color scheme with clean lines and a structured layout.
Technology and Digital Transformation
Technology & Software
Focuses on integrating AI into business processes, highlighting the importance of collaboration between tech teams and business units for effective AI adoption. Stresses on both the financial and transformational impacts of AI with real-world business examples.
AI adoption, business transformation, collaboration, technology integration, industry case study
Mixed Chart
BCG
Saved
Previous
Next
If nothing, comes up, please save your slides first
Create a FREE account to continue browsing
Receive Instant Access to 1,000+ slides from companies like McKinsey, Google, and Goldman Sachs
First Name
Last Name
Email
Password
I agree to all
Terms & Privacy Policy
Thank you! Your submission has been received!
Oops! Something went wrong while submitting the form.
Have an account?
Sign in
Column Chart
Heatmap
Chevron
Org Chart
Infographic
Callouts
Timeline
List
Graphic
Picture
Process Flow
Diagram
Paragraph
Map
Table
Framework
Subtitle
Takeaway Box
Icon
Other Chart
Radar Chart
Waterfall Chart
Mekko Chart
Pie Chart
Scatter Plot
Line Chart
Bar chart
Bullet points