My Account
My Slides
Search by Category
Templates
Leave Feedback
Login
Logout
Get Started
Browse all Slides
Browse all Slides
Create a FREE Account
Instant access to 1,000+ real slides from top companies like McKinsey, BCG, Goldman Sachs, Google and many more!
First Name
Last Name
Email
Password
I agree to all
Terms & Privacy Policy
Thank you! Your submission has been received!
Oops! Something went wrong while submitting the form.
Have an account?
Sign in
Saved Slides
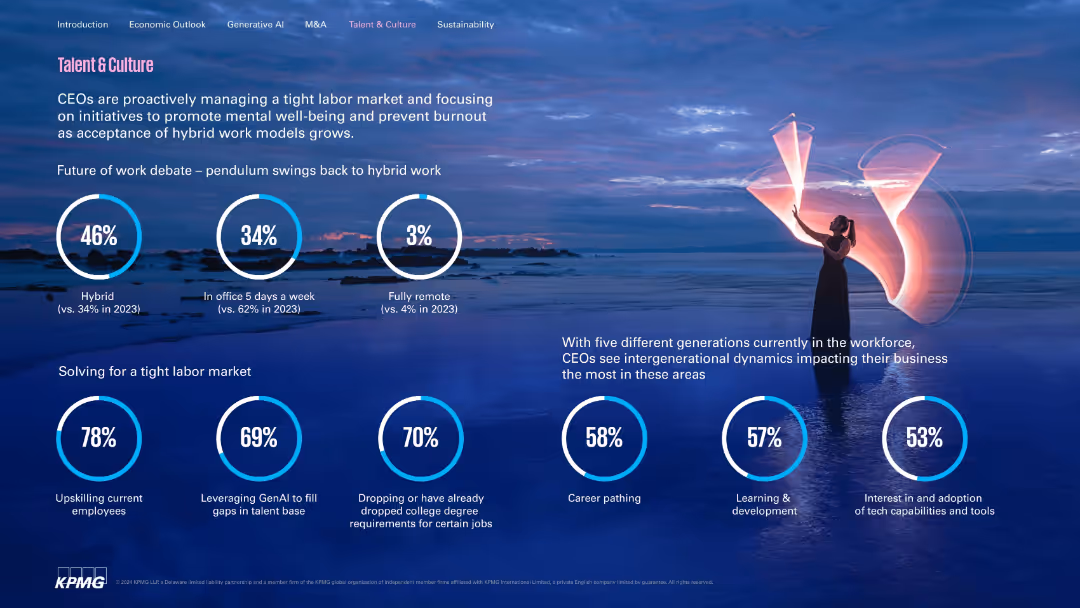
Calm ocean-themed background with circle graphs and icon stats. Focused on labor and hybrid models.
Human Resources and Talent Management
Professional Services
Analyzes CEO responses to labor market dynamics, hybrid vs in-office trends, and intergenerational challenges. Emphasizes upskilling, GenAI integration, and college degree flexibility.
hybrid work, labor market, talent, GenAI, upskilling, workforce trends
Single Chart
KPMG
Saved
Lists key competencies in bullet points with contrasting headers for core competences and rapidly accelerating competences. Clear layout and text hierarchy.
Organizational Structure and Change
Technology & Software
Details Faurecia's core and emerging competencies aimed at enhancing its technological footprint in automotive cockpit innovations, with a focus on AI and data analytics enhancements.
competencies, innovation, automotive, AI, data analytics, technology
Boxed
Deutsche Bank
Saved
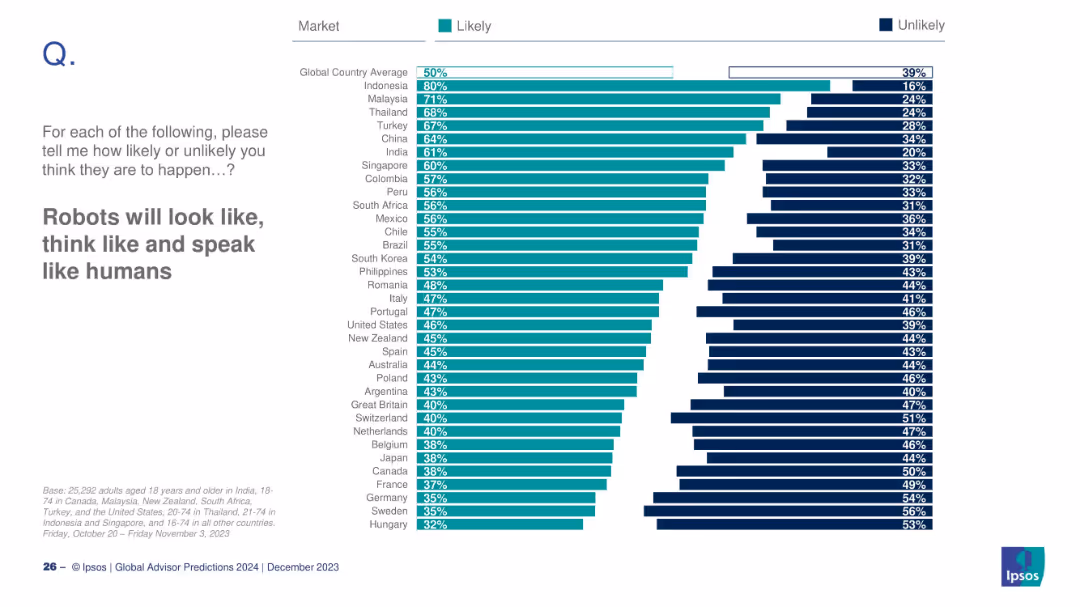
Bar chart ordered by belief in humanoid robots
Technology and Digital Transformation
Artificial Intelligence
The slide explores belief levels across countries about robots becoming more humanlike in appearance and behavior. It shows how this belief varies by market, with a global average and specific country ratings.
robots, AI, humanlike machines, belief, global sentiment
Mixed Chart
IPSOS
Saved
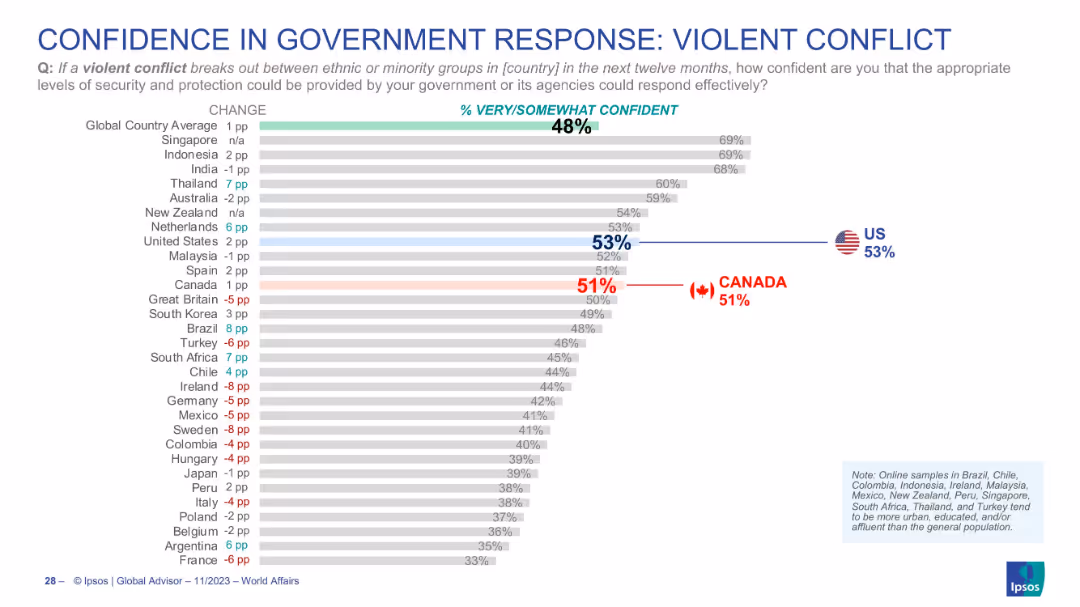
Horizontal bar chart; shows confidence in handling violent ethnic or minority group conflicts; country rankings; Canada and US emphasized.
Regulatory and Compliance
Government & Public Sector
This slide captures public opinion on how confident they are that their government can effectively manage a violent conflict involving ethnic or minority groups. With a global average confidence of 48%, the US scores 53% and Canada 51%. The data points to national variances in public faith in social stability mechanisms.
ethnic conflict, government capacity, confidence, risk management, Canada, USA, public opinion, Ipsos
Single Chart
IPSOS
Saved
A column chart displaying the cost per passenger mile for different transport modes including public transport, taxis, and autonomous vehicles like Uber and robotaxis, with costs represented by varying heights of bars in different shades of green.
Competitive Landscape
Transportation & Logistics
Compares the cost-effectiveness of traditional public transport with emerging options like ridesharing and autonomous vehicles, particularly focusing on scenarios like NYC. Useful for strategic decision-making in transport economics.
transport costs, ridesharing, autonomous vehicles, public transit, NYC
Single Chart
BCG
Saved
Column charts, text, and image of a woman with headphones. Data on exclusion, flexibility, mental health, and caregiving in hybrid vs. remote environments.
Human Resources and Talent Management
Professional Services
Discusses the exclusion and lack of flexibility for women in hybrid work environments and its impact on their mental health and stress levels.
hybrid work, flexibility, exclusion, mental health, stress, caregiving, women, support, employers
Multiple Chart
Deloitte
Saved
Packed with pie charts and bar charts detailing skill supply issues and their impact on empowerment.
Human Resources and Talent Management
Professional Services
Focuses on the impact of skill shortages on employee empowerment, important for HR planning and educational program development.
Skills Gap, Employee Empowerment, HR Planning, Educational Programs, Workforce Development
Multiple Chart
PwC/Strategy&
Saved
The slide uses four columns to depict investments, governance, steering, and transparency, each with examples like client committees and scorecards. The bottom section reinforces the commitment to protecting franchise and reputation.
Regulatory and Compliance
Financial Services
The slide focuses on the importance of risk management and compliance, showing investments in support, governance through client committees, steering via scorecards, and transparency with a consolidated client view. The goal is to facilitate sustainable growth.
risk management, compliance, governance, transparency, investments
Pillar
Credit Suisse
Saved
Pie chart with detailed segments showing distribution of total deposits by customer type.
Financial Performance
Financial Services
Analyzes deposit base stability across different banking sectors, noting insured percentages and business relations longevity.
banking, deposits, stability, customer base, insurance
Mixed Chart
Barclays
Saved
The slide features a bar chart with horizontal bars of different shades of blue indicating various strategic work models.
Market Analysis and Trends
Professional Services
This slide presents strategies that leaders are considering or currently deploying to optimize their work models, highlighting trends in coworking spaces, workweek models, and investment in real estate.
strategic, work models, coworking, real estate, digital collaboration, downsizing, future workplace, investment, four-day workweek, office footprint
Single Chart
EY
Saved
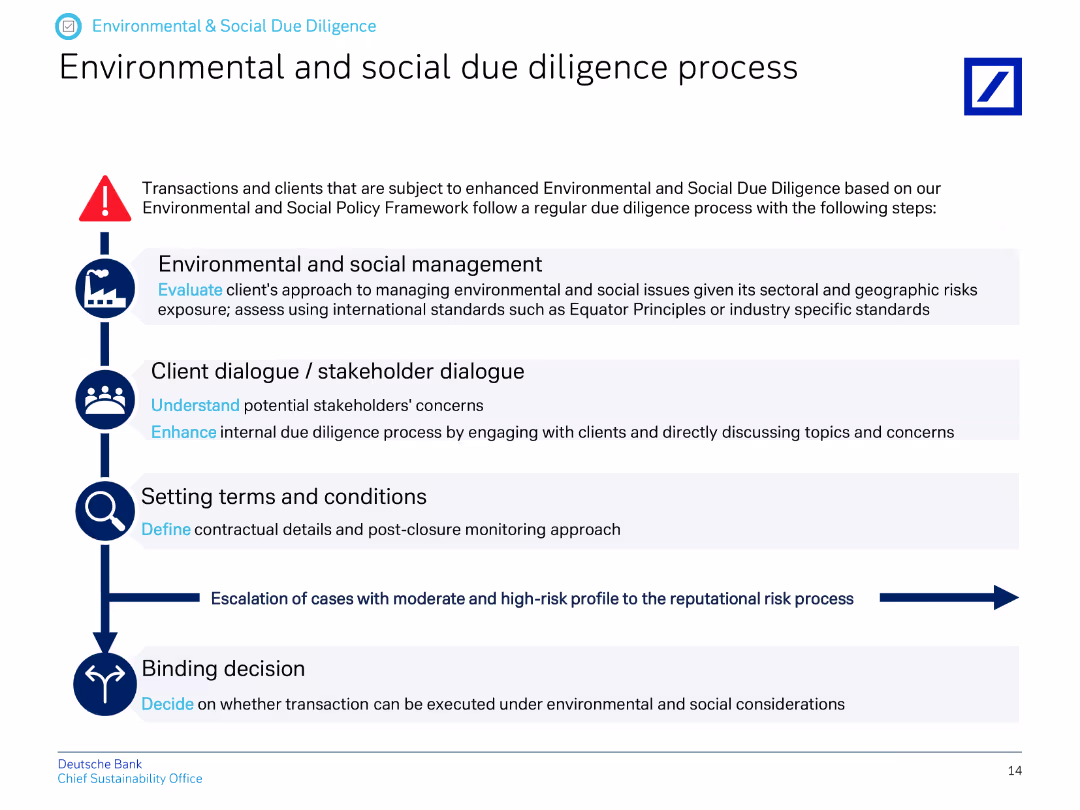
The slide presents a vertical flow chart outlining the steps in the environmental and social due diligence process.
Regulatory and Compliance
Financial Services
This slide explains the process for environmental and social due diligence, detailing steps from management to stakeholder dialogue, setting terms, and making binding decisions.
due diligence, environmental process, social process, stakeholder dialogue, terms and conditions, decision-making
Vertical Flow
Deutsche Bank
Saved
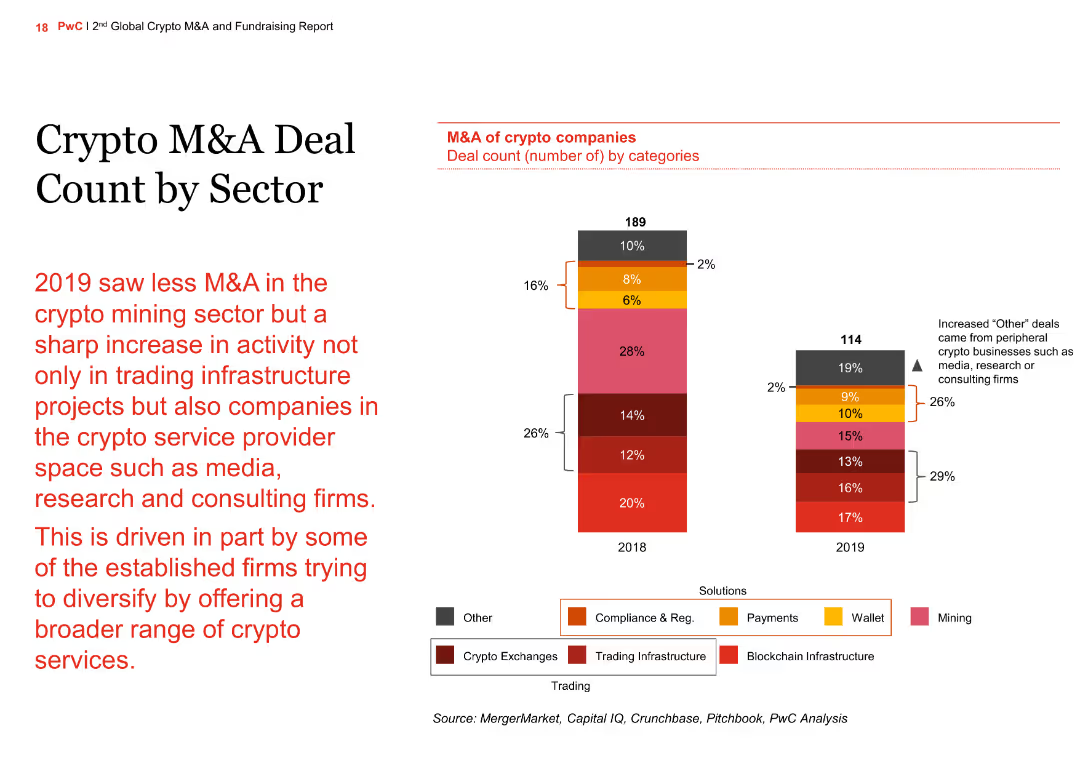
This slide includes a column chart showing the number of M&A deals by sector for the years 2018 and 2019. Sectors include mining, trading, and various service providers like media, research, and consulting.
Market Analysis and Trends
Financial Services
The slide highlights the decline in M&A activity in the crypto mining sector in 2019 and an increase in deals within the service provider space, driven by firms diversifying their service offerings.
crypto, M&A, sector, column chart, comparison
Mixed Chart
PwC/Strategy&
Saved
The visual complexity is moderate with a layout that presents key end-markets requiring emissions management through iconography and text. The design facilitates an easy understanding of where emissions management systems are most needed and the potential for automation within these sectors.
Technology and Digital Transformation
Industrial & Manufacturing
The slide identifies the main industrial sectors that necessitate robust emissions management, such as Oil & Gas and Power Generation, and highlights the potential automation applications within these sectors. It offers insights into how automation can improve emissions monitoring and reporting, thus optimizing the underlying processes for better efficiency and regulatory compliance.
Emissions management, Automation potential, Industrial sectors, Regulatory compliance
Pillar
LEK
Saved
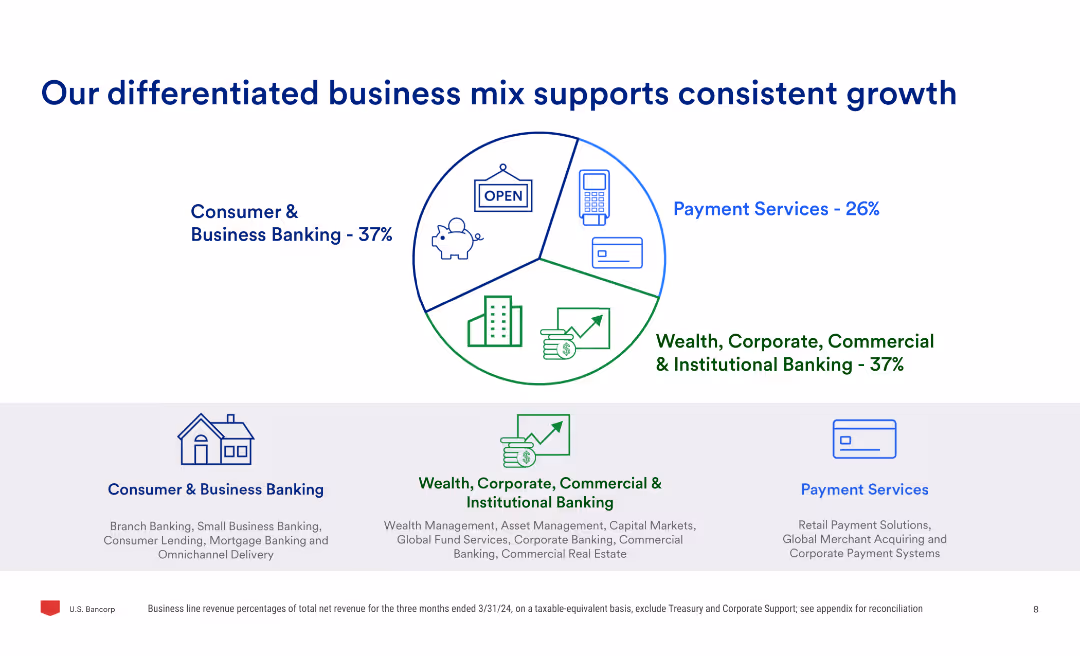
The slide uses a pie chart to show the business mix percentages and three sub-sections detailing consumer & business banking, payment services, and wealth, corporate, commercial & institutional banking.
Market Analysis and Trends
Financial Services
Highlights the company's diversified business model, showing the percentage contribution of different business segments and explaining the services offered in consumer & business banking, payment services, and institutional banking.
business mix, growth, banking, payment services, wealth, commercial, institutional, market analysis
Mixed Chart
Barclays
Saved
Line charts showing preferred modes for multimodal travel across different generations
Market Analysis and Trends
Transportation & Logistics
Explores preferred modes of transportation for multimodal travel among different generations
Multimodal travel, transportation, generations, survey, EY
Multiple Chart
EY
Saved
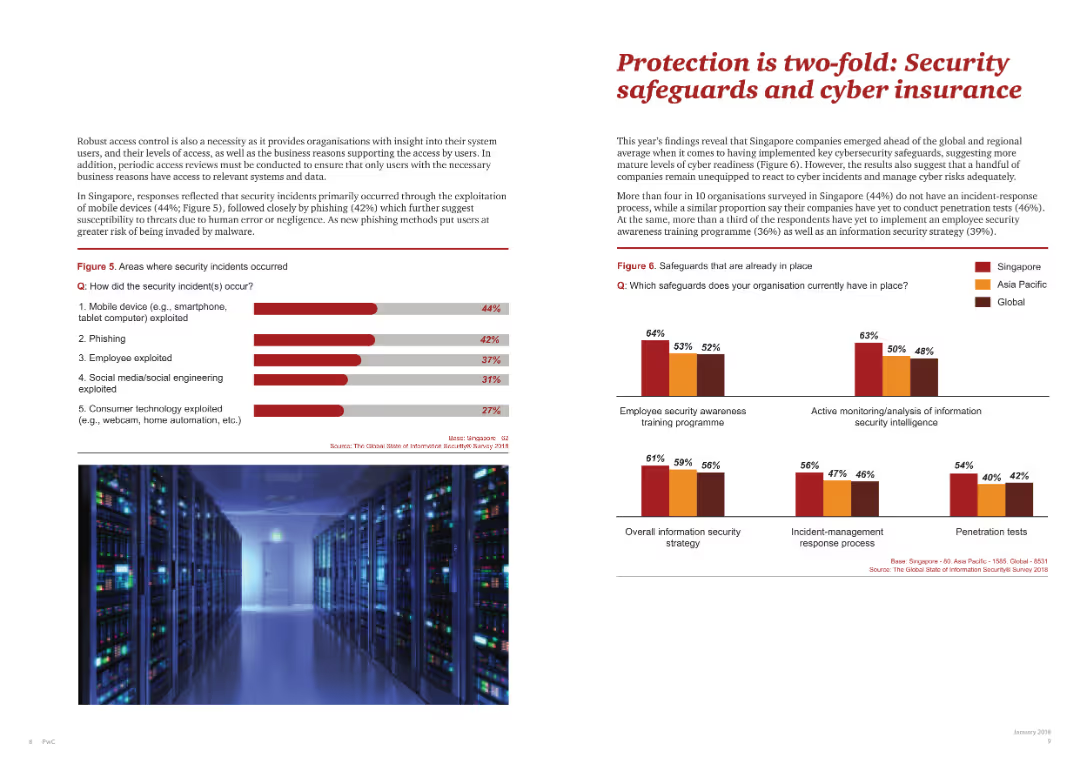
Includes two bar charts showing areas where security incidents occurred and safeguards in place.
Risk Assessment and Management
Telecommunications
Examines the dual approach of using security safeguards and cyber insurance to protect against cyber threats, based on survey data.
security safeguards, cyber insurance, cyber threats, survey data, protection strategies
Multiple Chart
PwC/Strategy&
Saved
Displays characteristics of blockchain like decentralization and encryption, using icons and short text blocks arranged around a central circular graphic that symbolically represents a blockchain network.
Technology and Digital Transformation
Technology & Software
Highlights the essential attributes of blockchain technology, including security, flexibility, and its decentralized nature. Suitable for discussions on how blockchain can be integrated into various business or technology solutions.
blockchain, decentralization, encryption, data security, flexibility
Diagram
McKinsey
Saved
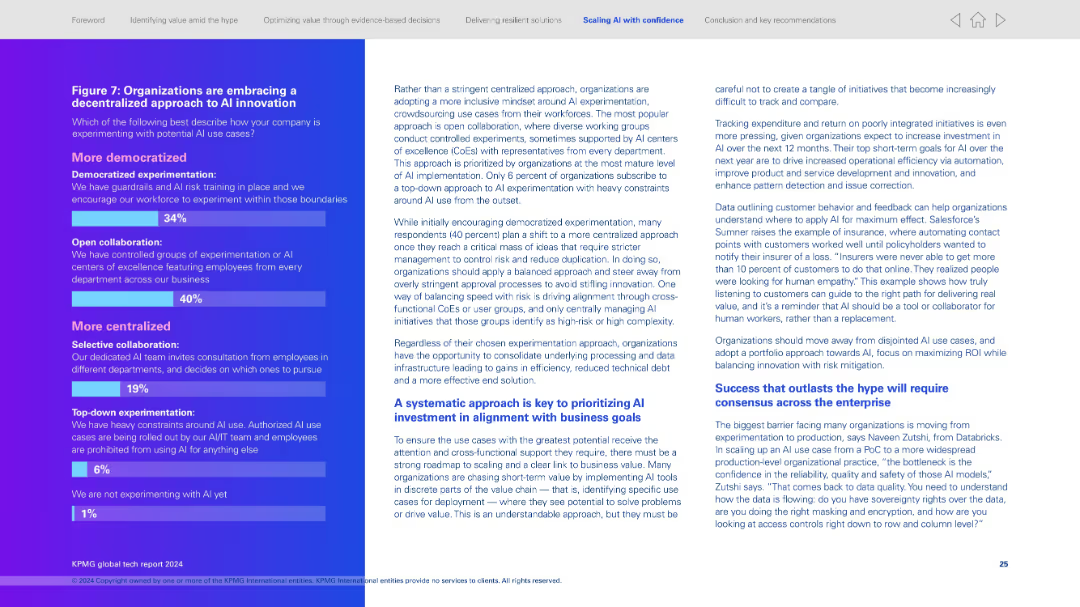
Left side presents a survey result in gradient bar chart format; right side contains detailed explanatory text on experimentation strategies.
Technology and Digital Transformation
Artificial Intelligence
Highlights shift from centralized to decentralized AI experimentation. Shows most organizations prefer open collaboration (40%) or democratized approaches (34%). Right panel elaborates on balanced experimentation models and aligning AI with business outcomes.
AI innovation, decentralized experimentation, collaboration, democratized AI, strategic alignment, innovation culture, organizational maturity
Mixed Chart
KPMG
Saved
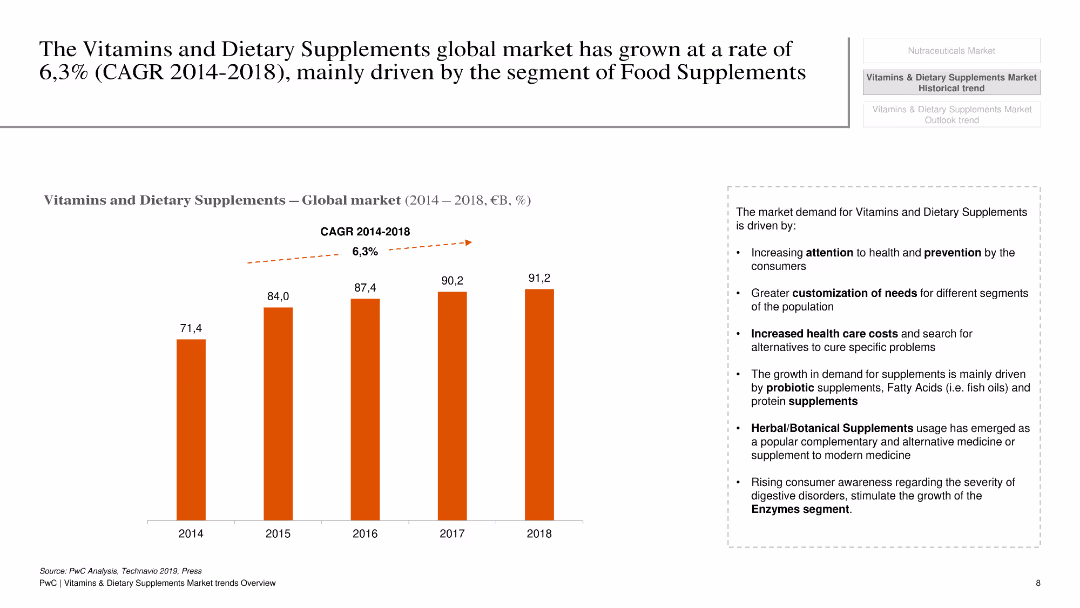
The slide has a white background with a column chart showing global market growth of vitamins and dietary supplements from 2014 to 2018.
Market Analysis and Trends
Healthcare & Pharmaceuticals
This slide presents the growth rate of the global market for vitamins and dietary supplements, highlighting the CAGR and key growth drivers.
Vitamins, dietary supplements, market growth, CAGR, global, healthcare, pharmaceuticals, trends, analysis
Mixed Chart
PwC/Strategy&
Saved
The slide presents online market growth for luxury goods in 2017, with detailed segment analysis including hard luxury, beauty, apparel, and accessories. It uses a mix of a column chart and texts in a dynamic layout, employing red to highlight growth areas and gray for the background.
Market Analysis and Trends
Consumer Goods
Discusses the significant growth of the online luxury goods market, breaking down the performance by product category and business model. Highlights how strategic partnerships and a focus on specific segments like e-tailers and brand websites have driven substantial growth.
online market, luxury goods, growth analysis, digital strategy
Single Chart
Bain
Saved
Map and text slide providing an overview of A.T. Kearney’s global presence, client base, and team structure.
Industry Overview
Professional Services
Provides an overview of A.T. Kearney's global scale in consulting across various industries, functions, and geographies, with significant client and team details.
consulting, global, industries, clients, team
Graphic
Kearney
Saved
Utilizes icons and color-coded risk categories to explain the EU's proposed AI regulations. It includes detailed descriptions of risk categories and compliance implications.
Regulatory and Compliance
Government & Public Sector
Discusses the proposed EU regulations for AI, detailing risk categories, compliance requirements, and the impact on AI applications across various sectors.
AI regulation, EU policies, compliance, risk management, regulatory impact
Table
BCG
Saved
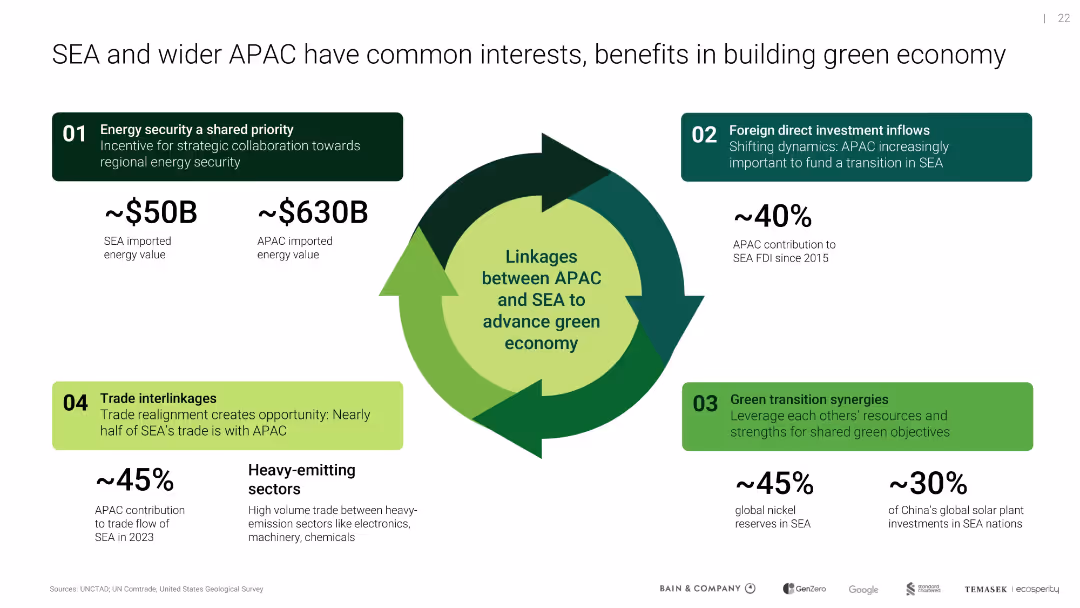
Circular flow arrow graphic surrounded by data-rich quadrants with trade, FDI, and sector stats
Industry Overview
Environmental Services & Sustainability
Demonstrates how APAC-SEA cooperation can support energy security, investment, and transition synergies via trade, FDI, and shared resources in high-emitting sectors.
APAC, SEA, green economy, energy security, FDI, trade interlinkages
Vertical Flow
Bain
Saved
Features a line graph showing the growth in quarterly internet advertising revenues from 1996 to 2020, with a peak in Q4 2020 highlighted.
Market Analysis and Trends
Media & Entertainment
Highlights the upward trend in internet advertising revenues over decades, with a focus on the record-high revenues achieved in Q4 2020 due to political and holiday advertising.
advertising, revenue, quarterly, growth, record-high, internet, 2020, media, technology
Single Chart
PwC/Strategy&
Saved
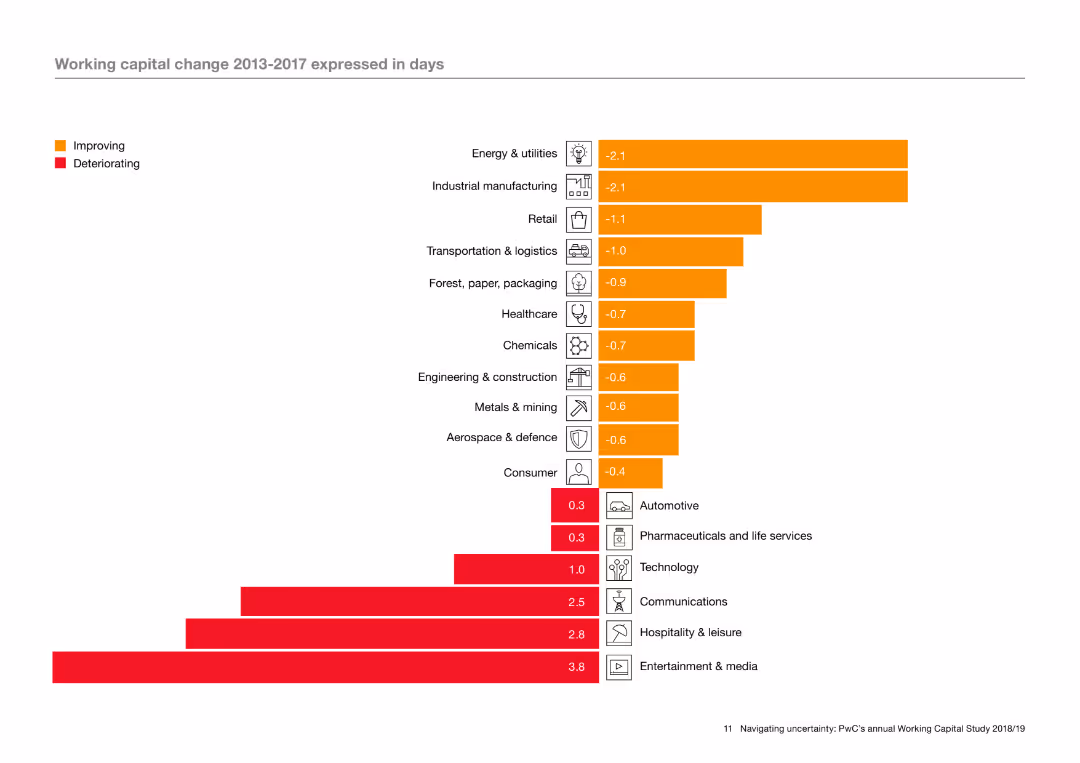
The slide features a column chart with horizontal bars indicating working capital change in various industries from 2013 to 2017. The bars are color-coded to show improving and deteriorating metrics. Icons representing different industries are aligned on the left of the chart.
Operational Efficiency
Industrial & Manufacturing
The slide analyzes working capital changes across different industries over a five-year period, using a column chart to illustrate which industries have seen improvements or deteriorations. The analysis highlights trends in operational efficiency within these sectors.
Working capital, operational efficiency, industry trends, improvement, deterioration, column chart
Single Chart
PwC/Strategy&
Saved
Previous
Next
If nothing, comes up, please save your slides first
Create a FREE account to continue browsing
Receive Instant Access to 1,000+ slides from companies like McKinsey, Google, and Goldman Sachs
First Name
Last Name
Email
Password
I agree to all
Terms & Privacy Policy
Thank you! Your submission has been received!
Oops! Something went wrong while submitting the form.
Have an account?
Sign in
Column Chart
Heatmap
Chevron
Org Chart
Infographic
Callouts
Timeline
List
Graphic
Picture
Process Flow
Diagram
Paragraph
Map
Table
Framework
Subtitle
Takeaway Box
Icon
Other Chart
Radar Chart
Waterfall Chart
Mekko Chart
Pie Chart
Scatter Plot
Line Chart
Bar chart
Bullet points