My Account
My Slides
Search by Category
Templates
Leave Feedback
Login
Logout
Get Started
Browse all Slides
Browse all Slides
Create a FREE Account
Instant access to 1,000+ real slides from top companies like McKinsey, BCG, Goldman Sachs, Google and many more!
First Name
Last Name
Email
Password
I agree to all
Terms & Privacy Policy
Thank you! Your submission has been received!
Oops! Something went wrong while submitting the form.
Have an account?
Sign in
Saved Slides
A U.S. map pinpointing U.S. Bank and State Farm locations, alongside line graphs showcasing crypto fund flows and the number of new accounts, using red and blue colors.
Strategic Planning
Financial Services
Outlines strategic partnerships with State Farm and NYDIG, detailing the expansion of deposit accounts and the introduction of cryptocurrency custody services, reflecting diversification and digital advancement strategies.
Strategic Partnerships, Crypto, State Farm
Multiple Chart
Goldman Sachs
Saved
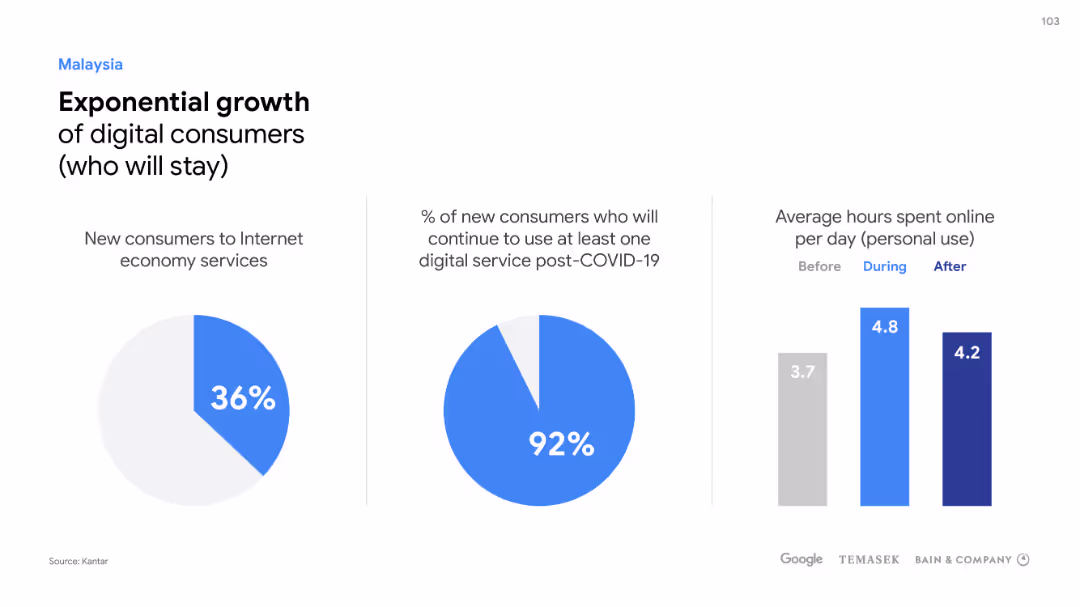
Two pie charts and a column chart detail Malaysia's digital consumer growth, continuity post-COVID-19, and online activity.
Market Analysis and Trends
Technology & Software
Demonstrates Malaysia's digital consumer surge and the ongoing engagement in internet economy services post-pandemic.
Digital consumers, Malaysia, Growth, Internet economy, COVID-19, Online activity, Engagement
Multiple Chart
Bain
Saved
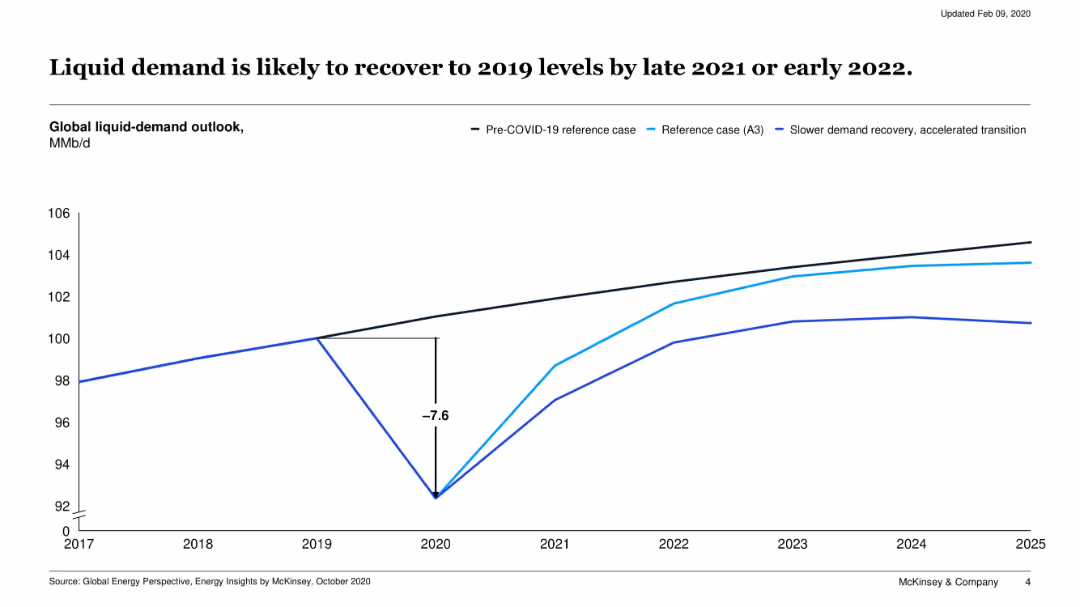
Line chart showing three global liquid-demand outlook scenarios from 2017 to 2025: pre-COVID, reference case, and accelerated transition.
Market Analysis and Trends
Energy & Utilities
This slide models the impact of COVID-19 on global liquid fuel demand, showing a sharp dip in 2020 followed by a recovery trajectory. It compares multiple scenarios including slower and faster transitions.
oil demand, COVID-19 impact, recovery, energy demand, liquid fuels, 2020, forecast
Single Chart
McKinsey
Saved
Features a multi-line chart depicting responses on strategic intent for D&I, with specific focus differences by region and demographic, annotated for clarity.
Strategic Planning
Professional Services
Focuses on the perceptions of U.S. non-minority women regarding strategic intent in D&I, suggesting areas for improvement.
D&I, strategic intent, U.S., non-minority women, line chart, improvement areas, demographic focus
Mixed Chart
Accenture
Saved
The slide contains an image of people in a meeting on the left, with two column charts on the right comparing asset class performance relative to expectations for 2021 and 2022.
Human Resources and Talent Management
Financial Services
This slide assesses how different asset classes performed relative to investor expectations for the years 2021 and 2022, highlighting overperformance and underperformance.
performance, expectations, asset classes, 2021, 2022, overperformance, underperformance
Multiple Chart
EY
Saved
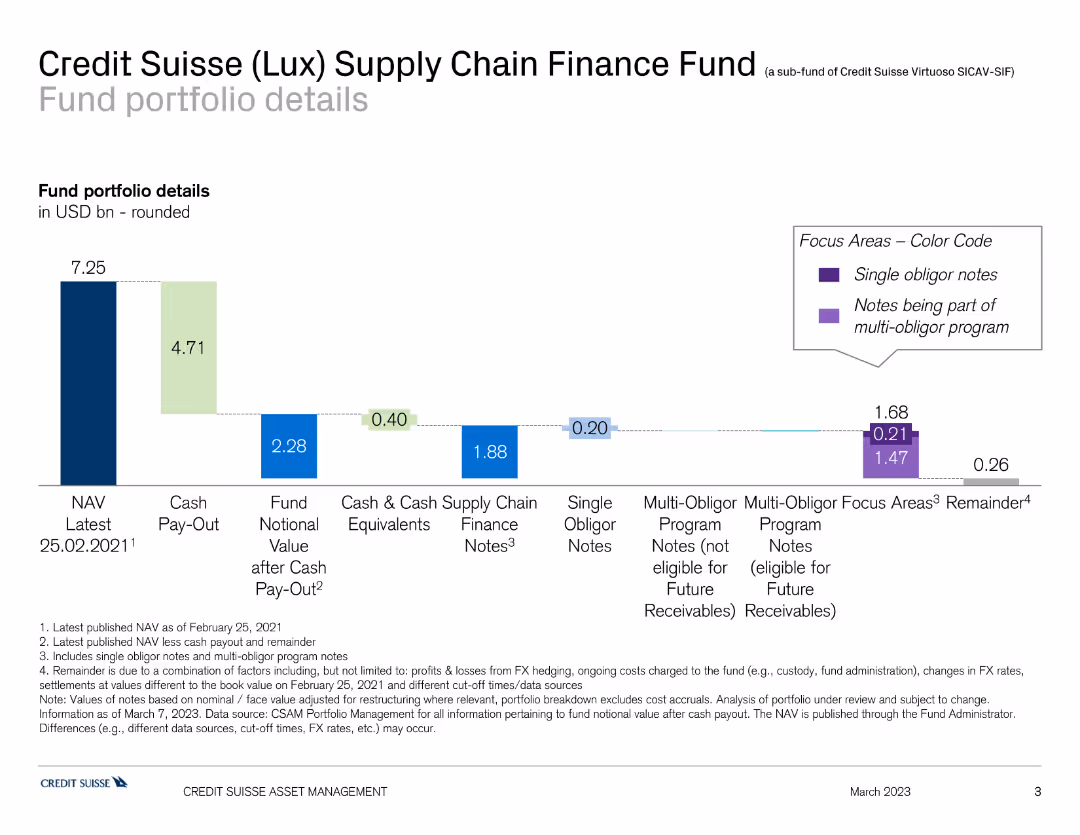
This slide shows a bar chart detailing the fund portfolio of the Credit Suisse Supply Chain Finance Fund, with different colors indicating various components such as NAV, cash pay-out, and finance notes.
Investment Analysis
Financial Services
The slide provides an overview of the Credit Suisse Supply Chain Finance Fund's portfolio, showing asset allocation and financial status. It is used for fund analysis and investment review.
finance, supply chain, portfolio, Credit Suisse, fund analysis
Single Chart
Credit Suisse
Saved
Column chart show CCB adjusted expense over time with annotations for structural changes, investments, and outlook. A sidebar provides details on cumulative changes and factors influencing adjustments.
Investment Analysis
Financial Services
This slide details JP Morgan Chase & Co.'s adjusted expenses in the context of investments and structural changes, offering insights into financial planning and strategic investment decisions. It is likely intended for financial analysts and investors.
adjusted expenses, investment planning, JP Morgan Chase, financial analysis, strategic decisions
Single Chart
JP Morgan
Saved
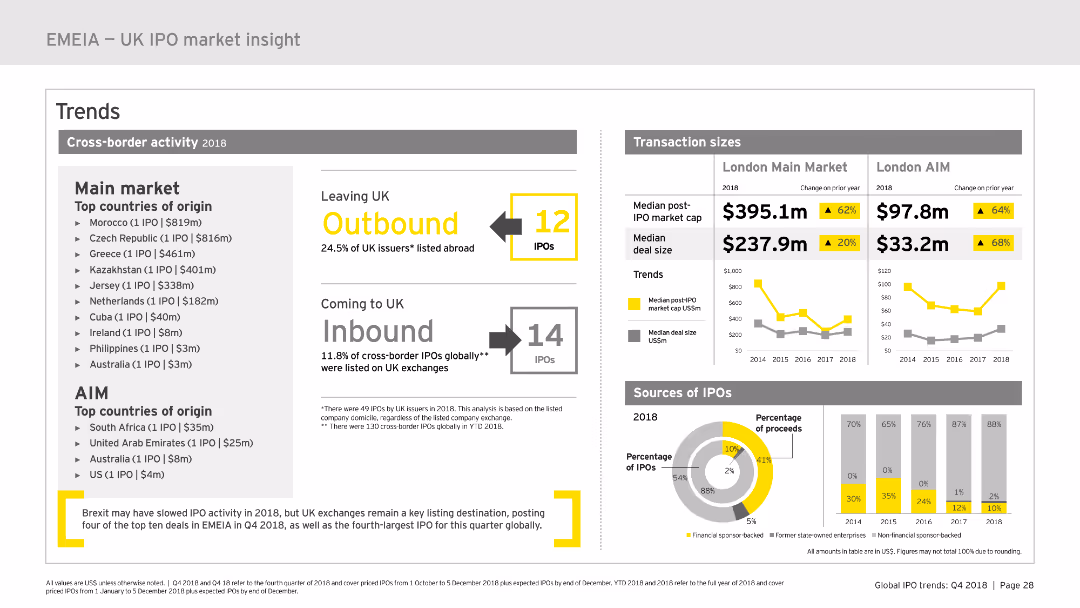
The slide features various charts including a column chart and a pie chart, highlighting cross-border IPO activity, transaction sizes, and sources of IPOs in 2018.
Market Analysis and Trends
Financial Services
Provides insights into cross-border IPO activity in the UK for 2018, highlighting outbound and inbound IPOs, transaction sizes, and IPO sources.
IPO, market cap, outbound, inbound, transaction size, median, deal size, percentage, financial services, 2018
Multiple Chart
EY
Saved
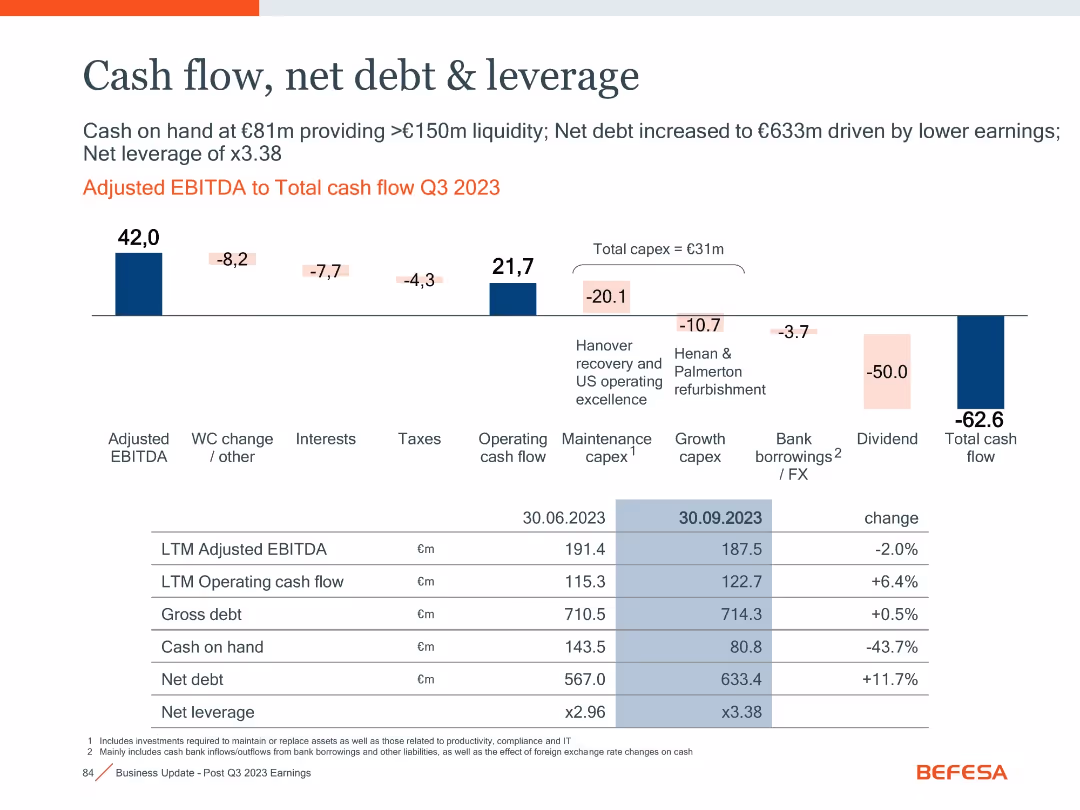
Horizontal waterfall chart and detailed financial metrics table
Financial Performance
Financial Services
The slide illustrates cash flow movement in Q3 2023, highlighting major components like capex, dividend payouts, and leverage metrics, with changes over time.
Cash Flow, Leverage, Net Debt, Capex, Dividend, EBITDA
Mixed Chart
Goldman Sachs
Saved
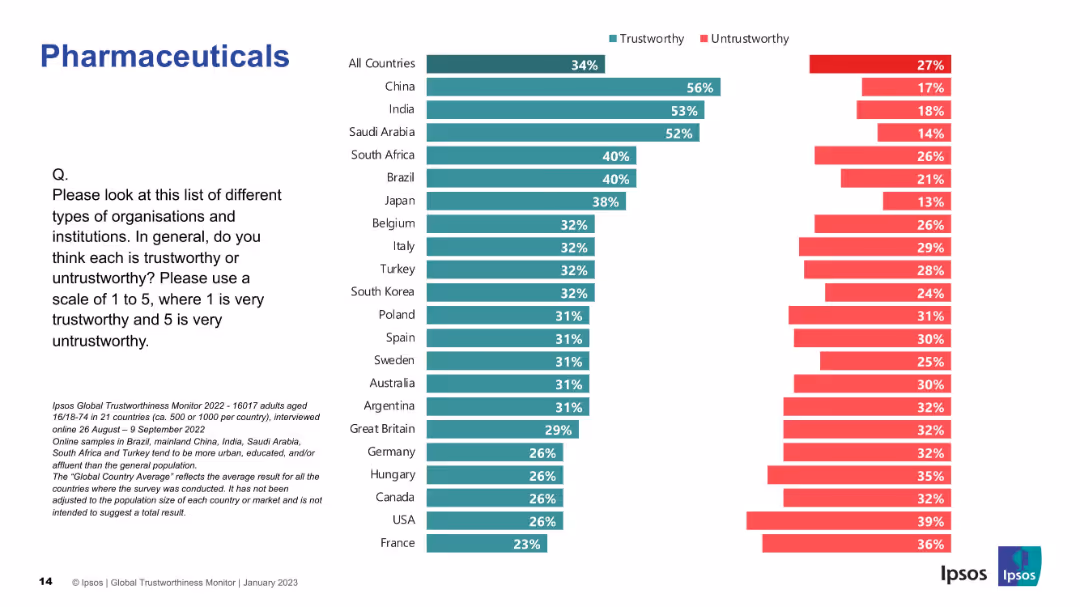
Vertical ranking bar chart; green/red bars show public trust in pharmaceutical sector by country.
Market Analysis and Trends
Healthcare & Pharmaceuticals
The slide reveals global trust levels in pharmaceutical companies, with China, India, and Saudi Arabia perceived as most trustworthy.
pharma, trust, global ranking, countries, survey, perception, Ipsos, healthcare, trustworthy, untrustworthy
Mixed Chart
IPSOS
Saved
A bar chart on the left shows typical indirect spend per category, with pie charts on the right indicating Commercial and Demand management focus.
Operational Efficiency
Professional Services
This slide depicts typical indirect spend by category (Professional Services, Human Resource, etc.) and their focus on Commercial and Demand management.
Indirect spend, categories, commercial, demand management, bar chart, pie chart
Single Chart
EY
Saved
The slide contains two line graphs. The left graph plots the Consumer Price Index (CPI) and exchange rate (BRL per USD) over time, marked from 2007 to 2023 with a % change y-o-y. The right graph shows the Bovespa index over the same timespan, indexed to January 2007 = 100. The graphs are color-coded, with annotations and a title at the top.
Market Analysis and Trends
Financial Services
This slide presents economic data for Brazil, comparing inflation and exchange rates with stock market performance. The juxtaposition of CPI and exchange rate trends alongside the Bovespa index indicates a nuanced narrative of economic conditions, suggesting for detailed market analysis.
Brazil, inflation, exchange rate, Bovespa index, economic analysis, CPI, market performance, trend, financial chart, currency valuation
Multiple Chart
McKinsey
Saved
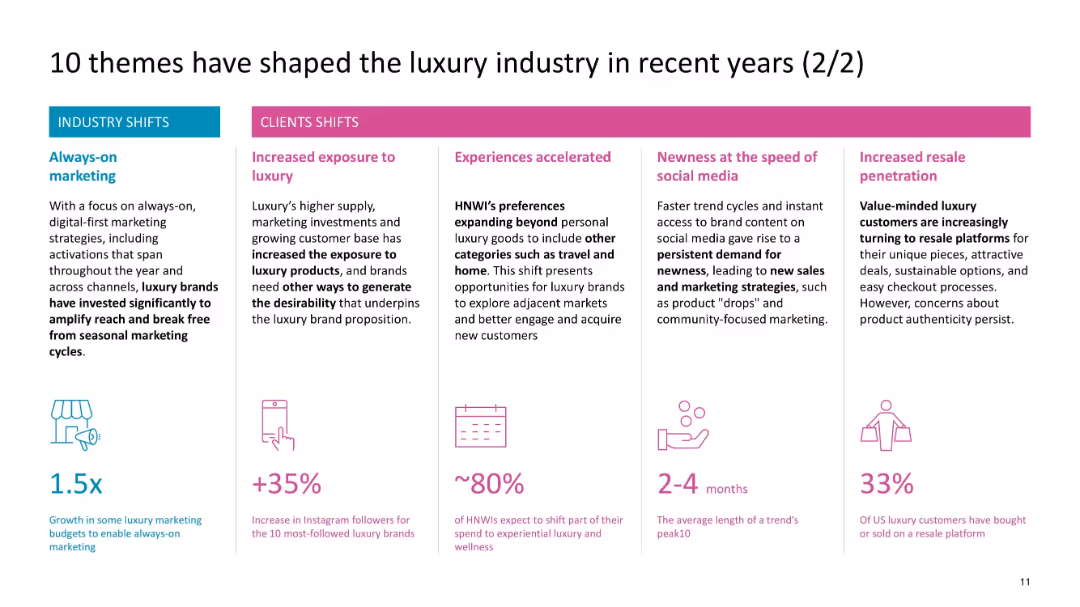
Horizontal layout with five themed boxes on client shifts
Customer and Market Segmentation
Consumer Goods
This slide outlines five client-side changes such as increased exposure, resale growth, always-on marketing, and faster trend cycles via social media.
resale, social media, client behavior, trend cycles, Instagram growth, marketing strategy
Pillar
McKinsey
Saved
Contains a central diagram surrounded by four quadrants depicting demand, supply, financing, and responsibility, all linking back to technology's central role in mineral criticality.
Strategic Planning
Environmental Services & Sustainability
Outlines the impact of technology on mineral criticality, emphasizing political, technological, and financial interactions. Useful for discussions on sustainable resource management.
mineral criticality, technology, sustainability, supply and demand, diagram, strategic planning, environmental impact
Diagram
McKinsey
Saved
Column chart with additional financial metrics on the right, along with detailed narrative explanations.
Risk Assessment and Management
Financial Services
The slide evaluates the commodities and global markets sectors, detailing the strong underlying client business and positioning for future opportunities. It’s beneficial for risk assessment and informing about strategic positioning in response to market conditions, tailored for risk managers and investment strategists.
commodities, markets, risk, client business, opportunities
Mixed Chart
Morgan Stanley
Saved
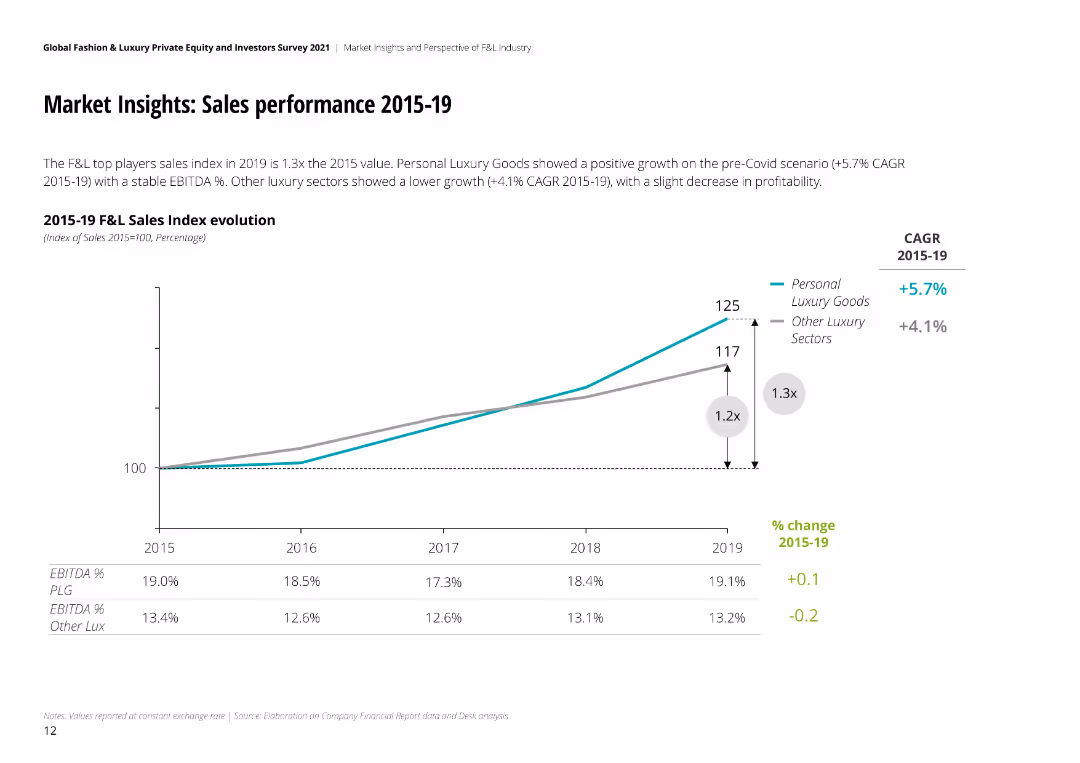
The slide features a line chart showing sales index evolution from 2015 to 2019, with CAGR values and EBITDA percentage changes.
Market Analysis and Trends
Retail & E-commerce
Reviews sales performance in the fashion and luxury market from 2015 to 2019, highlighting growth rates and profitability trends over the years.
sales, performance, market, fashion, luxury, CAGR, EBITDA, growth, profitability
Mixed Chart
Deloitte
Saved
The slide contains line charts comparing scale versus valuation and growth-adjusted EBITDA multiples versus leverage for large-cap and small-cap firms.
Investment Analysis
Financial Services
The slide analyzes the impact of scale and conservative capital structures on valuations and growth potential. It shows that larger, conservatively leveraged firms receive higher valuation premiums and credits for growth. This slide is suitable for investment analysis and strategy formulation discussions.
scale, capital structure, leverage, valuation, growth
Multiple Chart
JP Morgan
Saved
Contains text with icons and a circular diagram, using a green and white color scheme. The layout is well-structured and clear.
Organizational Structure and Change
Professional Services
Highlights the importance of personnel in driving the company's evolution, suitable for discussions on company culture and human resources.
Company Culture, Organic Growth, Accountability, Integrity
Mixed Chart
Morgan Stanley
Saved
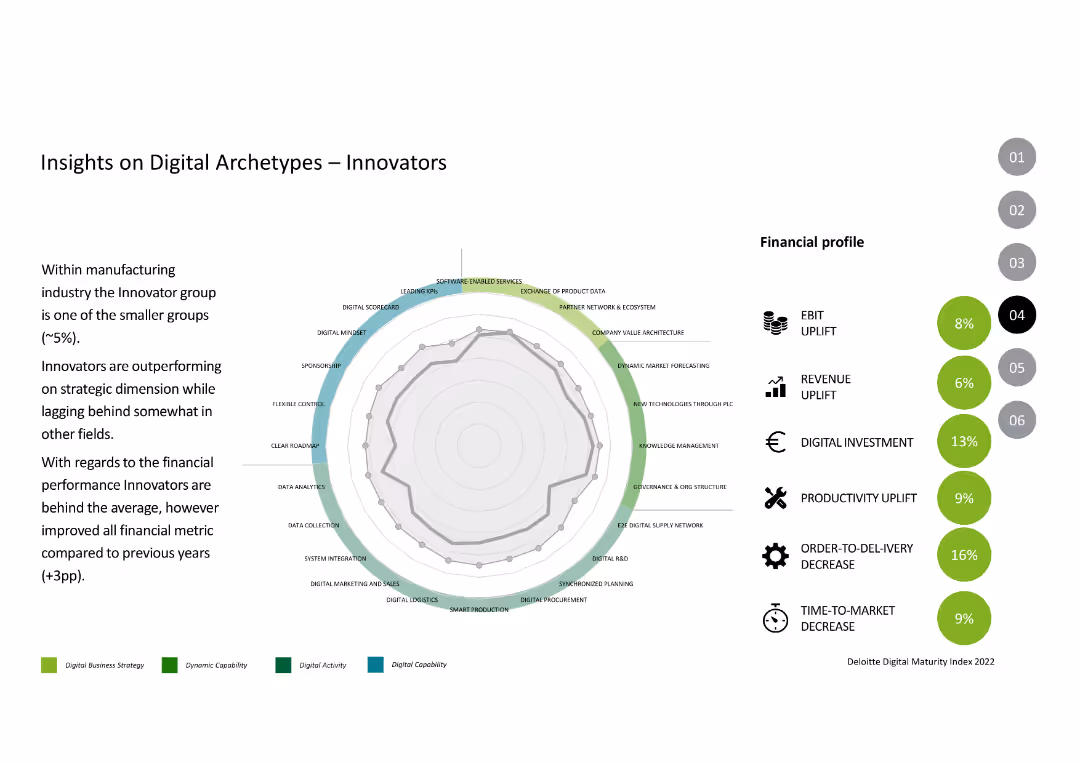
The slide features a radar chart with various parameters like digital mindset and software-enabled services, along with financial metrics such as EBIT and revenue uplift.
Competitive Landscape
Industrial & Manufacturing
This slide describes the "Innovators" archetype, focusing on their strengths in strategic dimensions and improvements in financial performance compared to previous years.
Digital Archetypes, Innovators, Performance, Digital Capabilities, Financial Metrics
Mixed Chart
Deloitte
Saved
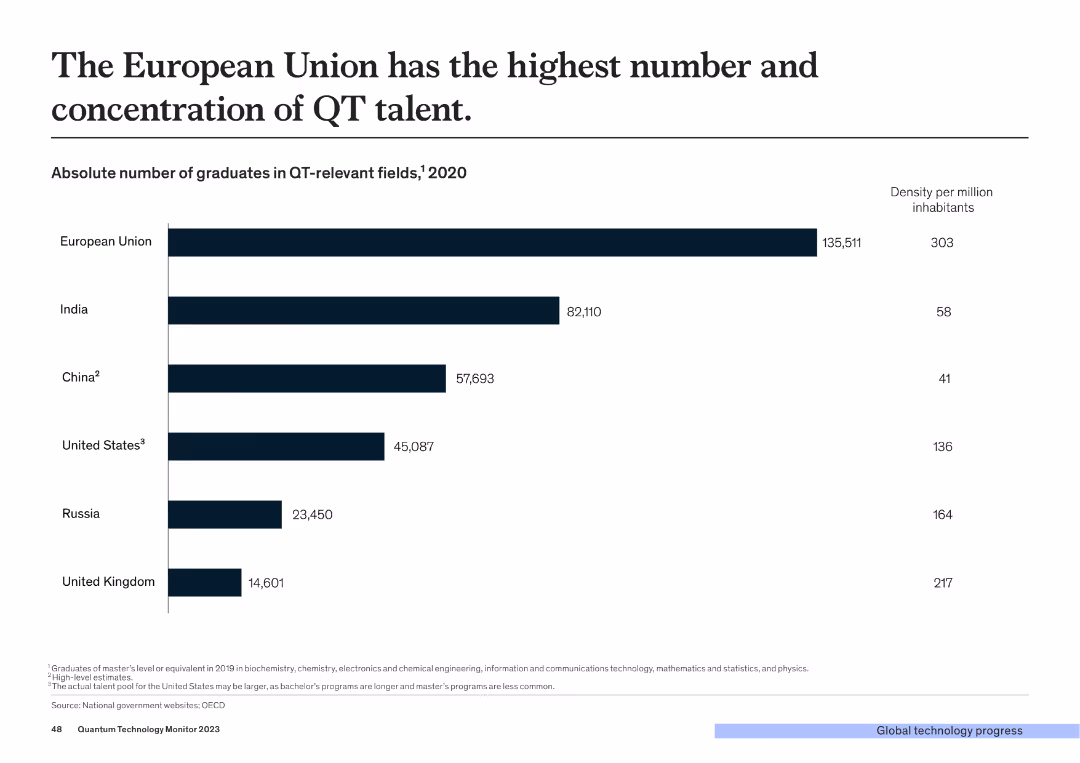
The slide presents a column chart showing the absolute number of graduates in QT-relevant fields by country. The chart lists the EU, India, China, USA, Russia, and the UK.
Market Analysis and Trends
Technology & Software
The slide highlights the European Union as having the highest number and concentration of graduates in quantum technology-relevant fields compared to other countries, emphasizing the region's educational strength in QT.
QT, Talent, Graduates, EU, Education
Single Chart
McKinsey
Saved
This slide includes multiple column charts showcasing percentages of companies accelerating their reinvention in response to external forces like technology innovation and consumer preferences. Additionally, it provides insights into how organizations might react to a recession in various regions.
Strategic Planning
Technology & Software
Detailing the catalysts for organizational reinvention strategies, this slide is likely used to communicate the urgency and factors prompting companies to adapt swiftly to external changes, with emphasis on technology's role in driving future business strategies and operational enhancements.
reinvention, strategy, technology, innovation, recession, global, regional
Multiple Chart
Accenture
Saved
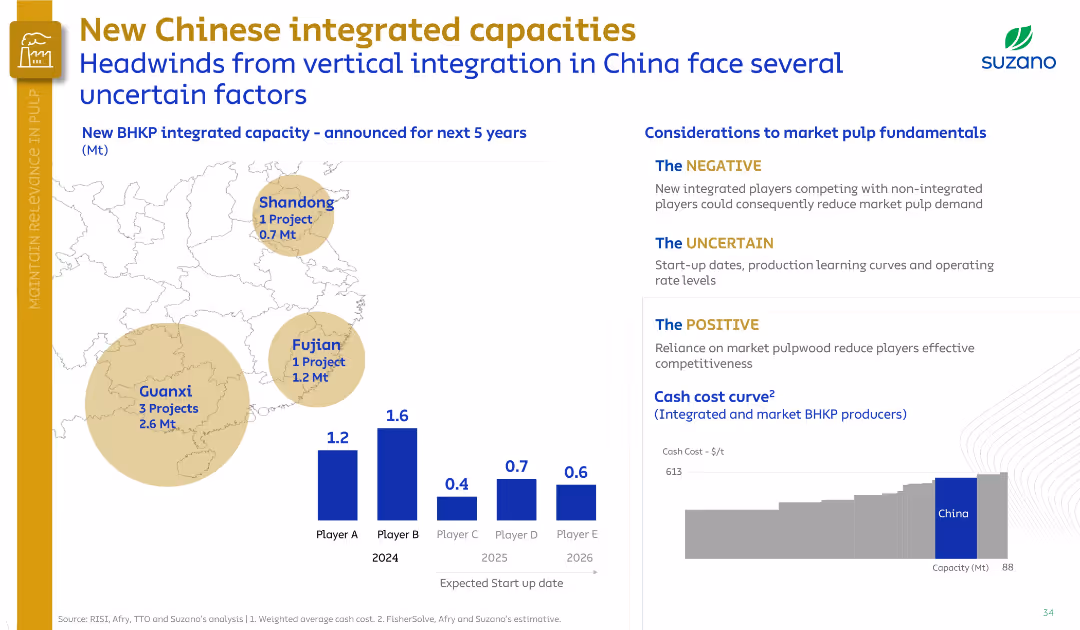
Left map shows project locations; right section outlines market impacts (positive, negative, uncertain). Uses muted tones and a segmented layout.
Competitive Landscape
Industrial & Manufacturing
Highlights new integrated BHKP capacities in China and their potential impact. Identifies risks (competition, uncertainty in execution) and advantages (market pulp reliance). A cost curve shows Chinese producers’ positioning.
China, integrated capacity, BHKP, Suzano, market risk, competitiveness, pulp
Multiple Chart
Goldman Sachs
Saved
Three column charts show underlying sales growth and market winning by year and displays the market distribution.
Strategic Planning
Consumer Goods
Analyzes Unilever's sales performance and market competitiveness over the years with a focus on maintaining growth and addressing challenges in various markets.
Sales Growth, Competitiveness, Market Distribution, Strategic Planning, Unilever
Multiple Chart
Deutsche Bank
Saved
Slide with bullet points and icons, contrasting implications for different stakeholders in the digital ecosystem.
Strategic Planning
Technology & Software
Addresses the roles and adjustments necessary for various players in the digital transformation landscape.
digital, stakeholders, transformation, policy, investors, digital natives
Header Vertical
Bain
Saved
The slide displays a title section and multiple line charts depicting the increase in search volumes for merchant-related queries. The design is clean, with the use of blue shades to represent different countries and time periods, while annotations provide context.
Market Analysis and Trends
Retail & E-commerce
Representing an increase in merchant interest in e-commerce, the slide uses indexed search volume data to show the burgeoning desire to join the digital marketplace across various SEA countries. The comparative analysis underpins the regional e-commerce boom and indicates the digital marketplace's attractive prospects for business owners seeking to expand their reach.
e-commerce, merchant interest, search volumes, digital marketplace, SEA, business expansion
Multiple Chart
Bain
Saved
Previous
Next
If nothing, comes up, please save your slides first
Create a FREE account to continue browsing
Receive Instant Access to 1,000+ slides from companies like McKinsey, Google, and Goldman Sachs
First Name
Last Name
Email
Password
I agree to all
Terms & Privacy Policy
Thank you! Your submission has been received!
Oops! Something went wrong while submitting the form.
Have an account?
Sign in
Column Chart
Heatmap
Chevron
Org Chart
Infographic
Callouts
Timeline
List
Graphic
Picture
Process Flow
Diagram
Paragraph
Map
Table
Framework
Subtitle
Takeaway Box
Icon
Other Chart
Radar Chart
Waterfall Chart
Mekko Chart
Pie Chart
Scatter Plot
Line Chart
Bar chart
Bullet points