My Account
My Slides
Search by Category
Templates
Leave Feedback
Login
Logout
Get Started
Browse all Slides
Browse all Slides
Create a FREE Account
Instant access to 1,000+ real slides from top companies like McKinsey, BCG, Goldman Sachs, Google and many more!
First Name
Last Name
Email
Password
I agree to all
Terms & Privacy Policy
Thank you! Your submission has been received!
Oops! Something went wrong while submitting the form.
Have an account?
Sign in
Saved Slides
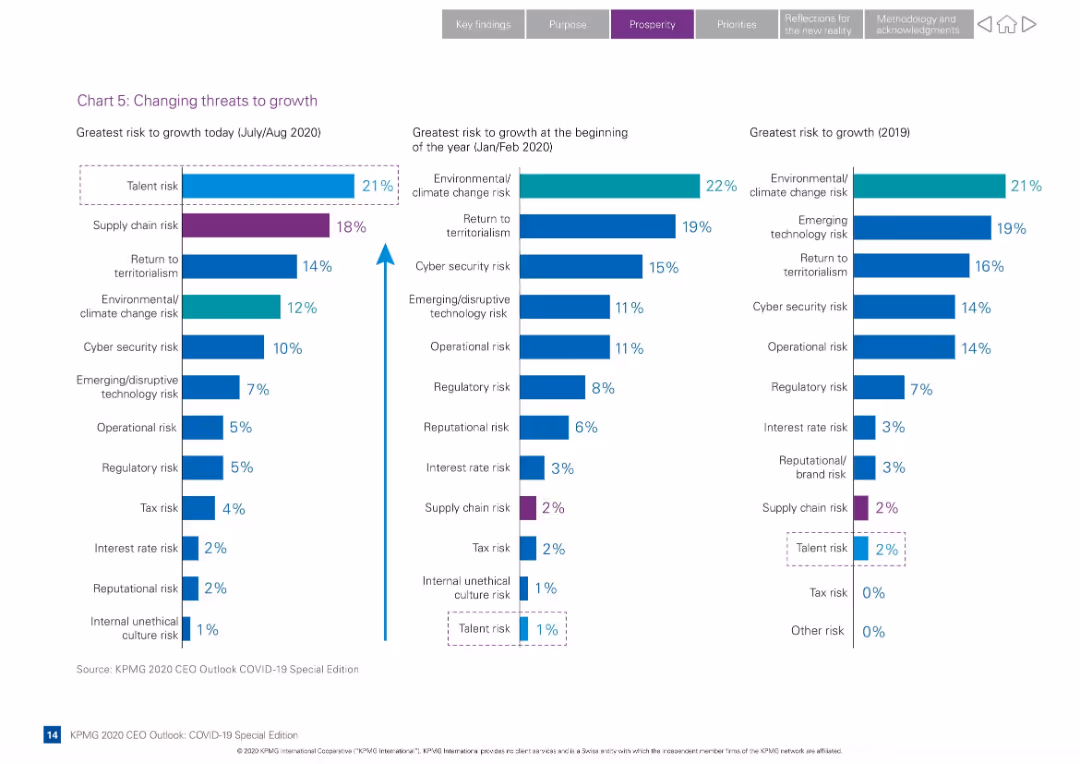
Three-panel bar chart comparing top risks from 2019, early 2020, and mid-2020
Risk Assessment and Management
Professional Services
Displays how CEOs' perception of growth risks shifted due to COVID-19. Talent risk rose to the top in mid-2020, replacing climate change and territorialism from earlier periods.
risk trends, talent risk, COVID-19, supply chain, cybersecurity, environmental risk, bar chart, KPMG Outlook
Single Chart
KPMG
Saved
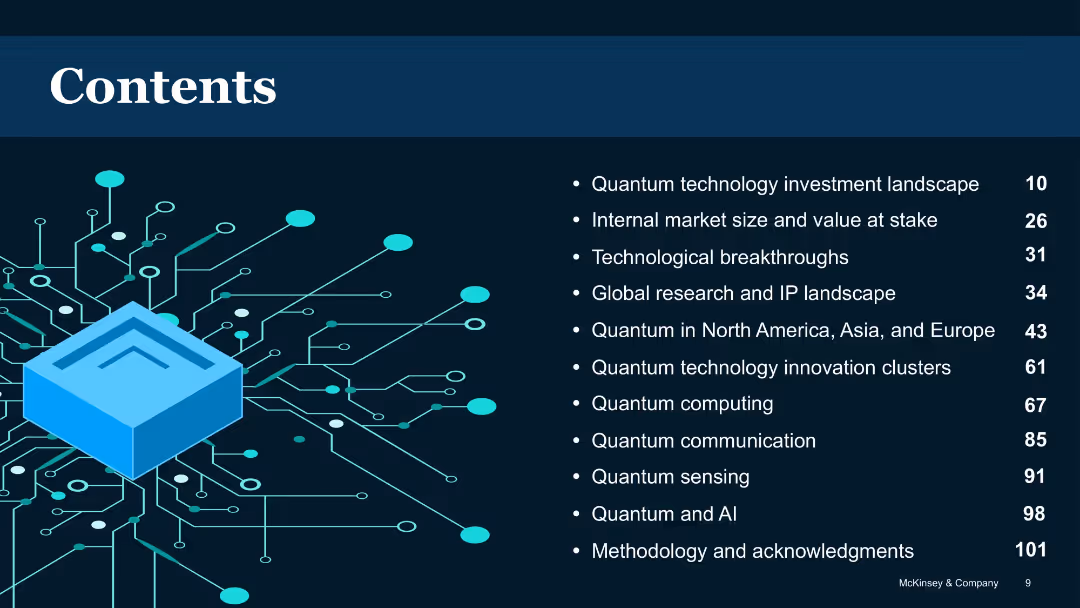
Dark background with blue circuit illustration and list-style table of contents
Industry Overview
Artificial Intelligence
Provides a structured overview of the report’s sections, including topics like investment landscape, technological breakthroughs, global perspectives, and specific quantum technologies like computing, sensing, and communication.
Table of contents, report structure, quantum sections, chapter list
Agenda
McKinsey
Saved
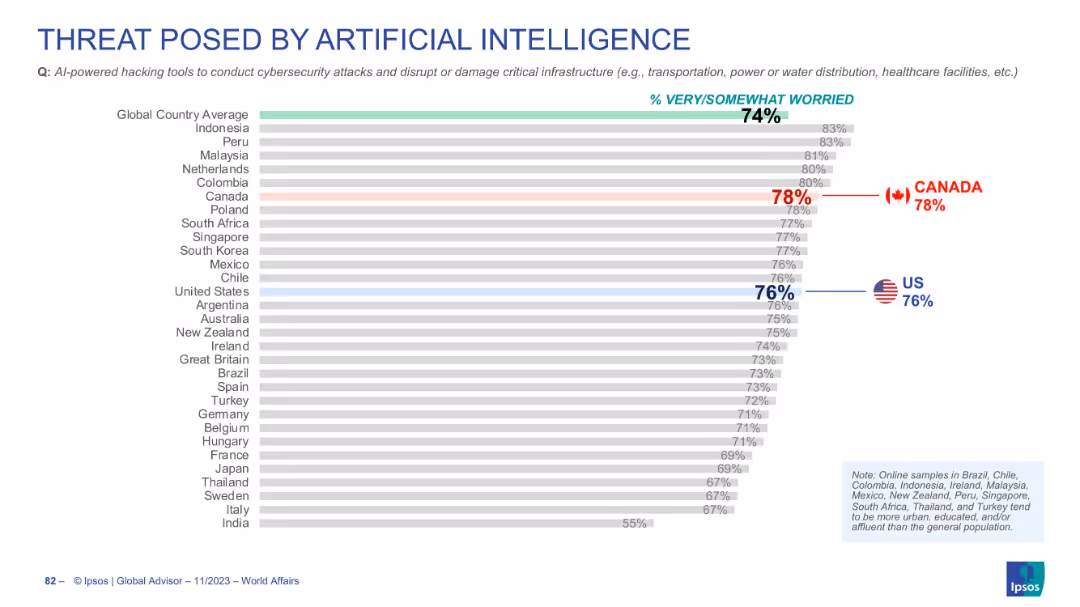
Horizontal bar chart ranking countries' concerns over AI-powered hacking tools
Risk Assessment and Management
Artificial Intelligence
Survey data highlighting global concern (74%) about AI-driven cybersecurity threats. Canada and the US show above-average levels of concern at 78% and 76% respectively.
AI hacking, cybersecurity, critical infrastructure, global survey, public worry
Single Chart
IPSOS
Saved
Column chart with a projected growth annotation, showing the percentage use of AI and machine learning in marketing efforts from the current to future expectations.
Technology and Digital Transformation
Technology & Software
Highlights the current and expected future usage of AI and machine learning in marketing, noting a 166% growth projection.
AI, machine learning, marketing, growth projection, automation
Single Chart
Deloitte
Saved
The slide features a detailed table comparing financial metrics year-over-year. A sidebar with bullet points elaborates on significant changes.
Financial Performance
Industrial & Manufacturing
The slide compares Q1 profitability from the previous year, explaining factors affecting sales, costs, and earnings, like higher freight costs and negative FX development.
Q1 profitability, sales, costs, earnings, freight costs, FX development, LANXESS, financial comparison, year-over-year analysis
Table
Morgan Stanley
Saved
Displays column charts tracking TLTRO outstanding amounts and impacts on financial ratios over time.
Regulatory and Compliance
Financial Services
Forecasts the trajectory of TLTRO repayments and its implications on liquidity and funding ratios in a regulatory context.
TLTRO, finance, forecast, regulation, compliance, liquidity
Single Chart
Deutsche Bank
Saved
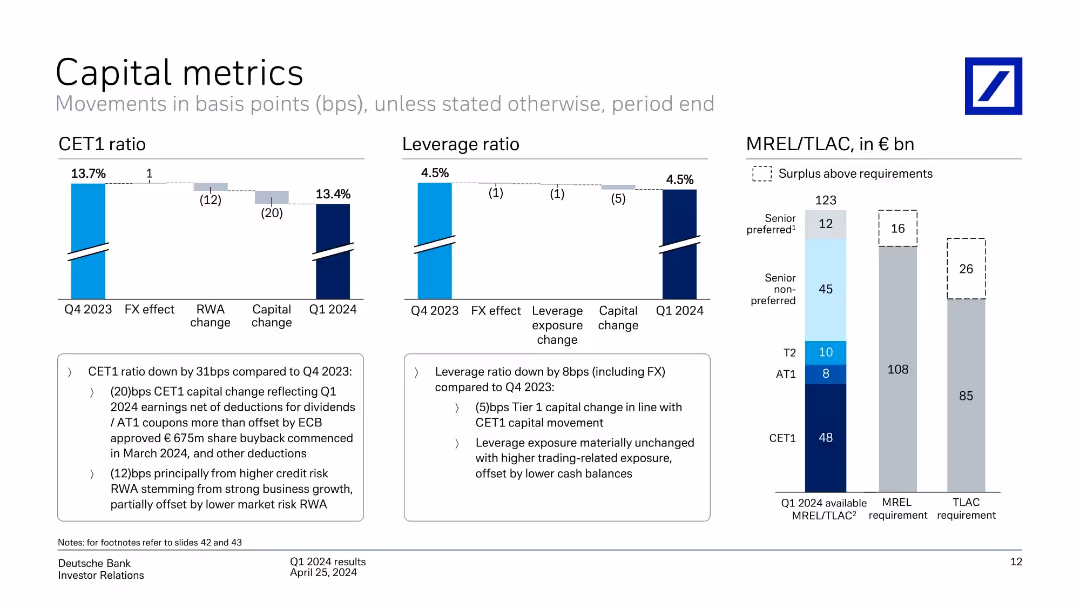
Three-panel layout: CET1 ratio, leverage ratio, and MREL/TLAC bar chart; text box summaries below
Financial Performance
Financial Services
Compares Q1 2024 capital metrics with Q4 2023, highlighting decreases in CET1 and leverage ratios due to capital changes and FX effects. The slide shows MREL/TLAC composition and surplus over regulatory requirements.
CET1, leverage ratio, MREL, TLAC, capital, regulatory surplus, FX effects
Multiple Chart
Deutsche Bank
Saved
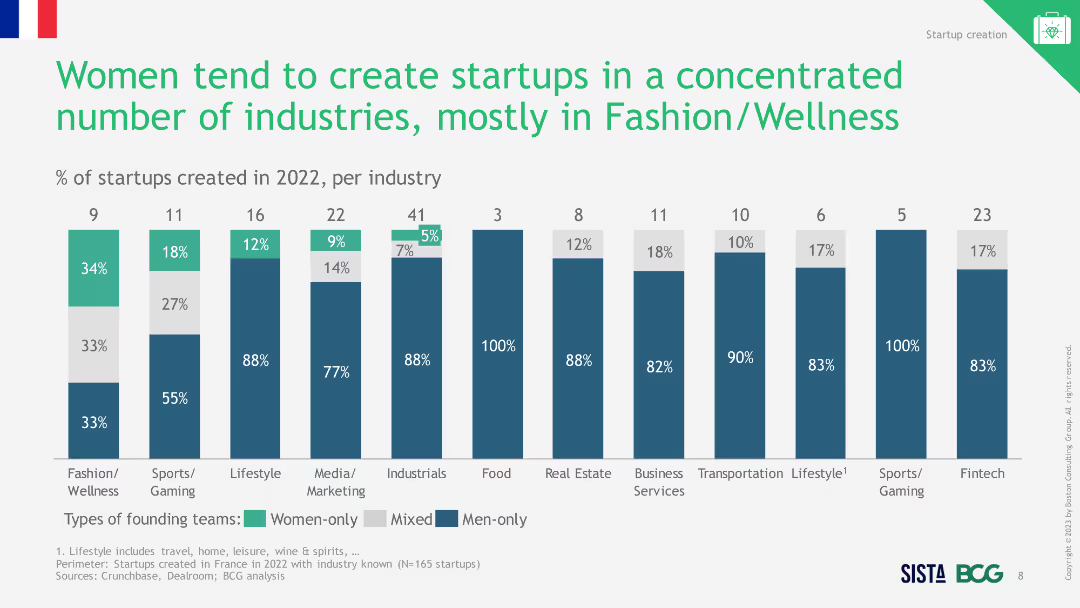
Column chart showing the percentage of total funds raised by different types of founding teams from 2008 to 2022, highlighting the improvement in 2022.
Investment Analysis
Financial Services
The slide shows that despite a market contraction, access to funds for startups with women founders improved in 2022 compared to previous years.
funding, women entrepreneurs, market contraction, 2022
Single Chart
BCG
Saved
This slide illustrates the quarterly growth trends of podcast revenues in the U.S. from 2016 to 2021, with a focus on the rebound from early pandemic impacts.
Market Analysis and Trends
Media & Entertainment
Analyzes the quarterly financial performance of the podcast sector, emphasizing resilience and robust growth despite initial pandemic-related downturns. This slide is valuable for stakeholders interested in media market dynamics and investment opportunities in digital media.
podcast revenue, quarterly growth, COVID-19 impact, financial resilience, media investments
Single Chart
PwC/Strategy&
Saved
The slide features a column chart comparing the market value of crypto investment funds held in 2022 and 2023, with values ranging from less than $1,000 to over $1,000,000. There is also a side-by-side comparison for broader value ranges.
Market Analysis and Trends
Financial Services
This slide shows the distribution of market values of crypto investment funds for 2022 and 2023, indicating trends and changes over the two years. It can be used to analyze market behavior and investment patterns.
Crypto, Investment, Market Value, Trends, Comparison
Mixed Chart
IPSOS
Saved
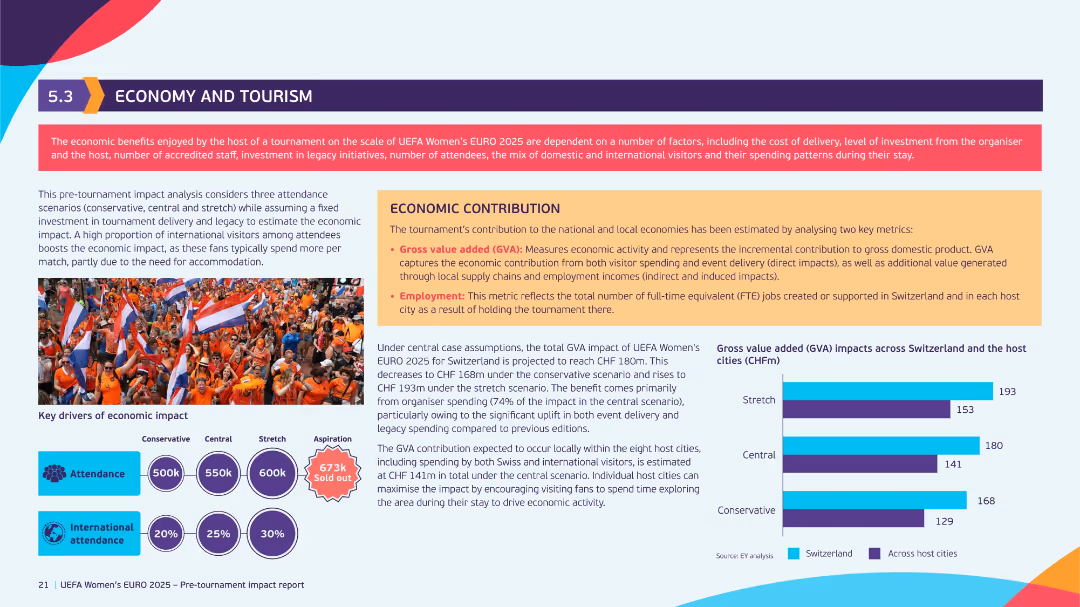
Orange-accented layout with left column on attendance forecasts and right column on economic contribution. Contains bar chart on Gross Value Added (GVA) and colorful infographics.
Investment Analysis
Hospitality & Tourism
This slide assesses the projected economic impact of UEFA Women’s EURO 2025 on Switzerland. It estimates GVA based on three attendance scenarios and outlines benefits including job creation and increased tourist spending. Visuals highlight key economic drivers.
economic impact, tourism, GVA, UEFA, employment, spending patterns, host cities
Mixed Chart
EY
Saved
The slide provides demographic information and wealth distribution across customer life cycles, using column chart and a life cycle curve. It illustrates the number of affluent adults and their corresponding liquid wealth in tranches. The slide is clean, with contrasting colors for different data segments, primarily green and grey. Textual descriptions accompany each visual, providing context. The Quilter logo is visible in the corner.
Customer and Market Segmentation
Financial Services
The slide explores the wealth distribution among UK adults and opportunities for wealth management services throughout the customer lifecycle, suitable for discussions on market segmentation and service offering development.
Customer Lifecycle, Wealth Management, Demographic Analysis, Market Segmentation, Asset Bands, Financial Services, Quilter, Customer Wealth
Mixed Chart
Morgan Stanley
Saved
This slide presents a line chart showing the market performance of publicly listed companies in discrete automation over the last five years, categorized by segments like machine vision & sensors, drives/motion control, robotics, system integrators, and machine builders. It also includes logos of notable companies in each segment.
Market Analysis and Trends
Industrial & Manufacturing
The slide analyzes the market performance of companies in discrete automation, comparing segments like machine vision, drives, robotics, system integrators, and machine builders, with a focus on EV/EBITDA ratios.
Market Performance, Discrete Automation, Public Companies, Machine Vision, Robotics, System Integrators, Machine Builders, EV/EBITDA
Mixed Chart
LEK
Saved
Slide includes a column chart and a circular diagram detailing global and country-specific data on internally displaced people due to conflict or disasters, supplemented with textual analysis and icons.
Market Analysis and Trends
Government & Public Sector
This slide discusses trends in internal displacement driven by conflict and disasters, providing data to understand regional and global scales of the issue and to support humanitarian and policy responses.
displacement, conflict, disaster, data, global, regional, humanitarian, policy, statistics
Multiple Chart
Roland Berger
Saved
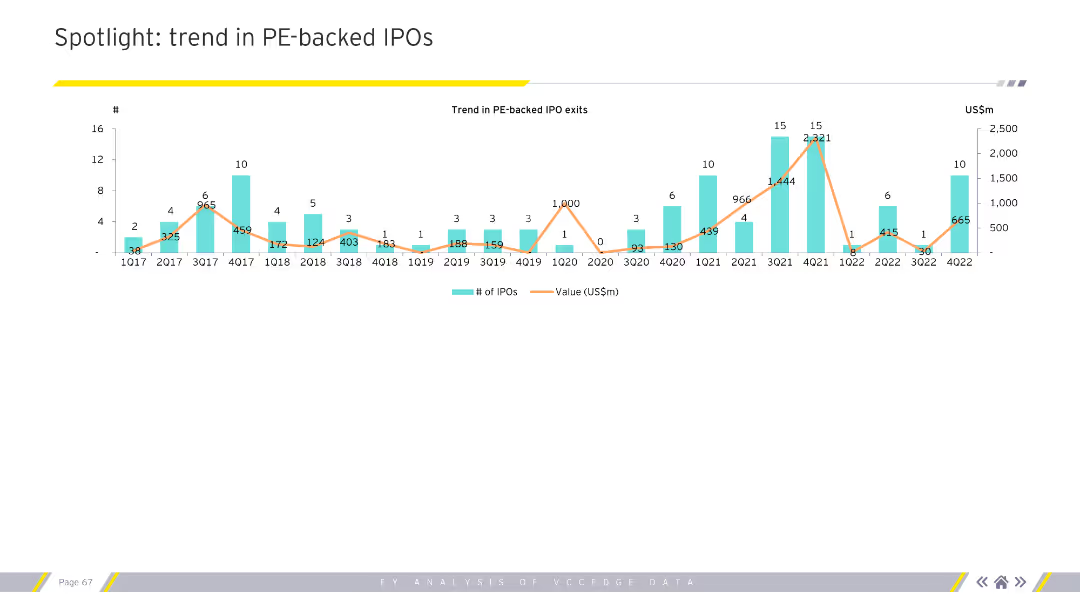
The slide includes a column chart showing the trend in PE-backed IPO exits over multiple quarters.
Market Analysis and Trends
Financial Services
This slide provides an analysis of trends in PE-backed IPO exits, focusing on the number of IPOs and their value over time.
PE, IPO, exits, trends, quarterly, value, number of IPOs
Single Chart
EY
Saved
The slide displays a column chart showing the progression of IT spend over four years, split into categories such as 'Core Infrastructure & Modernization', 'Risk and Information Security', and 'Business-Driven'. Adjacent to the chart is a list of bullet points elaborating on each category.
Financial Performance
Financial Services
Communicates Northern Trust's IT budget allocation, with an emphasis on foundational and business-driven applications. It provides financial insights into how resources are being distributed for client experience, risk management, and core infrastructure, intending to inform stakeholders of investment focuses and priorities.
Technology Spend, Infrastructure, Security, Business-Driven, CAGR
Mixed Chart
Morgan Stanley
Saved
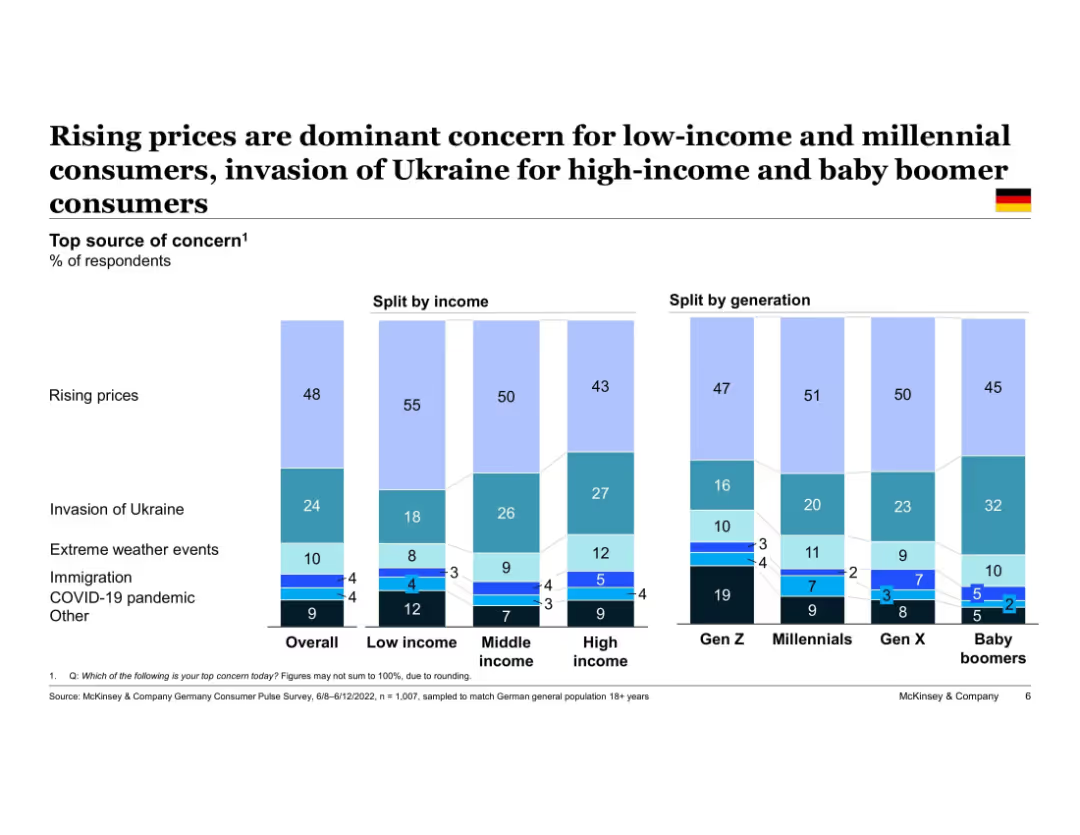
Dual split-bar charts dividing data by income and generation. Pastel color palette with a clean white background and national flag indicator.
Customer and Market Segmentation
Consumer Goods
This slide analyzes top concerns among German consumers segmented by income and age group. Rising prices concern all segments but more so low-income and younger people. Older and high-income individuals are more worried about geopolitical issues.
income segmentation, generational concerns, inflation, Ukraine war, consumer insights, Germany, behavioral analysis
Single Chart
McKinsey
Saved
The slide shows a clean layout with four horizontal line charts comparing different service delivery models across various organizational maturity stages. Each line represents a different model like Onshore SSC, Offshore/Near-shore SSC, Outsourcing, and Center of Excellence. The x-axis represents time intervals while the y-axis shows percentage adoption.
Strategic Planning
Professional Services
Analyzes trends in service delivery preferences among GBS organizations as they mature, showing shifts from onshore to offshore and the consistent use of centers of excellence.
service delivery, GBS, organizational maturity, outsourcing, center of excellence
Mixed Chart
Deloitte
Saved
The slide features an organizational chart with portraits and names of key management team members, alongside a text summary of management strategies.
Organizational Structure and Change
Professional Services
Overview of the joint management structure following a merger, highlighting leadership roles and strategic integration efforts.
management, organizational structure, leadership, merger, strategic planning, team integration
Diagram
Barclays
Saved
Includes logos of key companies and text descriptions, organized neatly to facilitate comparison and provide a clear overview of corporate actions in sustainability.
Market Analysis and Trends
Environmental Services & Sustainability
Discusses the efforts of major corporations in SEA to advance decarbonization through investments in EVs and renewable energies, emphasizing regional impacts and future trends.
Corporates, decarbonization, SEA, EVs, renewable energies
Header Vertical
Bain
Saved
The slide includes a pie chart showing the percentage of Americans who have used virtual care and a grid chart on satisfaction with virtual care.
Technology and Digital Transformation
Healthcare & Pharmaceuticals
This slide discusses the adoption of telehealth, with 51% of Americans having used virtual care and 89% of those users being satisfied. It emphasizes the potential of telehealth to improve patient wellness.
Telehealth, virtual care, patient satisfaction, digital health, wellness
Mixed Chart
IPSOS
Saved
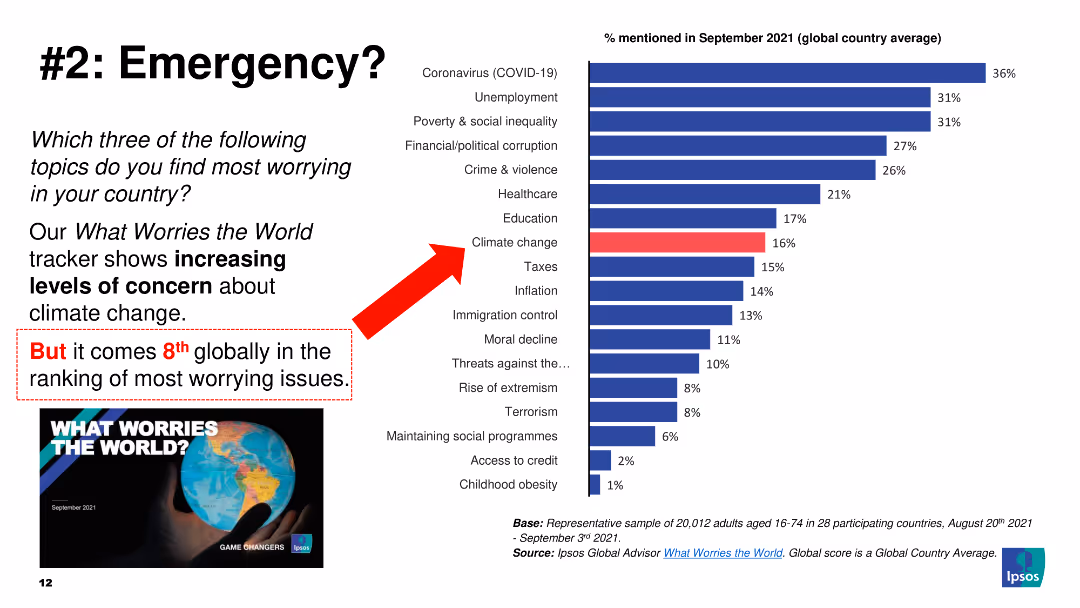
Column chart showing percentages of mentioned issues. Highlight on climate change with a red bar.
Market Analysis and Trends
Environmental Services & Sustainability
The slide shows global concerns with climate change ranked 8th. It emphasizes increasing concern.
climate change, concerns, global, ranking, issues
Mixed Chart
IPSOS
Saved
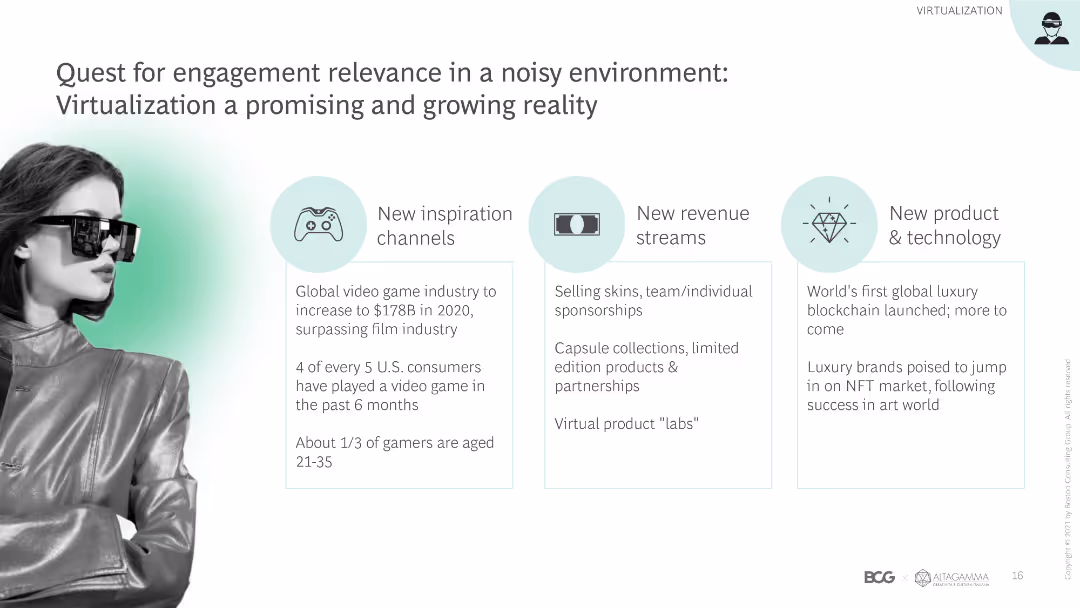
This slide has a content layout with sections on new inspiration channels, revenue streams, and products & technology, featuring relevant icons and brief text descriptions.
Technology and Digital Transformation
Retail & E-commerce
The slide explores the importance of engagement relevance through virtualization, highlighting new channels, revenue streams, and technological advancements in the luxury market.
Engagement relevance, virtualization, new channels, revenue streams, technology, luxury market, digital transformation, innovation, market trends
Pillar
BCG
Saved
Column charts show the development of the Tier 1 leverage ratio and changes in leverage exposure from 3Q22 to 4Q22.
Financial Performance
Financial Services
Describes the improvement in the Tier 1 leverage ratio due to capital raises and deleveraging, indicating strengthened financial leverage.
Tier 1 leverage, financial leverage, capital raises, deleveraging, banking metrics
Multiple Chart
Credit Suisse
Saved
A single column chart shows the resilient growth of Malaysia's internet economy GMV from 2015 to projected 2025.
Market Analysis and Trends
Technology & Software
Shows Malaysia's internet economy's resilient growth, reaching US $11B with future projections and growth rate.
Internet economy, Malaysia, GMV, Resilience, Growth, Projections, 2015, 2025
Single Chart
Bain
Saved
Previous
Next
If nothing, comes up, please save your slides first
Create a FREE account to continue browsing
Receive Instant Access to 1,000+ slides from companies like McKinsey, Google, and Goldman Sachs
First Name
Last Name
Email
Password
I agree to all
Terms & Privacy Policy
Thank you! Your submission has been received!
Oops! Something went wrong while submitting the form.
Have an account?
Sign in
Column Chart
Heatmap
Chevron
Org Chart
Infographic
Callouts
Timeline
List
Graphic
Picture
Process Flow
Diagram
Paragraph
Map
Table
Framework
Subtitle
Takeaway Box
Icon
Other Chart
Radar Chart
Waterfall Chart
Mekko Chart
Pie Chart
Scatter Plot
Line Chart
Bar chart
Bullet points