My Account
My Slides
Search by Category
Templates
Leave Feedback
Login
Logout
Get Started
Browse all Slides
Browse all Slides
Create a FREE Account
Instant access to 1,000+ real slides from top companies like McKinsey, BCG, Goldman Sachs, Google and many more!
First Name
Last Name
Email
Password
I agree to all
Terms & Privacy Policy
Thank you! Your submission has been received!
Oops! Something went wrong while submitting the form.
Have an account?
Sign in
Saved Slides
Features two column charts. The first chart depicts SACU receipts over four fiscal years. The second shows indirect tax comparisons excluding SACU receipts for three fiscal years.
Financial Performance
Government & Public Sector
Analyzing SACU receipts and indirect tax contributions in Namibia, this slide aids in understanding the impact of regional agreements and indirect taxes on the national budget.
SACU, indirect tax, Namibia, fiscal year, regional agreements, national budget, tax contributions
Multiple Chart
PwC/Strategy&
Saved
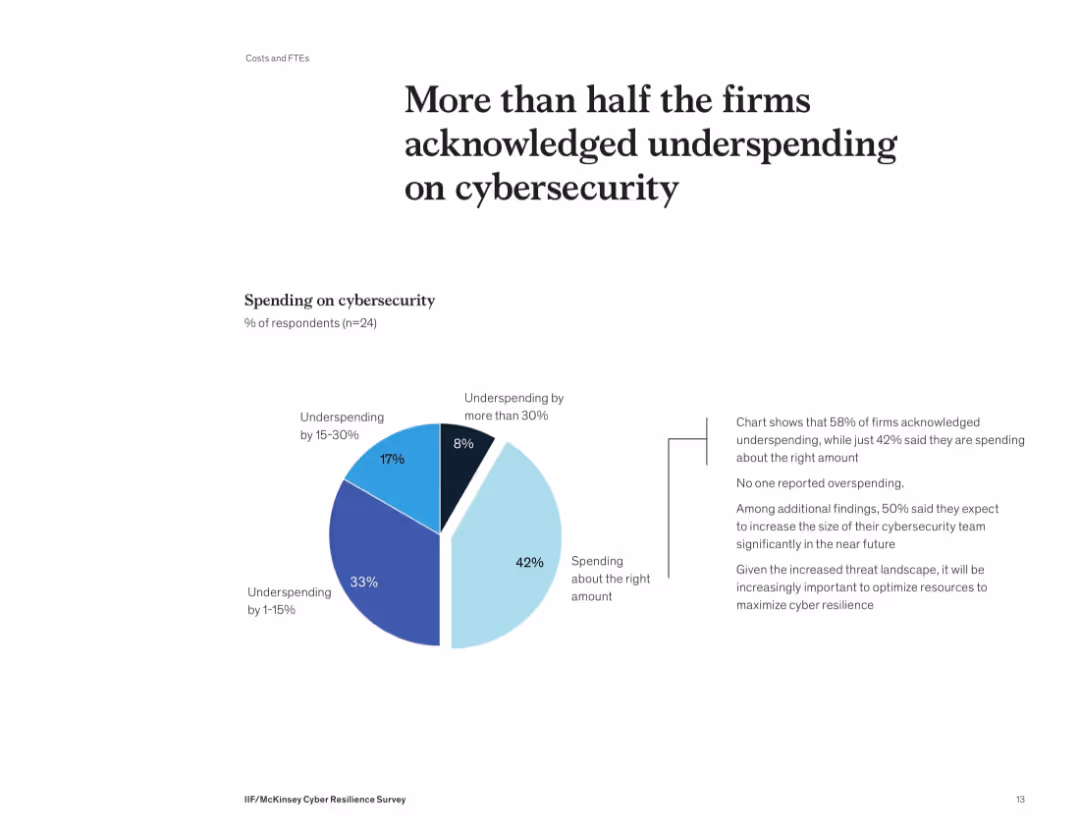
Donut-style pie chart showing distribution of cybersecurity spending levels. Supporting text on the right details implications of underinvestment.
Risk Assessment and Management
Financial Services
58% of firms admit they’re underspending on cybersecurity, with no firm reporting overspending. Many plan to grow their cybersecurity teams. The slide underscores the need to optimize security investments to align with growing threats and reduce risk exposure.
cybersecurity, budget, spending, underinvestment, risk, survey, financial firms
Mixed Chart
McKinsey
Saved
The slide presents a bar chart listing various sources from which parents sought help for children's social and emotional development, such as the NHS website and family.
Market Analysis and Trends
Education & Training
It highlights that parents relied on a variety of sources for support in their children's social and emotional development, with the NHS website being the most common source.
Children's development, social, emotional, sources, bar chart, public opinion, Ipsos, education, support
Single Chart
IPSOS
Saved
This slide displays a stacked column chart with annotations for half-yearly data points from 2019 to H1 2023. It uses grayscale for different sectors with a clear legend. Deal count numbers are presented at the bottom.
Investment Analysis
Financial Services
Shows private funding trends in Vietnam for different sectors, indicating a small increase in H1 2023. It suggests a focus on nascent sectors, hinting at emerging investment areas.
Vietnam, Private Funding, H1 2023, Investment Trends, Nascent Sectors, Deal Count, Travel, Digital Media, E-commerce
Single Chart
Bain
Saved
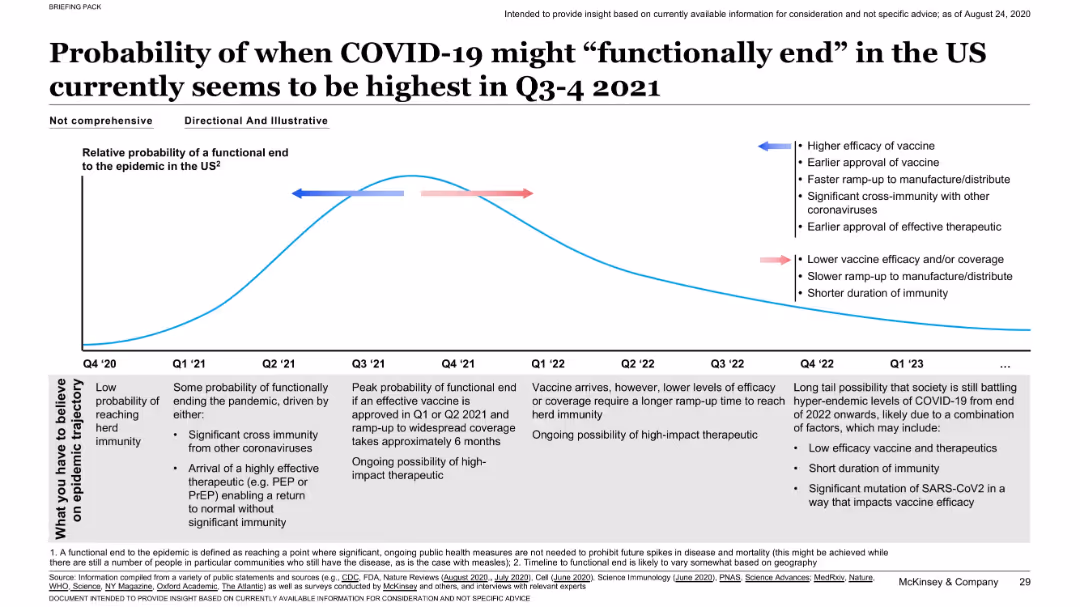
Line chart with a curve representing relative probability over time; annotated with influencing factors; timeline spans Q4 2020 to Q1 2023.
Strategic Planning
Healthcare & Pharmaceuticals
Estimates peak probability for functional end of the pandemic in Q3–Q4 2021, influenced by vaccine efficacy, speed of distribution, and therapeutic developments. Scenarios for faster or slower progress are annotated.
COVID-19, pandemic end, vaccine, immunity, timeline, probability
Mixed Chart
McKinsey
Saved
A pie chart detailing the line of business revenue and a column chart displaying volatility. The layout is clean, with a focus on visual data representation in purple tones.
Risk Assessment and Management
Financial Services
Illustrates financial diversification and stability, suitable for discussions on risk management and financial planning, highlighting the benefits of a diverse business model in mitigating market volatility.
business mix, financial stability, risk management, volatility, diversification
Multiple Chart
Goldman Sachs
Saved
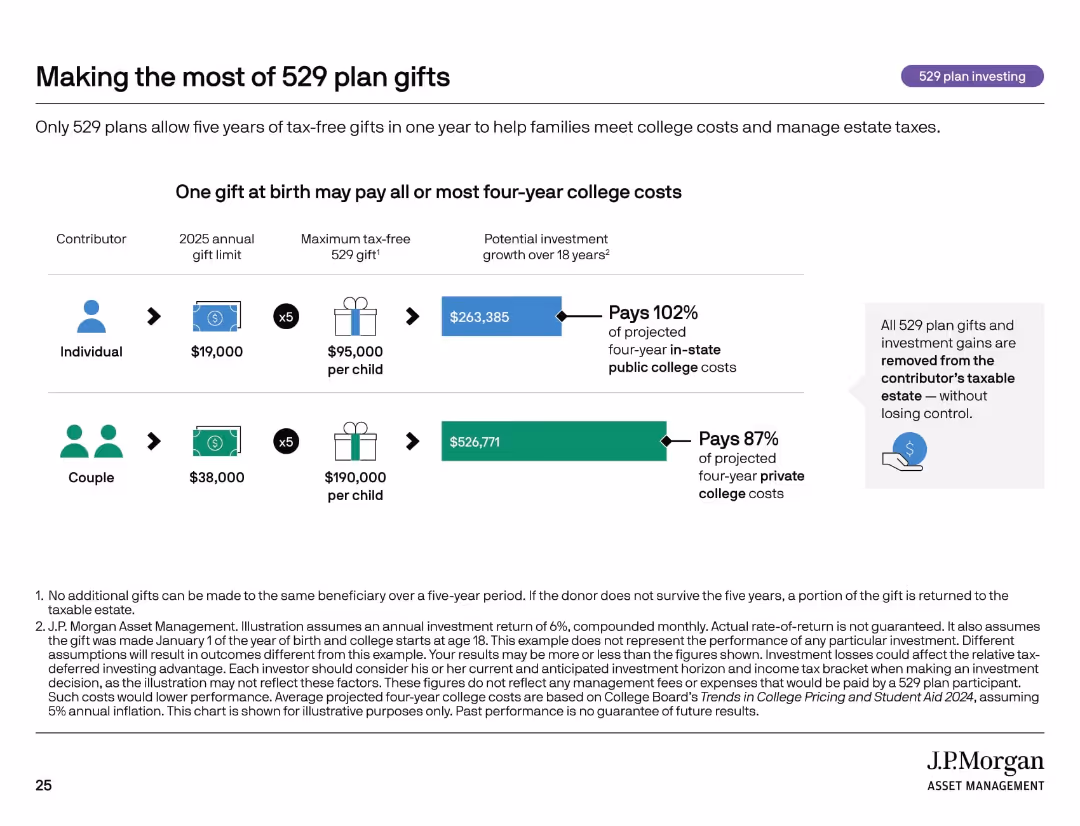
Icon row, side-by-side comparisons of individual vs. couple contributions with gift limits and investment projections.
Investment Analysis
Financial Services
This slide shows how front-loading 529 plan gifts can significantly fund future college expenses while reducing estate taxes. It compares the financial impact of individual vs. couple contributions and demonstrates how a lump sum at birth can cover nearly all four-year public college costs.
estate planning, 529 gifting, college savings, compound growth, tax-free
Mixed Chart
JP Morgan
Saved
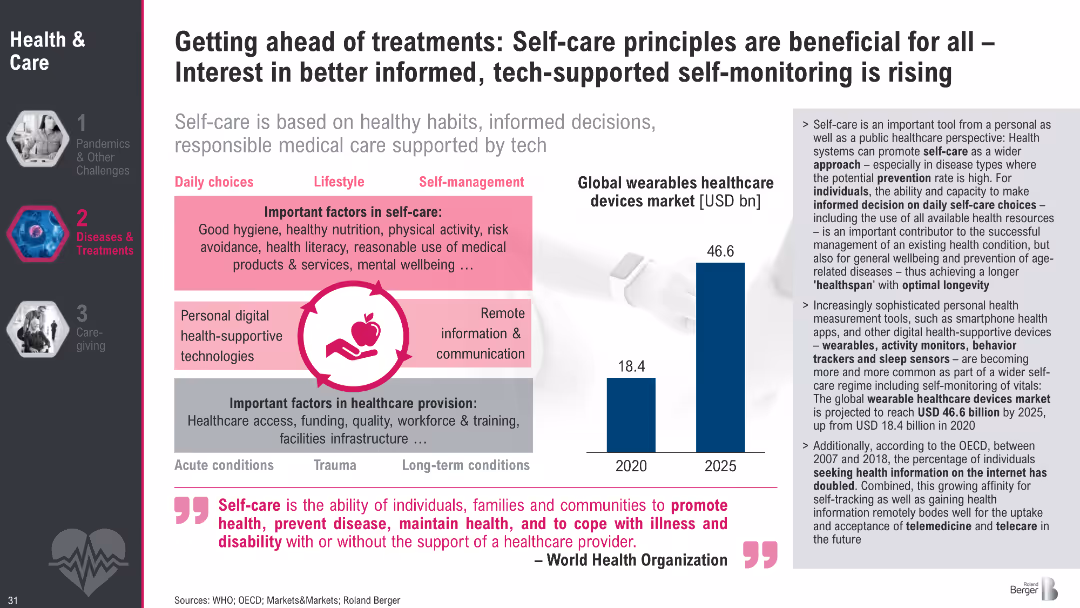
Dual-panel layout showing self-care factors and wearable device market growth; iconography and charts used
Technology and Digital Transformation
Healthcare & Pharmaceuticals
The slide advocates self-care as a strategy to prevent and manage diseases, supported by digital tools like wearables. It notes a growing market for health tech and increasing consumer responsibility in health decisions.
self-care, health tech, wearables, prevention, WHO, lifestyle, market trends, health monitoring, telehealth
Mixed Chart
Roland Berger
Saved
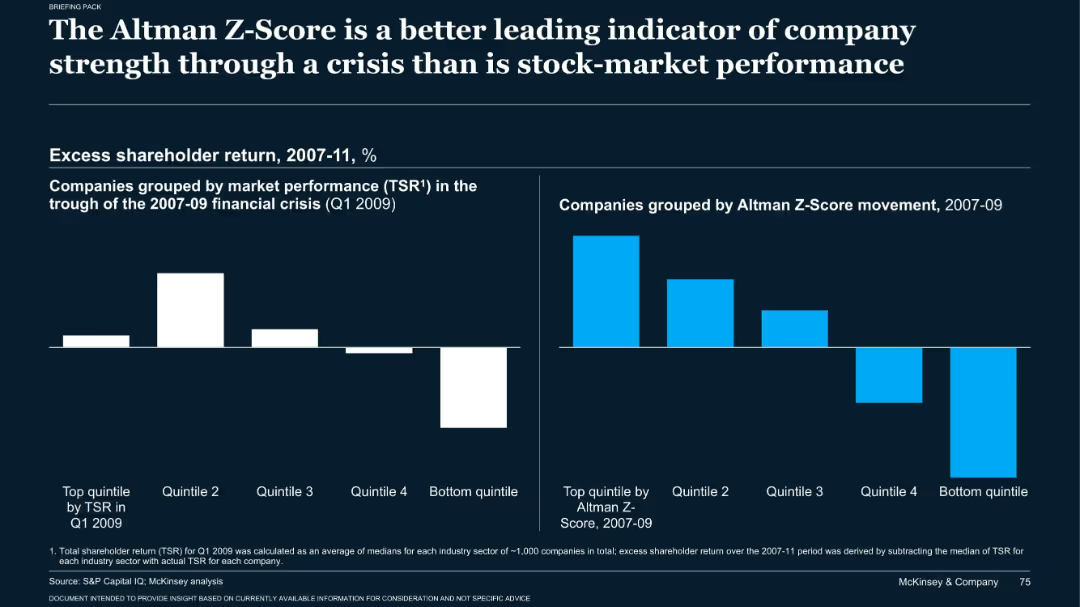
Dark-themed bar charts comparing excess returns based on TSR and Z-Score during 2007–2009
Risk Assessment and Management
Financial Services
The slide emphasizes that Altman Z-Scores were more predictive of company strength during the 2008 crisis than stock performance. Two bar charts show how companies in top Z-score quintiles outperformed in shareholder return from 2007 to 2011.
Altman Z-score, TSR, recession, risk analysis, company strength
Single Chart
McKinsey
Saved
A small bar chart and large pie charts showing frequency of senior marketing leaders' participation in board meetings and earnings call preparations, rated from 1 to 7. Includes percentage of companies above average participation.
Customer and Market Segmentation
Professional Services
Evaluates the involvement of senior marketing leaders in high-level corporate activities, distinguishing between their roles in board meetings versus earnings calls and noting a higher engagement in the former.
Marketing, Leadership, C-Suite, Graph, Board Meetings, Earnings Calls, Participation Frequency
Multiple Chart
Deloitte
Saved
The slide presents a balanced combination of text, icons, and a Venn diagram. The icons represent different business areas, while the diagram depicts the intersection of energy policies and current events.
Industry Overview
Energy & Utilities
This slide offers an overview of Seatruim's strategic focus on offshore renewables, new energy, and cleaner solutions, utilizing a Venn diagram to illustrate market positions and energy policy impacts. It could be used to outline the company's market strategy in the energy sector.
Energy, Renewables, Transition, Strategy, Market, Offshore
Pillar
Morgan Stanley
Saved
Features three distinct icons representing urban dynamics, mobility evolution, and customer preferences, each accompanied by a brief descriptor, arranged horizontally across the slide.
Strategic Planning
Transportation & Logistics
Discusses the major forces shaping future transportation ridership including urban dynamics, mobility options, and shifting customer expectations. Ideal for strategic planning in urban transport and mobility sectors.
urban dynamics, mobility, customer preferences, transportation, future trends
Pillar
BCG
Saved
This slide displays a bar chart with the major limiting factors to providing antenatal care in primary healthcare centers, such as poor power supply and equipment issues. Each factor is distinctly colored for emphasis.
Risk Assessment and Management
Healthcare & Pharmaceuticals
Identifies critical barriers to healthcare service provision in primary centers, focusing on power supply issues, which is crucial for risk management and service improvement in healthcare.
healthcare barriers, power supply, risk management, PHC limitations, service improvement
Single Chart
BCG
Saved
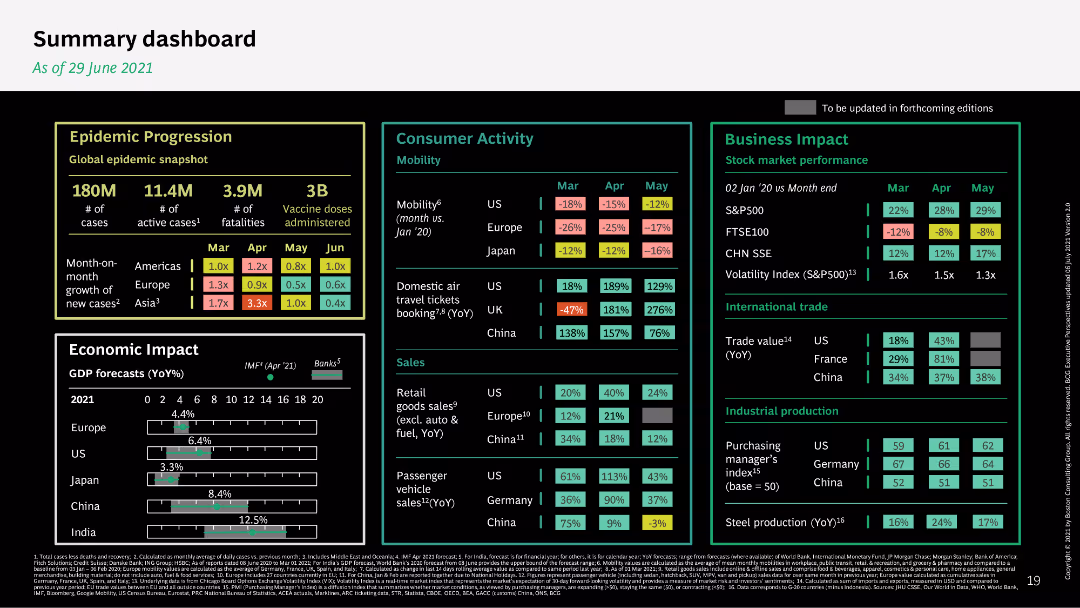
The slide features a comprehensive dashboard with metrics on epidemic progression, consumer activity, and business impact. It uses a dark background with colorful data points for clarity.
Performance Metrics and KPIs
Healthcare & Pharmaceuticals
The summary dashboard provides an overview of various metrics, including epidemic progression, economic impact, consumer activity, and business performance as of June 2021.
dashboard, metrics, epidemic, economic impact, business performance
Mixed Chart
BCG
Saved
A detailed diagram illustrating the process of whitelisting wallets for tokenized assets, including steps like KYC/AML checks, engagement with regulators, and the role of tokenization providers, custodians, and exchanges.
Regulatory and Compliance
Financial Services
Describes an interim solution for enhancing secondary market liquidity by whitelisting wallets, detailing the process and regulatory compliance required to ensure secure and efficient trading of tokenized assets.
whitelisting, wallets, tokenization, KYC/AML, secondary market
Diagram
EY
Saved
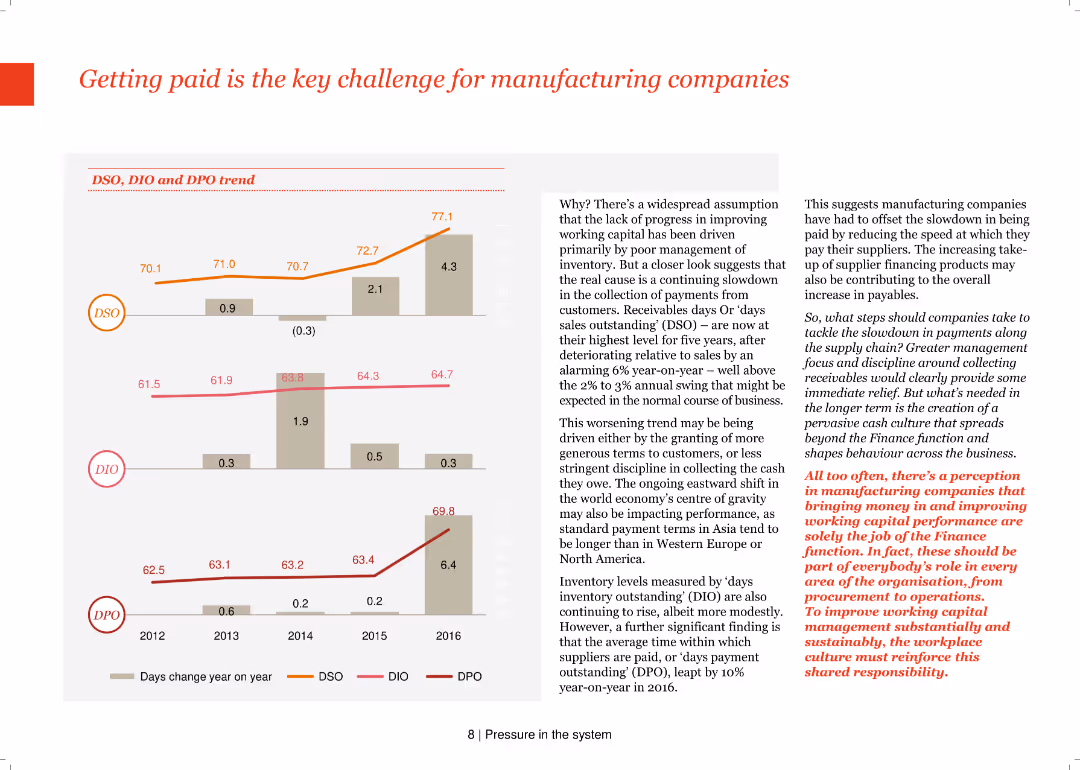
The slide features a column chart with DSO, DIO, and DPO trends from 2012-2016. Text explains the challenges in improving working capital due to slow customer payments and high receivables.
Risk Assessment and Management
Industrial & Manufacturing
It examines the key challenge of getting paid in the manufacturing sector, focusing on the trends in days sales outstanding (DSO), days inventory outstanding (DIO), and days payable outstanding (DPO), and their impact on working capital.
DSO, DIO, DPO, working capital, manufacturing, risk management, column chart, payment challenges, receivables
Multiple Chart
PwC/Strategy&
Saved
The slide has a color-coded, segmented arrow graphic that illustrates various contributions of the Tempest program. The design is professional, using a mix of red, black, and white color scheme with clear, bold fonts and highlighted numerical data. The layout is moderately dense with text and graphical elements.
Industry Overview
Government & Public Sector
This slide provides an overview of the Tempest programme’s economic impact, job creation, and regional contribution from 2021 to 2050. It is used to demonstrate the significance of a government defense project in terms of economic and employment benefits.
Tempest programme, GDP contribution, employment, economic impact, long-term value, productivity, regional benefits
Diagram
PwC/Strategy&
Saved
The slide presents column charts comparing brand consideration (premium vs. volume) in vehicle purchases before and during COVID-19 across multiple countries (US, UK, Germany, France, Italy, China, Japan).
Market Analysis and Trends
Transportation & Logistics
Details shifts in consumer brand consideration for vehicles during the pandemic, highlighting how preferences have changed over time and across different regions.
brand consideration, vehicle purchases, COVID-19, column chart, international
Multiple Chart
McKinsey
Saved
Contains a waterfall chart illustrating short and medium-term cost reduction potential across various expense categories.
Operational Efficiency
Industrial & Manufacturing
Demonstrates the potential for cost reduction without significantly impacting output, detailing short-term and medium-term savings across different expenses.
cost reduction, potential, expenses, short-term, medium-term, savings, waterfall chart
Single Chart
EY
Saved
The slide includes column charts illustrating investment in business divisions over time with projected future growth.
Strategic Planning
Financial Services
Discusses the strategic investment across various business divisions aiming to drive future financial returns and operational efficiency.
investments, strategy, growth, divisions, returns
Mixed Chart
Barclays
Saved
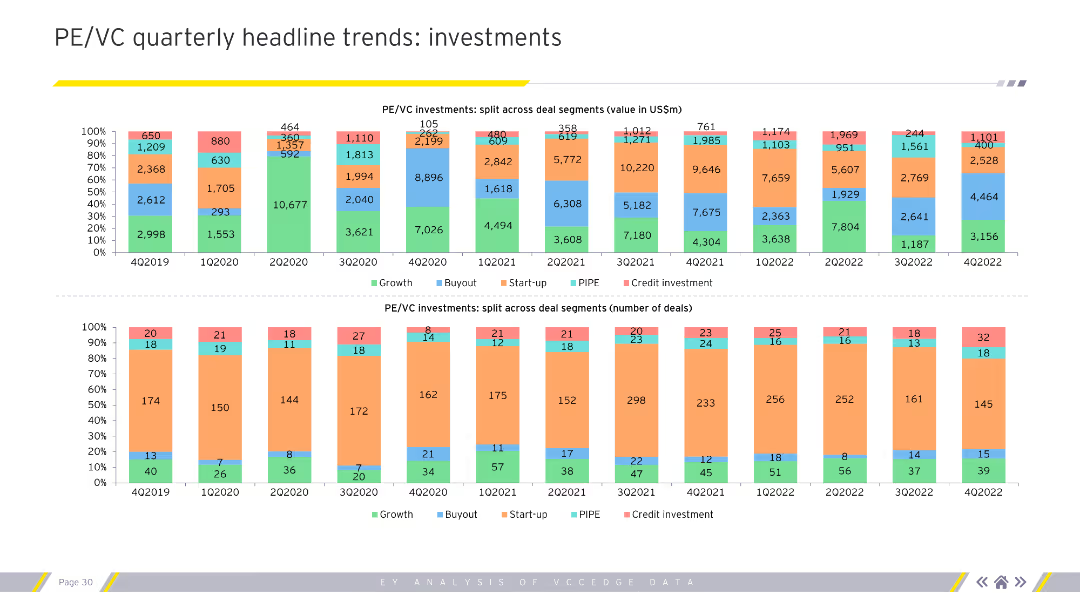
The slide contains two stacked bar charts. The top chart shows PE/VC investments split across deal segments by value, while the bottom chart shows the split by number of deals.
Market Analysis and Trends
Financial Services
This slide provides a detailed view of PE/VC investments, comparing the value and number of deals across different segments, which helps in understanding investment distribution.
Investment segments, deal value, deal count, PE/VC
Multiple Chart
EY
Saved
Line graphs showing search trends for video streaming services, by country, with annotations indicating multipliers compared to baseline levels.
Market Analysis and Trends
Technology & Software
Highlights the growing consumer interest in video streaming services across different countries. Essential for media companies to track changes in market interest and strategize for content delivery and platform engagement.
Video streaming, Search trends, Consumer interest, Market analysis, Technology
Multiple Chart
Bain
Saved
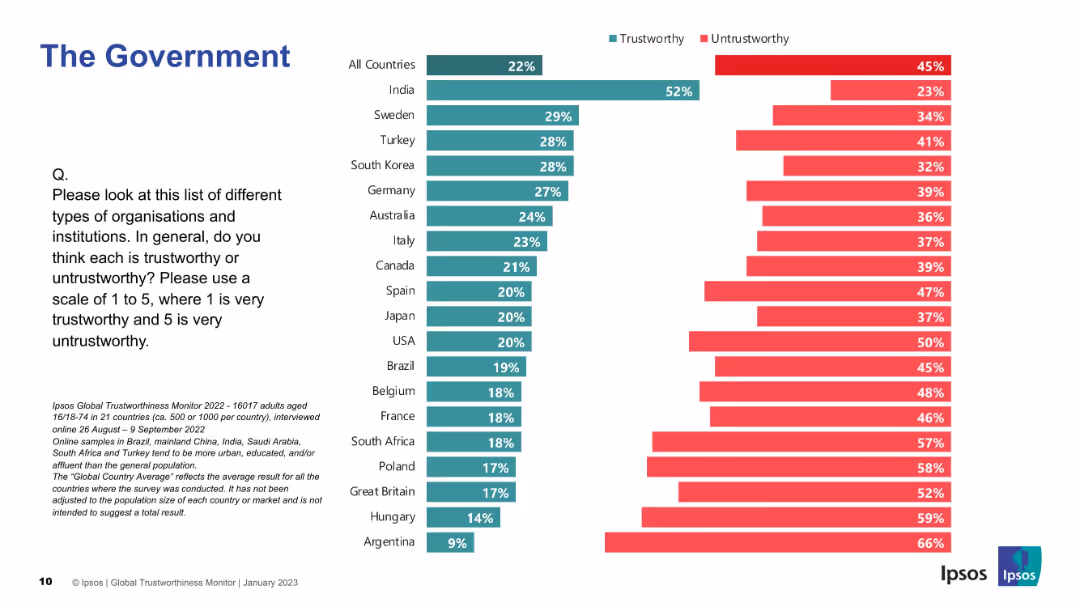
Bar chart comparing trust vs distrust in government by country; left-aligned question, bars on right.
Regulatory and Compliance
Government & Public Sector
This slide illustrates international perceptions of government trustworthiness. India is the most trusting, while Argentina is the least. The global average shows more distrust than trust toward government institutions.
government trust, public sector, country comparison, distrust, perception, Ipsos, regulatory confidence, global view
Mixed Chart
IPSOS
Saved
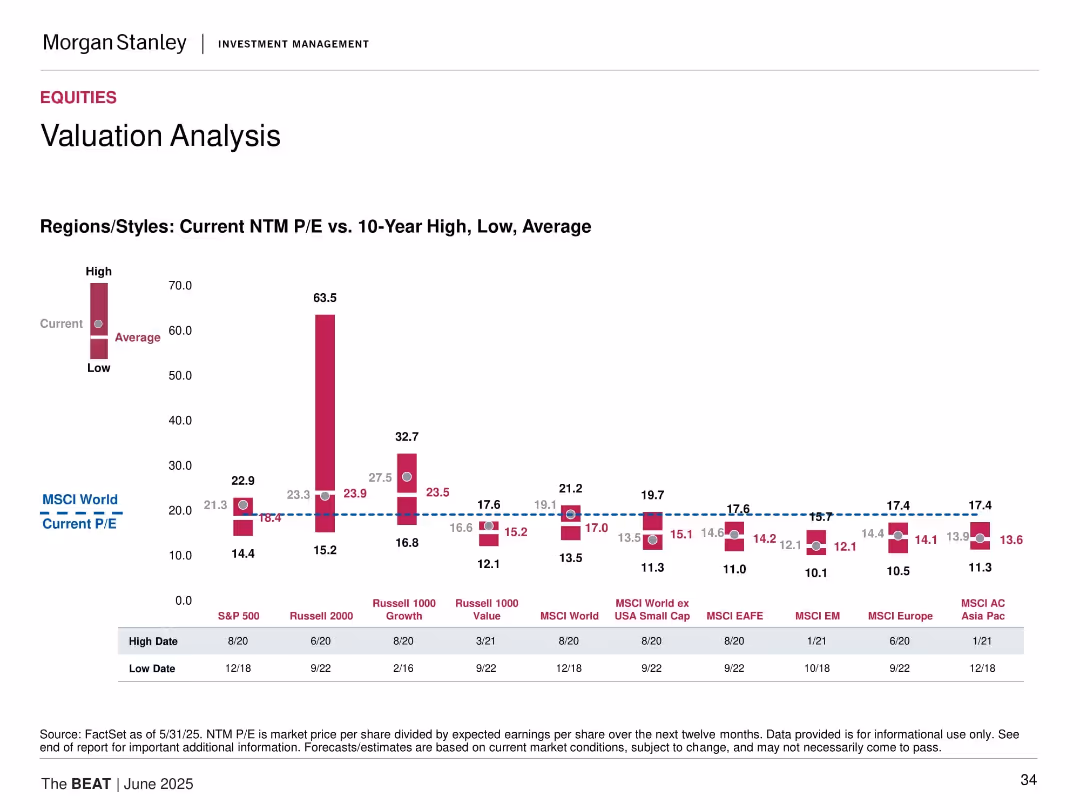
Bar graph of current vs. historical P/E ratios across global regions/styles, including high, low, and average.
Market Analysis and Trends
Financial Services
Compares current forward P/E ratios to 10-year highs/lows/averages for equity markets including S&P 500, Russell 2000, MSCI EM, EAFE, and Asia Pacific.
P/E ratio, valuation, equities, global markets, historical comparison, Russell, MSCI, earnings, valuation metrics
Mixed Chart
Morgan Stanley
Saved
The slide features a column chart comparing world biofuel demand by fuel type (solid biofuels, liquid biofuels, CHP from waste, biogases) for 2017. It highlights the dominance of traditional biofuels and the distribution of advanced biofuels.
Market Analysis and Trends
Energy & Utilities
This slide provides an overview of world biofuel demand by different fuel types, emphasizing the overwhelming dominance of traditional biofuels and the distribution of advanced biofuels across various categories.
world biofuel demand, fuel type, traditional biofuels, advanced biofuels, 2017, solid biofuels, liquid biofuels, CHP from waste, biogases
Single Chart
Kearney
Saved
Previous
Next
If nothing, comes up, please save your slides first
Create a FREE account to continue browsing
Receive Instant Access to 1,000+ slides from companies like McKinsey, Google, and Goldman Sachs
First Name
Last Name
Email
Password
I agree to all
Terms & Privacy Policy
Thank you! Your submission has been received!
Oops! Something went wrong while submitting the form.
Have an account?
Sign in
Column Chart
Heatmap
Chevron
Org Chart
Infographic
Callouts
Timeline
List
Graphic
Picture
Process Flow
Diagram
Paragraph
Map
Table
Framework
Subtitle
Takeaway Box
Icon
Other Chart
Radar Chart
Waterfall Chart
Mekko Chart
Pie Chart
Scatter Plot
Line Chart
Bar chart
Bullet points