My Account
My Slides
Search by Category
Templates
Leave Feedback
Login
Logout
Get Started
Browse all Slides
Browse all Slides
Create a FREE Account
Instant access to 1,000+ real slides from top companies like McKinsey, BCG, Goldman Sachs, Google and many more!
First Name
Last Name
Email
Password
I agree to all
Terms & Privacy Policy
Thank you! Your submission has been received!
Oops! Something went wrong while submitting the form.
Have an account?
Sign in
Saved Slides
Displays infographics on business travel sustainability efforts, including strategies for emission reduction and supplier engagement.
Operational Efficiency
Transportation & Logistics
Provides guidelines on optimizing travel for sustainability, involving corporate strategies and collaborations for carbon footprint reduction.
sustainability, carbon footprint, business travel, emission reduction, corporate strategy, supplier engagement
Vertical Flow
BCG
Saved
Five icons representing different areas of focus for implementing relief with brief descriptive texts.
Strategic Planning
Government & Public Sector
Suggests key areas of focus for state governments in implementing federal relief and recovery efforts from COVID-19.
federal relief, COVID-19, strategy, government, recovery, implementation
Header Horizontal
McKinsey
Saved
Contains two grouped column charts representing revenue and EBITDA from 2016 to 2020, comparing Telkom with competitors. Color-coded to distinguish between companies, with additional details on profitability margins included.
Financial Performance
Telecommunications
Analyzes Telkom's market leadership in terms of revenue and EBITDA, attributing its higher profitability to its scale advantage and leading market share in both mobile and fixed broadband sectors. Notes the financial strategies that keep it ahead of competitors like Indosat and XL.
market share, profitability, Telkom, revenue, EBITDA, competitors
Multiple Chart
BCG
Saved
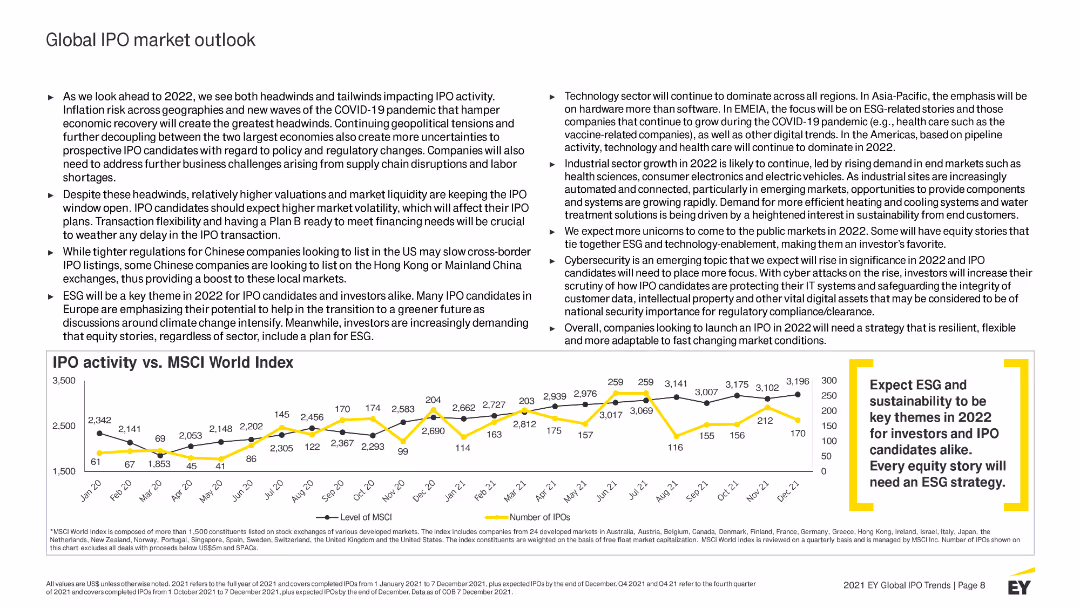
The slide features a line chart comparing IPO activity with the MSCI World Index from 2010 to 2022. Text sections discuss the outlook for global IPO markets, highlighting key trends and expected challenges.
Market Analysis and Trends
Financial Services
Analyzes the outlook for global IPO markets, noting potential headwinds and tailwinds. Discusses the impact of inflation, geopolitical tensions, and ESG considerations on future IPO activity.
IPO, global, market outlook, 2022, trends, challenges, financial services, ESG
Mixed Chart
EY
Saved
A text-focused layout with two pie charts demonstrating contract mix and business win rates.
Investment Analysis
Financial Services
The slide showcases the company’s industry leadership with key highlights, financial data, and contract distribution, asserting its position and financial stability to stakeholders.
Leadership, Financial Stability, Contract Distribution, Revenue
Multiple Chart
Booz Allen Hamilton
Saved
The slide uses a balanced layout with icons, images, and text to explain the process. On the left, there are two icons (a clipboard and a database) with text. In the middle, an image of an iPad displaying a chessboard. On the right, icons for recommendations and expert insights.
Operational Efficiency
Professional Services
The slide describes how Kearney's Digitized Purchasing Chessboard leverages category intelligence from databases and questionnaires to provide strategic recommendations and implementation guidance, aiming for improved purchasing decisions.
purchasing, digitization, Kearney, strategic, insights
Header Horizontal
Kearney
Saved
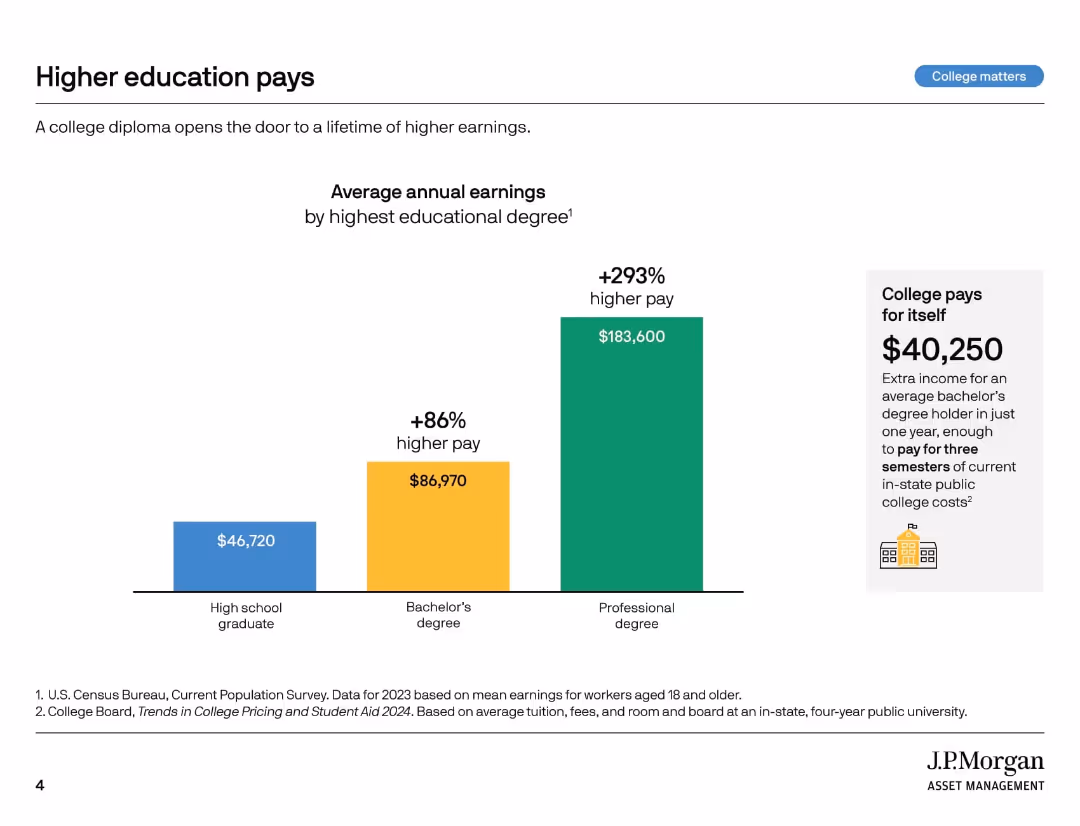
Bar chart with 3 vertical bars comparing average earnings by education level. Callout box emphasizes return on investment.
Market Analysis and Trends
Education & Training
This slide demonstrates how higher education levels correlate with increased earnings, emphasizing that a college degree provides a financial return. A bachelor's degree results in 86% higher pay, and the earnings from a professional degree are even greater.
college earnings, higher education, income comparison, ROI, degree value, pay gap, tuition payoff, bachelor’s degree, professional degree, education benefits
Mixed Chart
JP Morgan
Saved
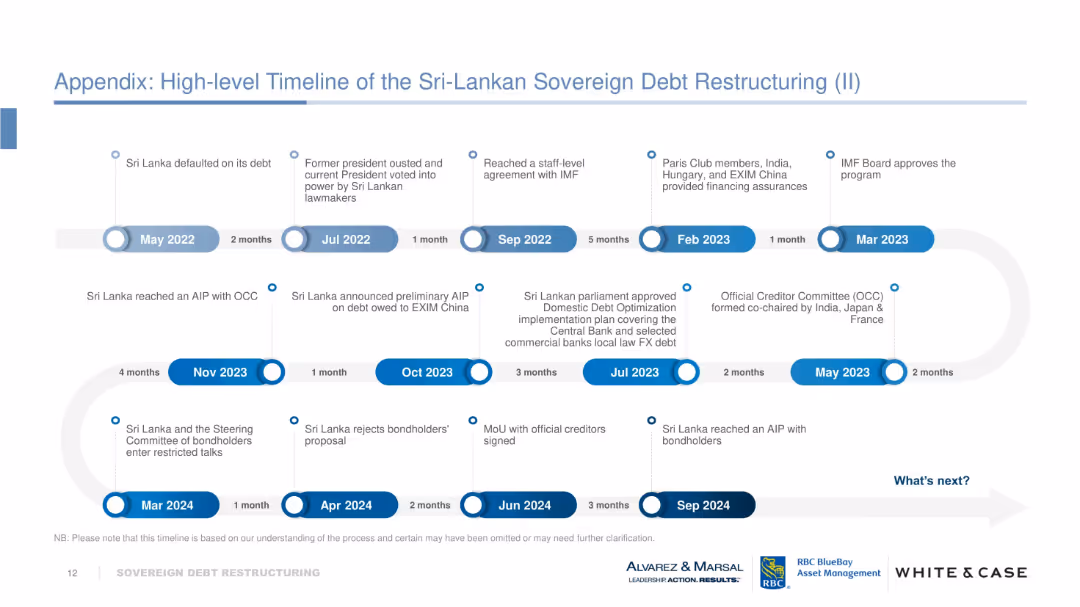
Horizontal timeline using labeled blue and white milestone circles connected by arrows. Covers events from May 2022 to Sep 2024 with major political and financial developments marked clearly. Uses a “What’s next?” callout.
Strategic Planning
Financial Services
This slide visually narrates the progression of Sri Lanka’s debt restructuring efforts, detailing political transitions, agreements with the IMF and OCC, domestic debt optimization, and bondholder negotiations. It emphasizes key events and intervals, forecasting the continuation of restructuring beyond Sep 2024.
Sri Lanka, debt restructuring, IMF, OCC, bondholders, default, timeline, AIP, milestones
Vertical Flow
Alvarez & Marsal
Saved
This content slide combines a text block discussing job impacts with two column charts. The left chart compares gray and green job changes under LCE scenarios, while the right chart shows total employment deviations from baseline over time.
Human Resources and Talent Management
Professional Services
The slide highlights the job market shifts due to the green transition, projecting job losses in fossil fuel sectors (gray jobs) and job creation in green sectors (green jobs) by 2050. It emphasizes the need for investment in eco-industries to boost employment and manage the transition smoothly.
Green Jobs, Employment, Workforce, Transition, LCE
Multiple Chart
EY
Saved
The slide includes a Venn diagram showing three overlapping areas: Desirability, Feasibility, and Viability, with a central section labeled "EY-P digital distribution framework analysis." Surrounding the diagram are key points related to strategic rationale, top-bottom implications, and practical aspects.
Strategic Planning
Financial Services
The slide presents the EY-Parthenon strategy framework for ensuring that the tokenization concept aligns with market needs, is financially viable, and can be executed practically, highlighting strategic rationale, cost implications, and practical aspects of distribution options.
strategy, framework, analysis, tokenization, feasibility, viability
Framework
EY
Saved
Slide includes column charts showing GDP growth by quarter and future projections compared to the rest of the world. The visual elements are organized neatly, using green and purple to differentiate between past performance and future expectations, enhancing readability.
Strategic Planning
Government & Public Sector
Analyzes China's economic recovery post-COVID-19 and its projected impact on global GDP growth, focusing on sector-specific growth and future contributions to the world economy.
economic recovery, GDP growth, China, post-COVID-19, global impact
Multiple Chart
BCG
Saved
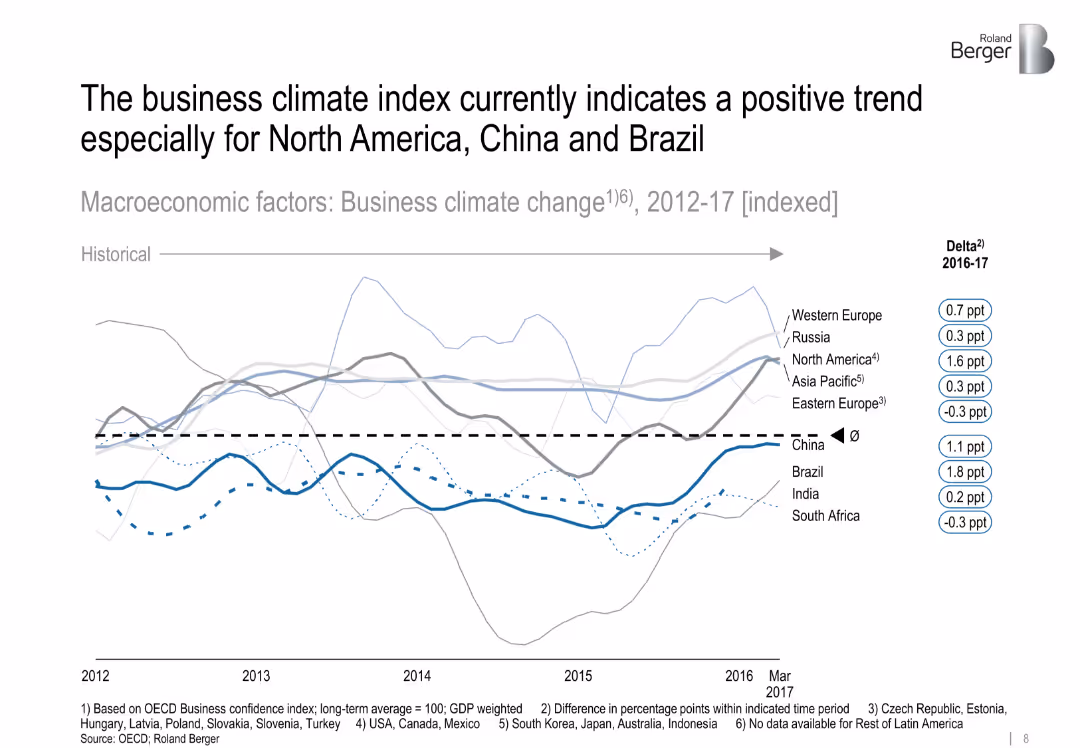
Line graph showing indexed business climate trends across regions, with emphasis on recent delta changes
Market Analysis and Trends
Industrial & Manufacturing
The slide evaluates regional business climate shifts from 2012 to 2017, highlighting recent improvements in North America, China, and Brazil. It uses OECD data to chart confidence and trend direction.
business climate, macroeconomics, confidence, North America, China, Brazil, OECD
Single Chart
Roland Berger
Saved
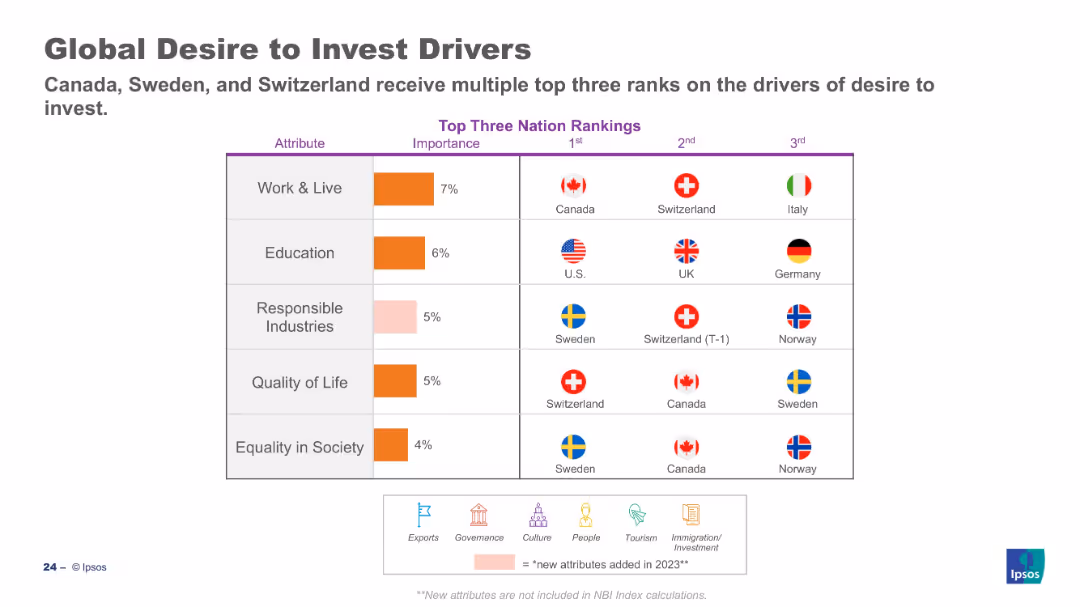
Table ranks top countries for each investment driver; importance column on left.
Customer and Market Segmentation
Professional Services
This slide showcases which countries are perceived most favorably for investment attributes like work & live, education, and quality of life. Canada, Sweden, and Switzerland rank highly across multiple categories, highlighting their strong international appeal.
investment, perception, countries, Ipsos, drivers, ranking, global sentiment, attributes
Mixed Chart
IPSOS
Saved
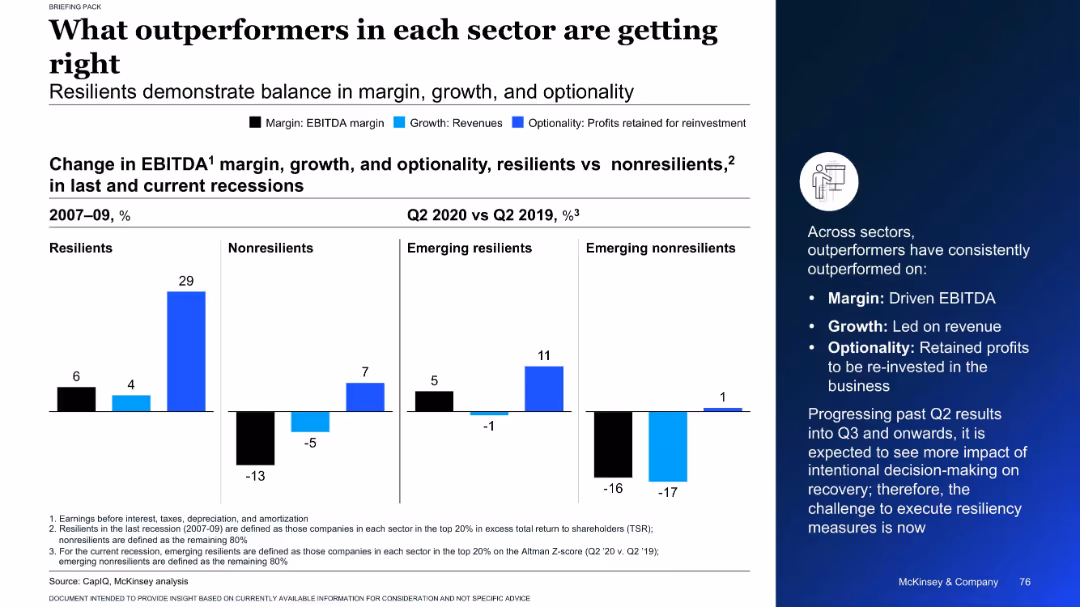
Split chart showing EBITDA, revenue, and reinvestment changes for resilient and non-resilient firms across recessions
Performance Metrics and KPIs
Professional Services
This slide highlights the traits of outperforming companies in past and current recessions. It compares resilient and non-resilient firms on margin, growth, and optionality, showing that resilient companies consistently excel in all three metrics.
EBITDA, growth, resilience, recession, company performance
Mixed Chart
McKinsey
Saved
Slide with a blue and white color scheme, containing a title, a column chart of SEA-based funds' dry powder, and a sidebar with bullet points.
Market Analysis and Trends
Financial Services
Discusses investors' caution, the significance of dry powder, and the potential for investment opportunities.
investors, dry powder, SEA, capital, funds, caution, activity, opportunities
Mixed Chart
Bain
Saved
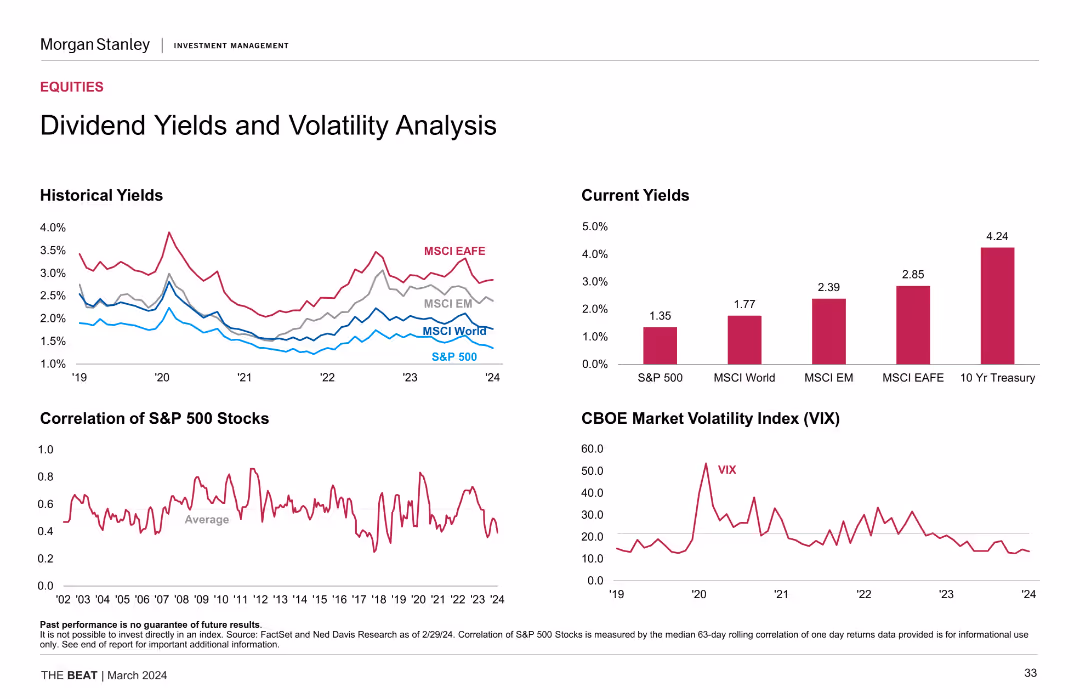
The slide includes line charts showing historical yields and the correlation of S&P 500 stocks, a bar chart of current yields, and a line chart of the CBOE Market Volatility Index (VIX).
Investment Analysis
Financial Services
The slide analyzes dividend yields and market volatility, providing historical and current data. Useful for understanding investment risks and returns.
dividend yields, volatility, S&P 500, correlation, MSCI, VIX, investment analysis
Multiple Chart
Morgan Stanley
Saved
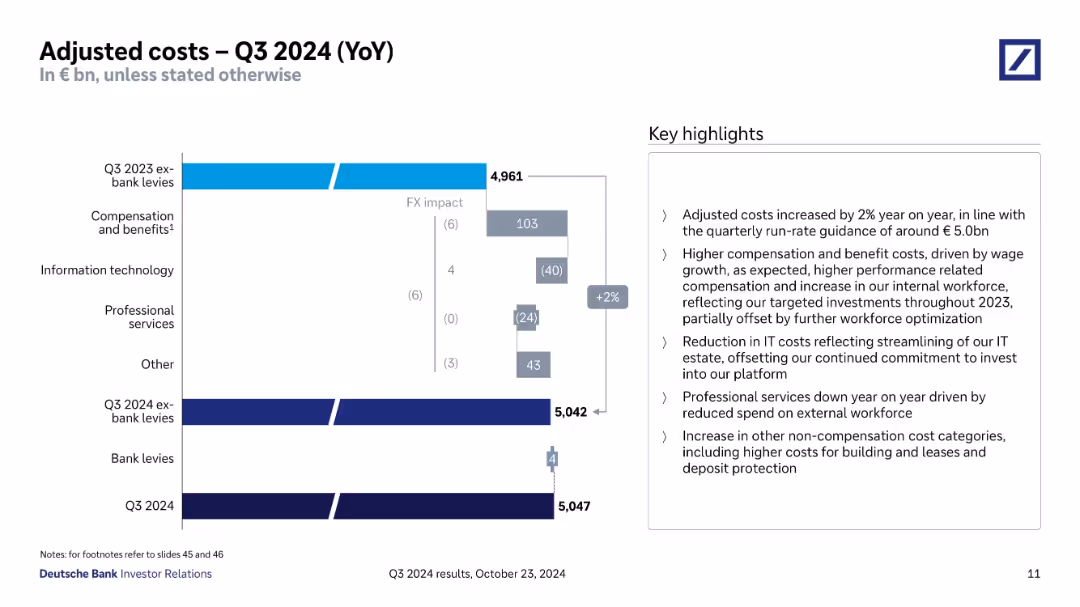
Waterfall chart showing cost components YoY; key highlights box on right.
Operational Efficiency
Financial Services
Analyzes changes in adjusted costs year-over-year, attributing changes to compensation, IT, professional services, and FX impact. Costs rose 2%, mainly due to compensation and growth in internal workforce, with IT and services offsetting increases.
cost increase, YoY comparison, workforce, IT costs, FX impact
Mixed Chart
Deutsche Bank
Saved
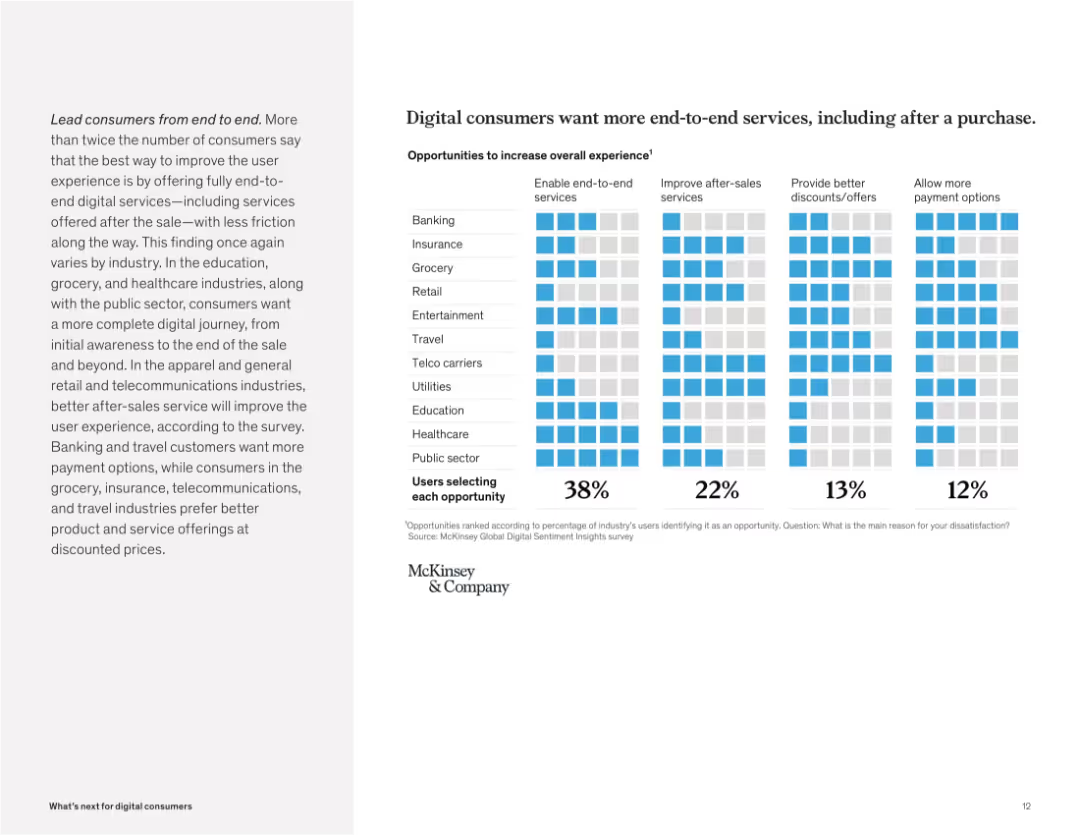
Grid matrix showing percentages selecting improvement areas like end-to-end services, after-sales, and discounts. Light-blue color coding.
Customer and Market Segmentation
Technology & Software
Consumers demand seamless digital journeys that cover post-purchase experiences. The top priority across most industries is enabling end-to-end services, followed by better after-sales support and payment options.
end-to-end, digital journey, post-purchase, after-sales, discounts, payment, consumer demand, frictionless
Mixed Chart
McKinsey
Saved
Slide with multiple 3D column charts showing capital deployment over fiscal years and the number of acquisitions.
Mergers and Acquisitions
Technology & Software
Analyzes Accenture’s strategic investments in acquisitions, highlighting the capital deployed and the increased number of acquisitions to enhance capabilities.
acquisitions, investments, skills, capital deployment, strategic growth, Accenture, capabilities, fiscal year, enhancement
Mixed Chart
Accenture
Saved
This slide has a minimal design with key achievements highlighted using blue boxes and descriptive text. It's separated into three sections, each showcasing different aspects of business strength and breadth, including graphics illustrating scale and multi-line business relationships.
Competitive Landscape
Financial Services
The slide highlights JPMorgan Chase & Co.'s strong position in various business domains, emphasizing its scale and offering breadth. It likely serves to assert the company's competitive advantage and market leadership to stakeholders or in competitive analysis briefings.
Business Positions, Scale, Offerings, Market Leadership, Competitive Advantage, JPMorgan Chase & Co., Stakeholders
Header Horizontal
JP Morgan
Saved
The slide features a bar chart showing the economic impact of each GTA home sale, with various categories such as professional services, renovations, and general household purchases.
Market Analysis and Trends
Real Estate & Construction
This slide concludes with the economic benefits of home sales, highlighting the different areas where each sale contributes financially.
economic impact, home sales, GTA, financial benefits, bar chart, professional services
Single Chart
IPSOS
Saved
Split layout with bar charts detailing digital capability preferences by generation on the right and an image on the left.
Market Analysis and Trends
Healthcare & Pharmaceuticals
Shows that younger consumers are more likely to choose medical providers offering digital capabilities, with preferences varying by generation.
medical, providers, digital, preferences, generation
Multiple Chart
Accenture
Saved
Features a column chart showing the trends in global M&A volumes from 2002-2018 and a circular diagram depicting the expectations of organizations regarding the number of deals in the next 12 months, split by 2018 and 2019 data.
Mergers and Acquisitions
Financial Services
Summarizes global M&A trends, highlighting the increase in transaction volumes over time and the anticipations for future deals. It provides a historical context to understand the growing significance of M&A activities.
M&A, Trends, Global, Future, Deals, Volumes, Growth, Expectations
Multiple Chart
Deloitte
Saved
Slide with multiple column charts detailing various French economic measures including corporate taxation, PACTE law, and unemployment insurance reform. Colors range from red to gray to indicate different levels of public perception from negative to positive.
Market Analysis and Trends
Government & Public Sector
Analyzes public perception of ongoing economic measures in France and their impact on the country's attractiveness, aimed at policymakers and economic analysts.
France, economic measures, public perception, corporate taxation, unemployment insurance, PACTE law, reform impact
Multiple Chart
Bain
Saved
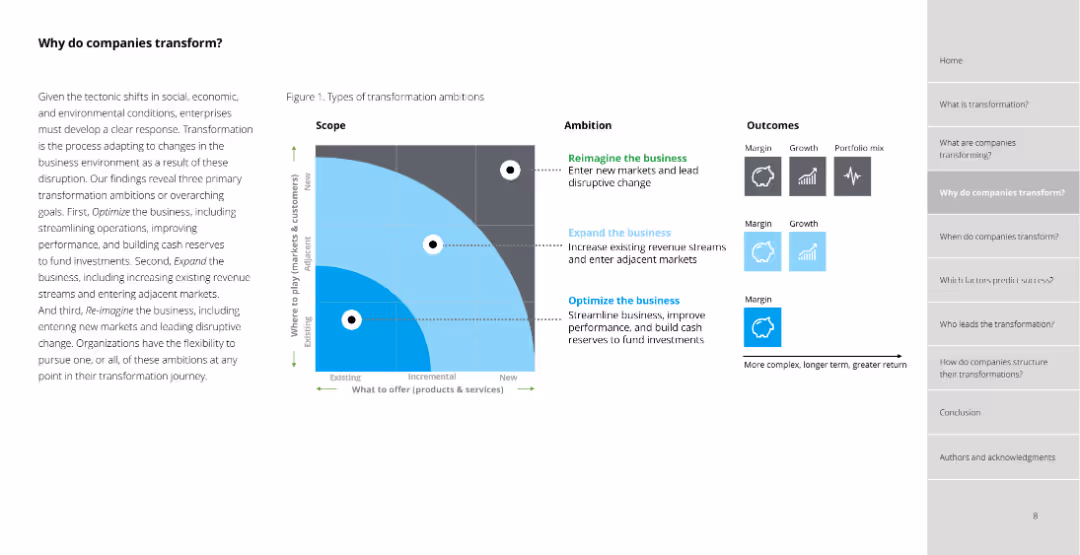
The slide features a quadrant chart with transformation ambitions: Optimize, Expand, and Reimagine. It includes text on the left and icons on the right.
Strategic Planning
Professional Services
Discusses three primary transformation ambitions for businesses: optimizing, expanding, and reimagining. Includes a quadrant chart illustrating these ambitions.
transformation, optimize, expand, reimagine, business, ambitions, goals, quadrant, chart
Diagram
Deloitte
Saved
Previous
Next
If nothing, comes up, please save your slides first
Create a FREE account to continue browsing
Receive Instant Access to 1,000+ slides from companies like McKinsey, Google, and Goldman Sachs
First Name
Last Name
Email
Password
I agree to all
Terms & Privacy Policy
Thank you! Your submission has been received!
Oops! Something went wrong while submitting the form.
Have an account?
Sign in
Column Chart
Heatmap
Chevron
Org Chart
Infographic
Callouts
Timeline
List
Graphic
Picture
Process Flow
Diagram
Paragraph
Map
Table
Framework
Subtitle
Takeaway Box
Icon
Other Chart
Radar Chart
Waterfall Chart
Mekko Chart
Pie Chart
Scatter Plot
Line Chart
Bar chart
Bullet points