My Account
My Slides
Search by Category
Templates
Leave Feedback
Login
Logout
Get Started
Browse all Slides
Browse all Slides
Create a FREE Account
Instant access to 1,000+ real slides from top companies like McKinsey, BCG, Goldman Sachs, Google and many more!
First Name
Last Name
Email
Password
I agree to all
Terms & Privacy Policy
Thank you! Your submission has been received!
Oops! Something went wrong while submitting the form.
Have an account?
Sign in
Saved Slides
The slide has a column chart displaying US client satisfaction scores from 2019 to 2021, with a testimonial quote from a top US tech player.
Client Case Studies
Professional Services
It highlights client satisfaction scores over three years, emphasizing the positive impact of Ipsos's work on client relationships and growth.
client satisfaction, growth, Ipsos, impact, scores
Mixed Chart
IPSOS
Saved
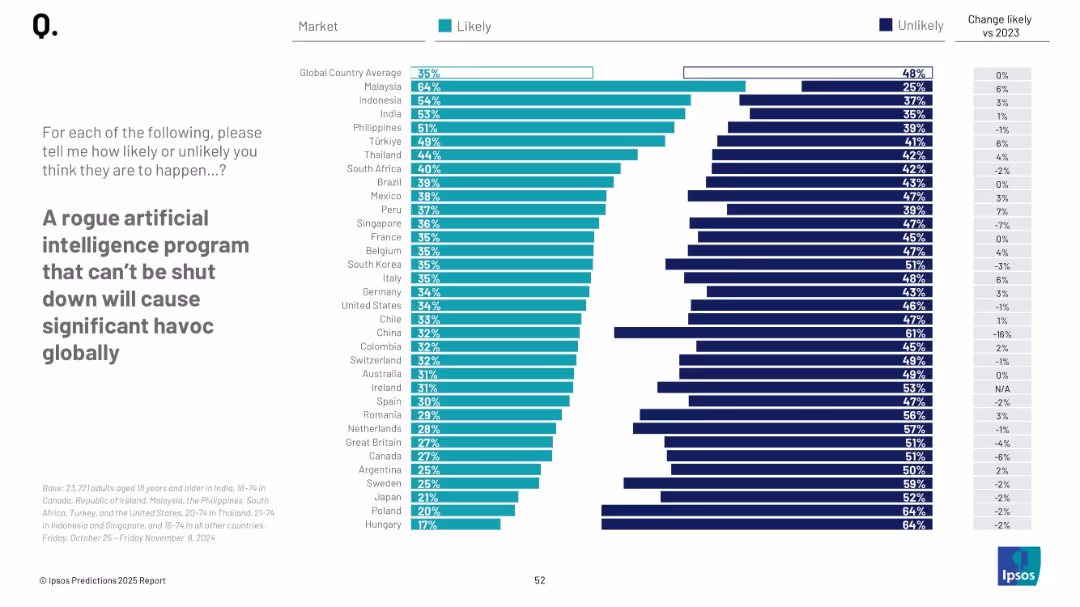
Horizontal bar chart with country-wise opinions; teal and navy color scheme; clean, grid-aligned layout
Risk Assessment and Management
Artificial Intelligence
This slide measures global concern over uncontrolled AI. It displays the percentage of respondents by country who believe such an AI program could cause global chaos, indicating rising or falling concern vs. 2023.
AI risk, rogue AI, global concern, public opinion, technology, survey, perceptions, threat, international views
Mixed Chart
IPSOS
Saved
Column charts for revenues, detailed text boxes with key financials
Financial Performance
Financial Services
Results and highlights for personal banking and wealth management sectors
Personal Banking, Wealth Management, Revenue, Column Chart, Financials
Mixed Chart
Citigroup
Saved
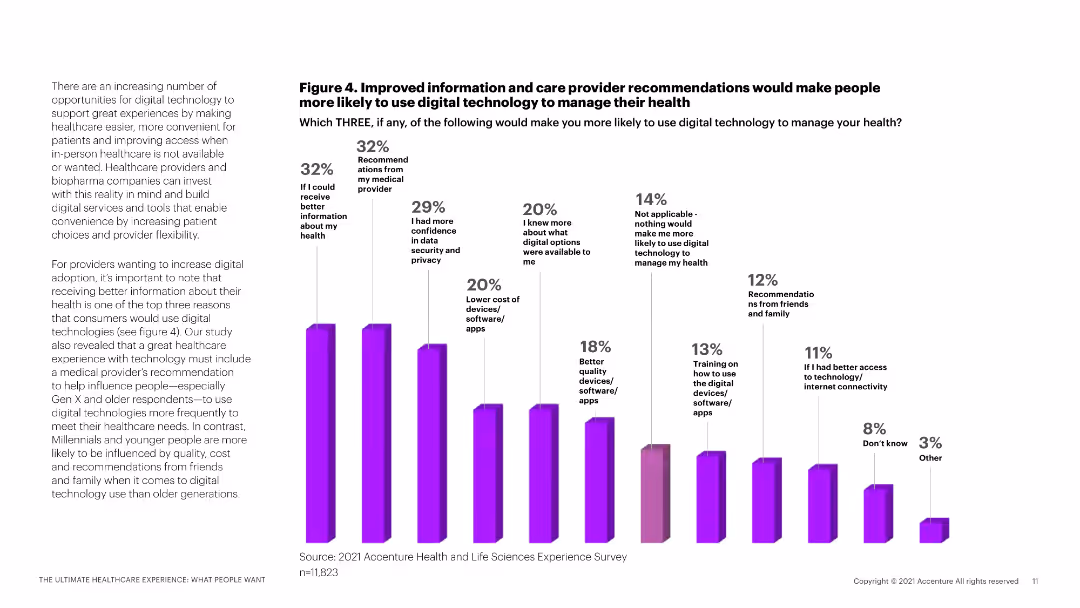
A column chart detailing factors that would encourage the use of digital health technologies, with accompanying text on the left.
Market Analysis and Trends
Healthcare & Pharmaceuticals
This slide explores the factors that would increase the likelihood of patients using digital health technologies to manage their health.
digital technology, healthcare management, patient recommendations, data security, provider recommendations
Mixed Chart
Accenture
Saved
The slide features a column chart showing Nigeria's exports in Q1 – Q3 2023 by sector. It includes red columns representing various sectors and total export.
Financial Performance
Energy & Utilities
Highlights the overreliance on crude oil exports, accounting for 80.3% of total exports. It discusses challenges limiting non-oil export growth.
Nigeria, exports, crude oil, non-oil, challenges, revenue, energy, Q1-Q3 2023, total export
Mixed Chart
PwC/Strategy&
Saved
The slide features two bar charts showing which departments in wealth management expect the greatest time and cost savings from GenAI implementation. Text below provides further context and additional details on survey findings.
Operational Efficiency
Financial Services
This slide highlights survey results on time and cost savings expected in wealth management from GenAI implementation. It identifies client onboarding, marketing, and report generation as key areas of impact.
GenAI, time savings, cost savings, wealth management, client onboarding, marketing, report generation, survey
Multiple Chart
EY
Saved
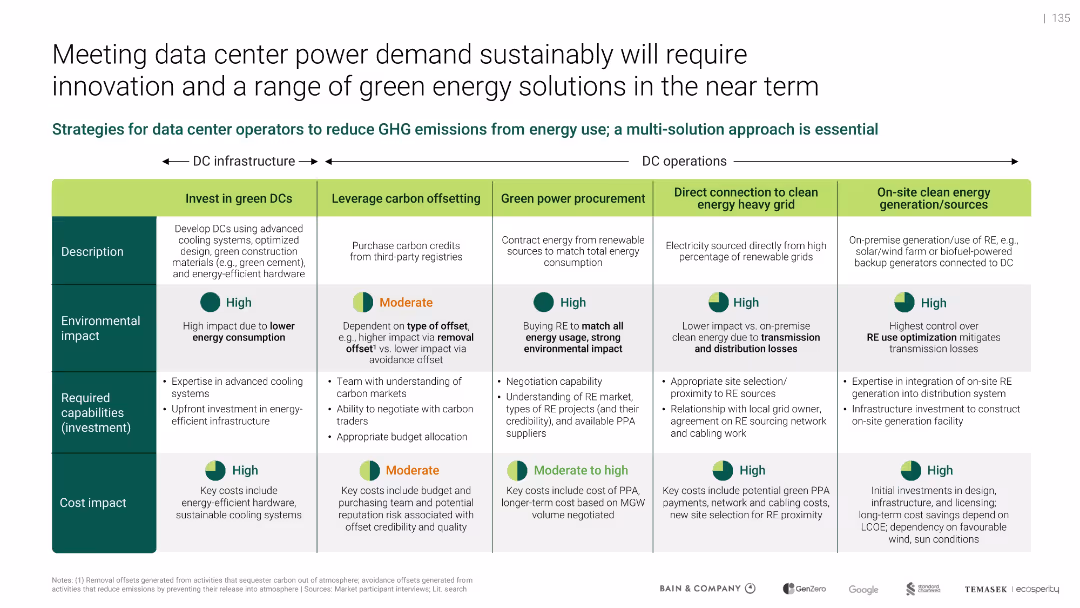
Matrix table format categorizing five decarbonization strategies; green-themed visuals
Operational Efficiency
Technology & Software
Proposes a multi-solution strategy for reducing emissions from data center energy use. Outlines five approaches including investing in green DCs, carbon offsetting, renewable procurement, grid connection, and on-site generation. Each is evaluated by environmental impact, required investment, and cost impact.
carbon offsetting, green power, infrastructure, emissions, PUE, RE sources, sustainability, DC operations
Mixed Chart
Bain
Saved
Slide displays bar graphs detailing the representation of women in national parliaments over time, complemented by clear textual annotations and visual elements emphasizing changes and trends.
Market Analysis and Trends
Government & Public Sector
Discusses the trends and disparities in women's political participation globally, highlighting both progress and areas needing improvement, aimed at fostering discussions on gender equality in governance.
gender equality, politics, global, data, trends, women, parliament, comparison, progress, equity
Multiple Chart
Roland Berger
Saved
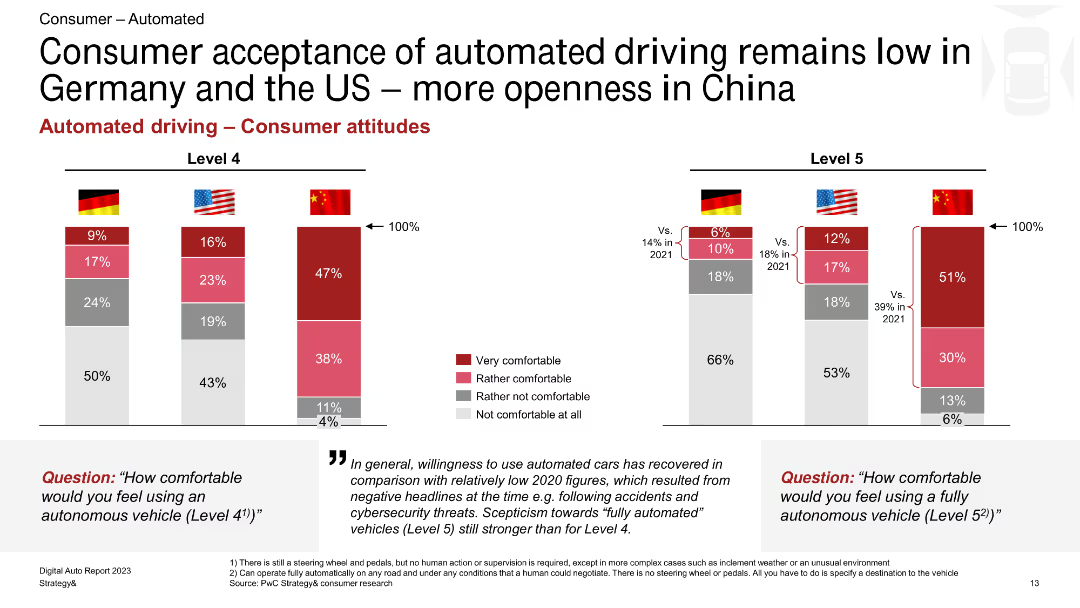
The slide shows two stacked bar charts representing consumer attitudes towards automated driving (Level 4 and Level 5) in Germany, the US, and China, with color-coded comfort levels.
Market Analysis and Trends
Transportation & Logistics
The slide illustrates that acceptance of automated driving is higher in China compared to Germany and the US, with varying comfort levels towards Level 4 and Level 5 automated driving features.
automated driving, consumer attitudes, Germany, US, China, Level 4, Level 5, acceptance, automotive, comfort levels
Multiple Chart
PwC/Strategy&
Saved
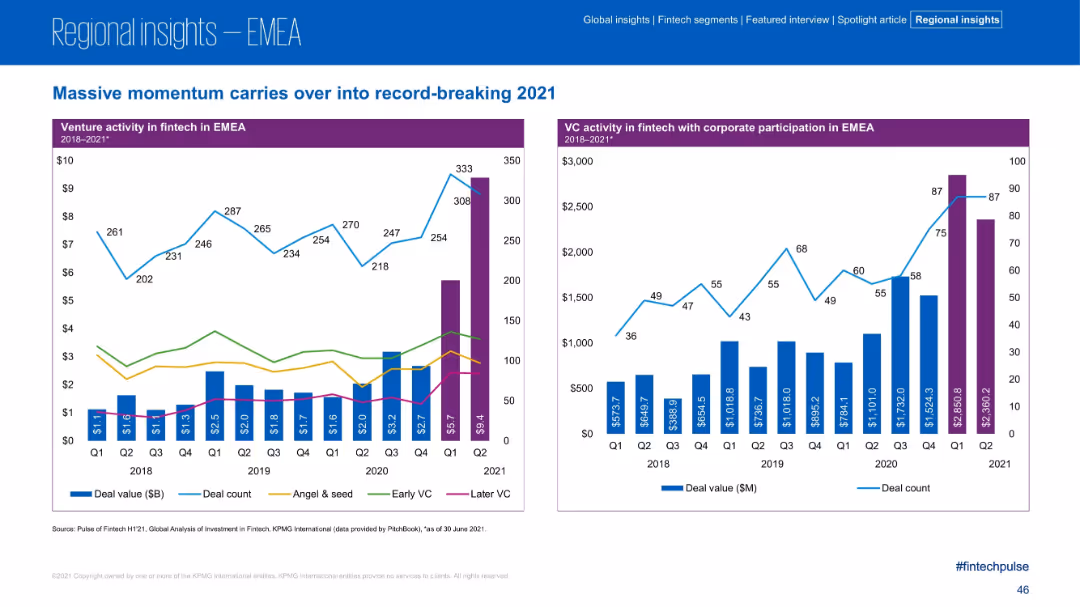
Dual-panel charts; left panel shows VC activity by deal stage (stacked bars) with lines for counts; right panel shows VC with corporate participation using bars and line graphs. Purple headers with blue and green tones.
Investment Analysis
Financial Services
The slide illustrates continued momentum in fintech venture activity across EMEA in 2021, highlighting record-high investments. It splits VC investments by stage and corporate participation, showing significant Q2 2021 growth, particularly in later-stage VC.
VC, Corporate Participation, Fintech, Angel Investment, EMEA, Deal Value, Early Stage, Later Stage
Multiple Chart
KPMG
Saved
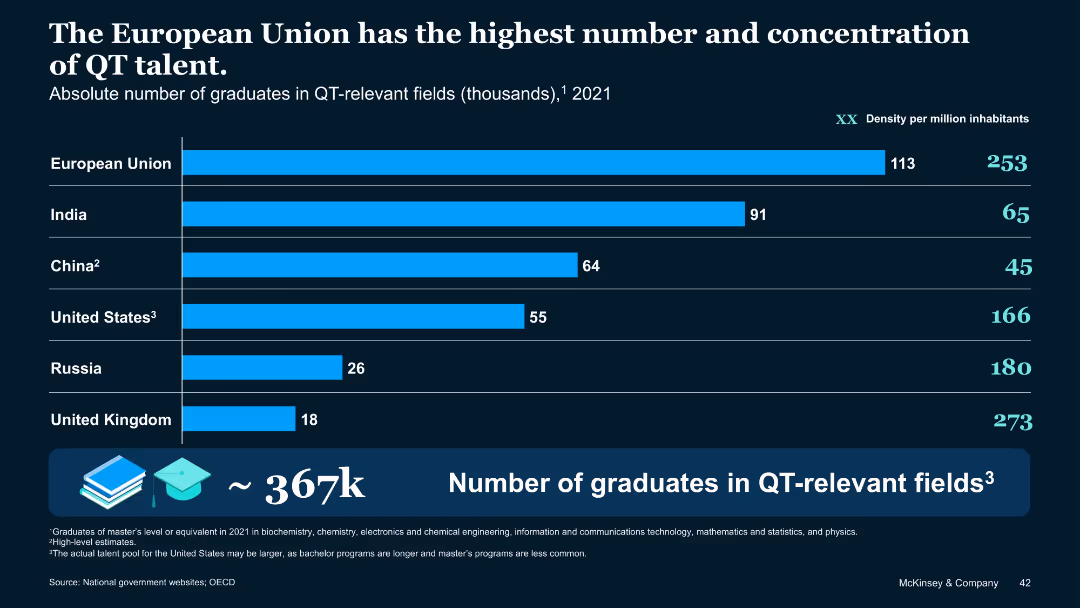
Horizontal bar chart of QT graduates (thousands) by country, with density metrics per million inhabitants.
Human Resources and Talent Management
Education & Training
EU has the most QT graduates in total and per capita (253/million). India has high absolute numbers, while the U.S. leads in talent density. The data suggests the EU is best positioned in terms of depth and breadth of quantum-relevant workforce.
QT talent, graduates, EU, India, U.S., talent pool, workforce, education, density
Mixed Chart
McKinsey
Saved
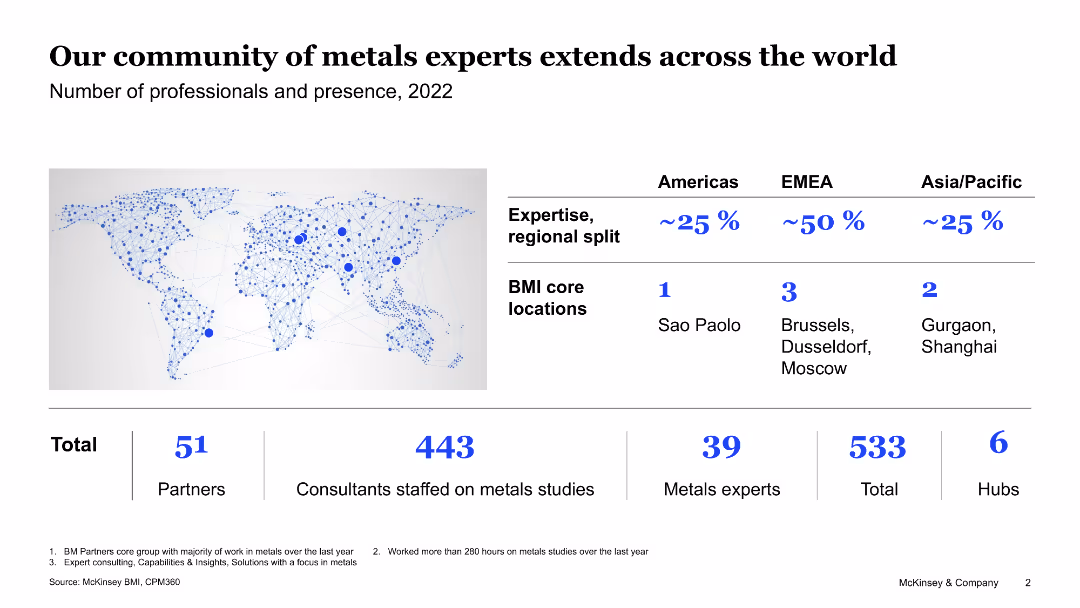
The slide shows a world map with blue dots representing the presence of professionals. It also includes a table with regional splits and a column chart detailing numbers of professionals.
Human Resources and Talent Management
Industrial & Manufacturing
This slide showcases the global presence of metals experts, detailing the number of partners, consultants, and experts in different regions, highlighting core locations.
metals experts, global presence, regional split, professionals, core locations
Graphic
McKinsey
Saved
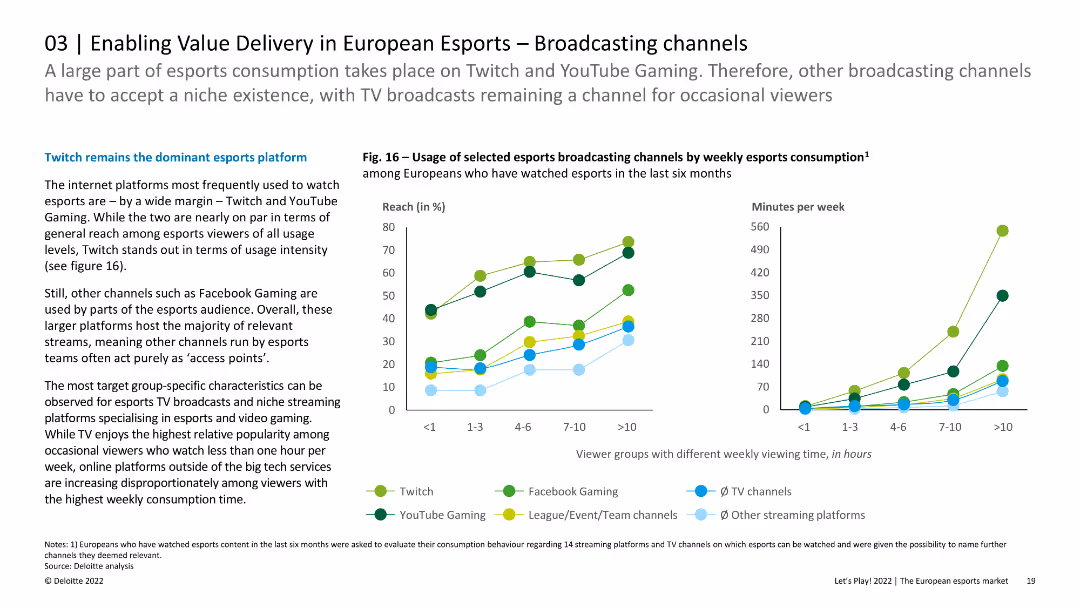
The slide features line charts showing the usage of selected esports broadcasting channels by weekly esports consumption. The layout is visually engaging with clear trend lines.
Strategic Planning
Media & Entertainment
This slide analyzes the viewing patterns of esports audiences across different broadcasting platforms in Europe, highlighting the popularity of Twitch and YouTube Gaming. It provides insights into how different viewer groups engage with these platforms based on viewing time.
Esports, Broadcasting, Platforms, Europe, Viewing
Multiple Chart
Deloitte
Saved
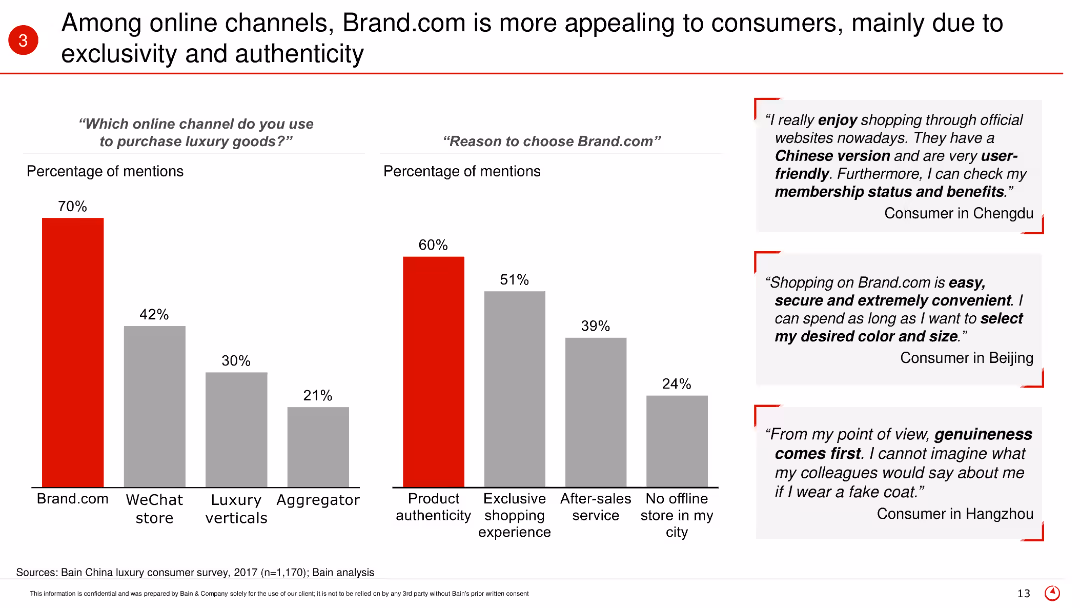
The slide features bar charts showing consumer preferences for different online channels and reasons for choosing Brand.com, with supporting consumer quotes on the right side.
Market Analysis and Trends
Retail & E-commerce
The slide details why Brand.com is favored by consumers over other online channels, focusing on product authenticity, exclusive shopping experiences, and other factors driving consumer choice.
Consumer preferences, online channels, Brand.com, authenticity, exclusivity, survey
Multiple Chart
Bain
Saved
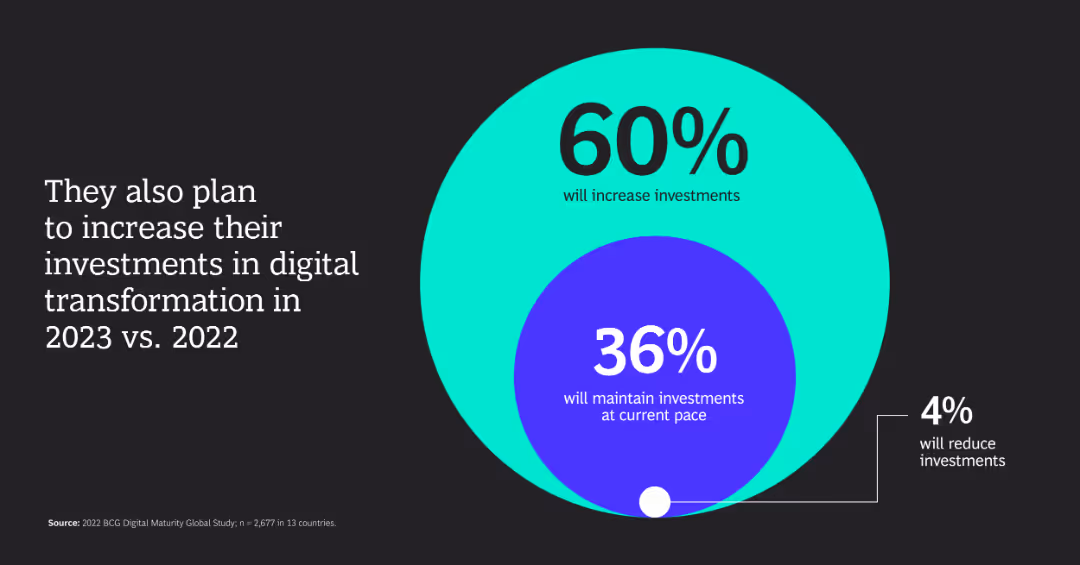
The slide features a large circle chart with segmented percentages indicating plans to increase, maintain, or reduce investments.
Investment Analysis
Financial Services
The slide shows that 60% of companies plan to increase their investments in digital transformation in 2023 compared to 2022.
investments, digital transformation, percentage, 2023, 2022
Diagram
BCG
Saved
Features bar charts displaying the percentage of electronification across various FICC asset classes from 2016 to 2020, with key observations on market trends.
Market Analysis and Trends
Financial Services
Provides insights into the electronification trends in FICC products, highlighting different asset class adaptations and market responses.
FICC, electronification, asset classes, market trends
Multiple Chart
JP Morgan
Saved
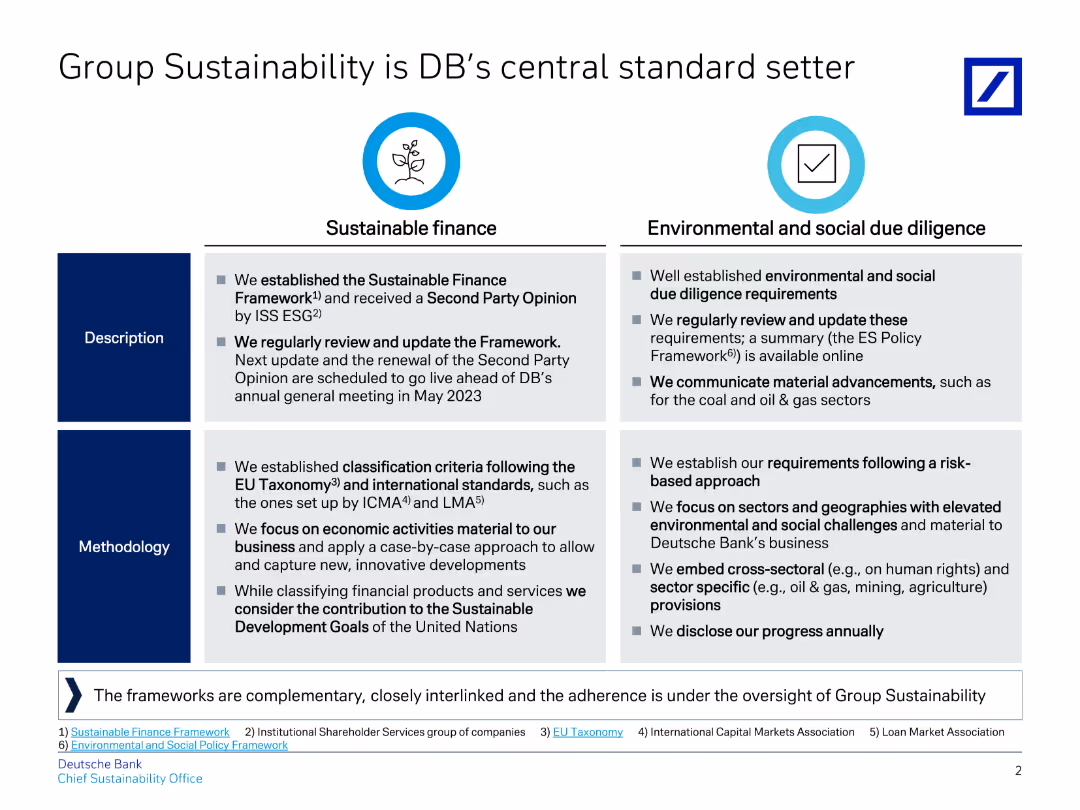
Contains two columns with descriptions and methodologies for Sustainable Finance and Environmental and Social Due Diligence, along with supporting text.
Regulatory and Compliance
Financial Services
The slide compares sustainable finance practices with environmental and social due diligence, highlighting Deutsche Bank's commitment to these standards and regular updates.
Sustainability, finance, due diligence, standards, methodology, banking, ESG, framework, compliance, regulation
Table
Deutsche Bank
Saved
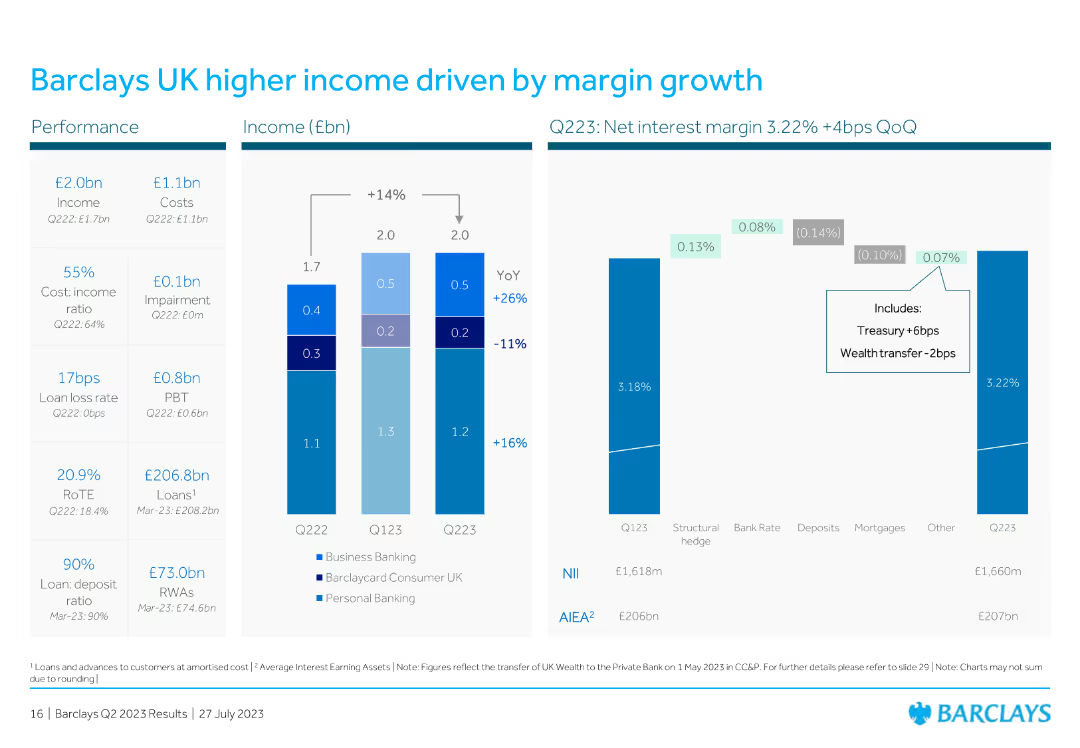
The slide presents a column chart showing income, costs, and other metrics over different quarters, highlighting margin growth.
Financial Performance
Financial Services
This slide focuses on the income growth for Barclays UK driven by increased margins, and includes various performance metrics to support the data.
Barclays UK, income, growth, margin, performance, metrics, financial, column chart, quarter, costs
Multiple Chart
Barclays
Saved
This slide compares investment trends across early-stage, growth-stage, and late-stage companies, using overlapping area charts for each stage to represent the private funding value from H1 2019 to H1 2022. Text annotations summarize the trend insights for each stage, such as growing early-stage investments and late-stage downturns.
Investment Analysis
Financial Services
An analysis of investment patterns, contrasting early, growth, and late-stage investments over time, with an emphasis on the flourishing early-stage sector and the challenges faced by late-stage investments due to diminished IPO prospects.
investments, early-stage, growth-stage, late-stage, IPO, trends, private funding
Multiple Chart
Bain
Saved
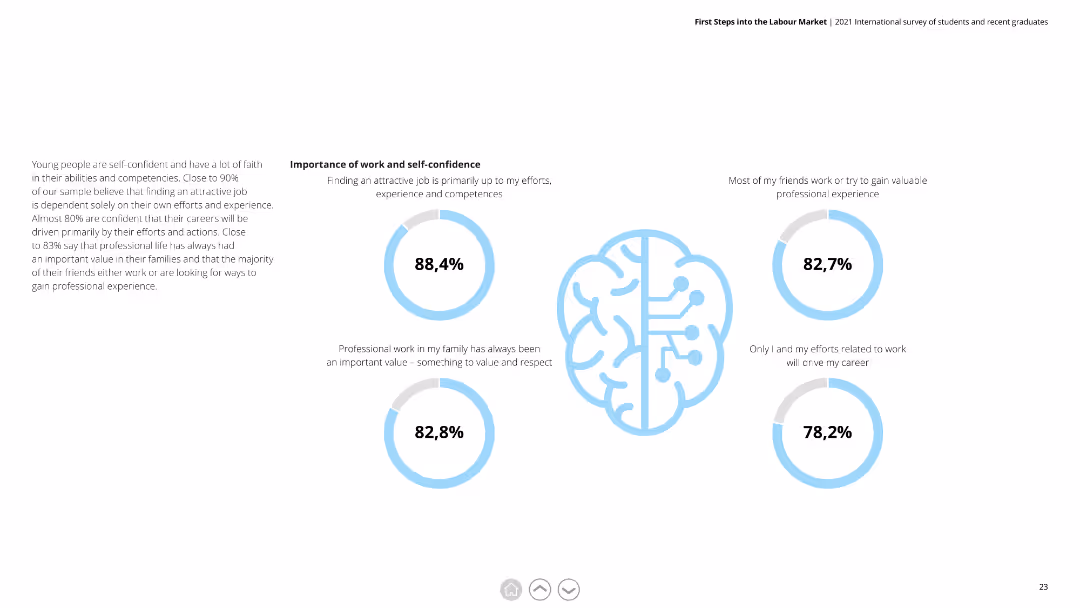
Circular diagrams showing percentages related to the importance of work and self-confidence among respondents.
Market Analysis and Trends
Professional Services
Illustrates the high level of confidence respondents have in their ability to find attractive jobs and the value they place on professional work.
Work Importance, Self-Confidence, Professional Work, Jobs, Respondents
Multiple Chart
Deloitte
Saved
Displays a pie chart comparison of Hong Kong advertising revenue by segments for 2022 and 2027. The charts show a significant shift towards digital advertising over traditional formats like TV and newspaper. The design is straightforward with a clear visual representation of data changes over time, accompanied by concise text explanations.
Market Analysis and Trends
Media & Entertainment
Analyzes shifts in advertising revenue sources in Hong Kong, emphasizing the decline of traditional media and the rise of digital platforms. Useful for understanding market transitions and planning digital marketing strategies.
Hong Kong, advertising revenue, digital dominance, traditional media decline, market analysis
Multiple Chart
PwC/Strategy&
Saved
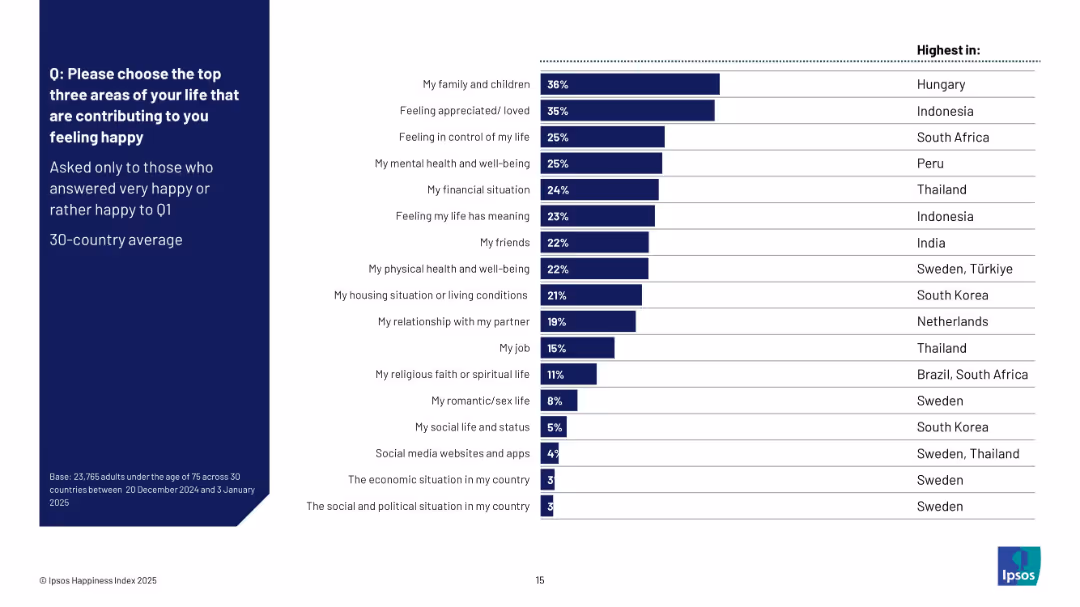
Horizontal bar chart showing top happiness drivers; includes right column listing countries with highest mentions per factor; clean layout with dark blue sidebar.
Customer and Market Segmentation
Professional Services
This slide lists the top life factors that contribute to happiness, based on survey respondents who felt happy. Family and feeling appreciated are top across countries, with South Africa, Indonesia, and Hungary showing unique peaks in some categories. It provides a comparative view of emotional contributors across regions.
happiness drivers, relationships, well-being, life factors, Ipsos, country comparison, 2025, global study
Mixed Chart
IPSOS
Saved
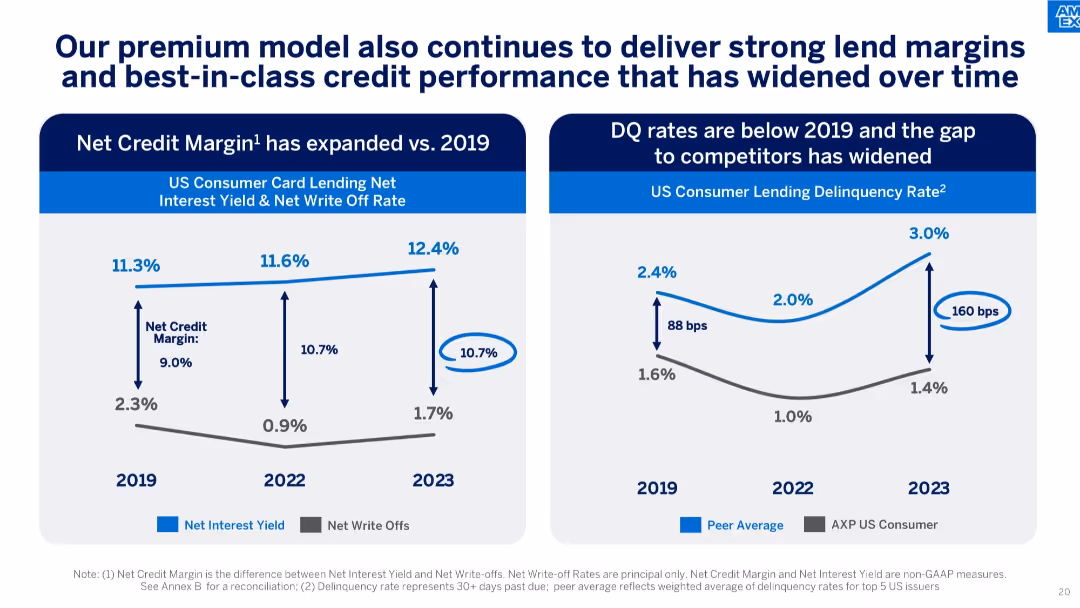
Dual-chart layout showing Net Credit Margin expansion and improved delinquency rate gap over time.
Risk Assessment and Management
Financial Services
Demonstrates how AXP’s lending model yields strong margins and lower delinquency rates compared to peers, with performance improving from 2019 to 2023.
net credit margin, delinquency rate, lending performance, peer comparison, write-offs, interest yield, credit quality
Multiple Chart
McKinsey
Saved
Text and visual indicators (percentage gaps, agreement bars) showing divergence in views between employees and employers on work preferences.
Human Resources and Talent Management
Professional Services
This slide highlights the differences in perceptions between employees and employers regarding new work preferences, including hybrid work, flexibility, travel, and productivity.
Work preferences, divergence, employee, employer, hybrid work, flexibility, percentage gaps
Multiple Chart
EY
Saved
Consists of a gradient green scale illustrating levels of digital marketing maturity from Nascent to Multi-moment. The layout is straightforward with circular nodes and connecting lines.
Market Analysis and Trends
Media & Entertainment
This slide assesses various brands on their digital marketing maturity, categorizing them from nascent to multi-moment stages. It highlights the progression and maturity in digital marketing practices among brands, useful for understanding market positions and planning marketing strategies.
digital marketing, brand assessment, maturity scale, nascent, multi-moment, marketing strategies, market analysis, progression, technology, engagement
Linear Flow
BCG
Saved
Previous
Next
If nothing, comes up, please save your slides first
Create a FREE account to continue browsing
Receive Instant Access to 1,000+ slides from companies like McKinsey, Google, and Goldman Sachs
First Name
Last Name
Email
Password
I agree to all
Terms & Privacy Policy
Thank you! Your submission has been received!
Oops! Something went wrong while submitting the form.
Have an account?
Sign in
Column Chart
Heatmap
Chevron
Org Chart
Infographic
Callouts
Timeline
List
Graphic
Picture
Process Flow
Diagram
Paragraph
Map
Table
Framework
Subtitle
Takeaway Box
Icon
Other Chart
Radar Chart
Waterfall Chart
Mekko Chart
Pie Chart
Scatter Plot
Line Chart
Bar chart
Bullet points