My Account
My Slides
Search by Category
Templates
Leave Feedback
Login
Logout
Get Started
Browse all Slides
Browse all Slides
Create a FREE Account
Instant access to 1,000+ real slides from top companies like McKinsey, BCG, Goldman Sachs, Google and many more!
First Name
Last Name
Email
Password
I agree to all
Terms & Privacy Policy
Thank you! Your submission has been received!
Oops! Something went wrong while submitting the form.
Have an account?
Sign in
Saved Slides
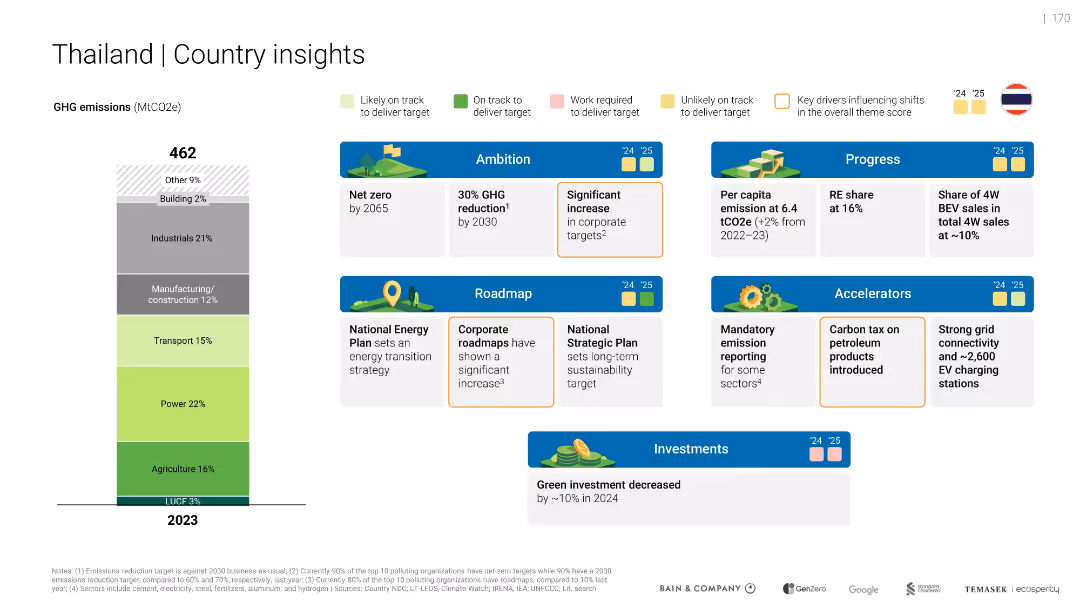
Vertical emissions bar and structured layout of “Ambition”, “Progress”, “Roadmap”, and “Accelerators” sections. Color-coded performance markers and icons.
Strategic Planning
Government & Public Sector
Shows Thailand’s 2023 emissions by sector and outlines policy actions, targets, and performance in green initiatives. Highlights mixed progress toward targets and mentions a 10% green investment decrease in 2024.
Thailand, net zero, roadmap, emission reporting, investment drop
Mixed Chart
Bain
Saved
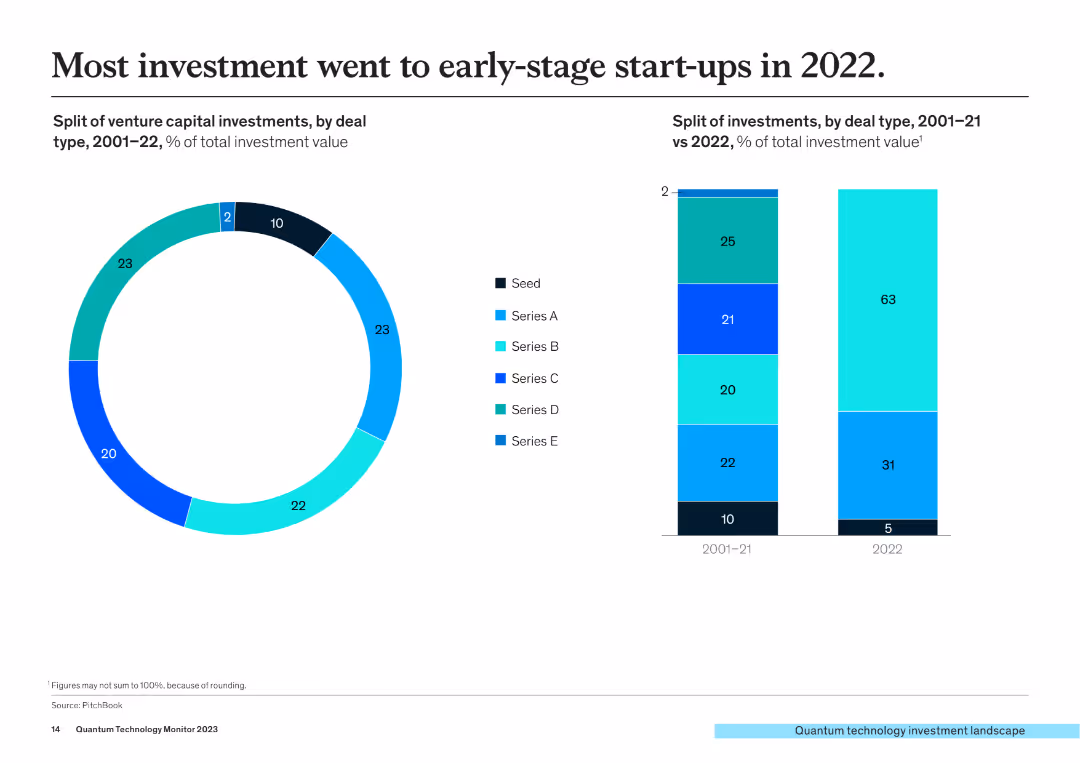
The slide includes a pie chart and a column chart. The pie chart shows the split of venture capital investments by deal type (Seed, Series A-E) from 2001-2022, and the column chart compares investment types between 2001-21 and 2022.
Investment Analysis
Financial Services
This slide illustrates that most investments in 2022 went to early-stage start-ups, with detailed breakdowns of investment types and their changes over time.
early-stage start-ups, venture capital, investment types, deal types, growth trends
Multiple Chart
McKinsey
Saved
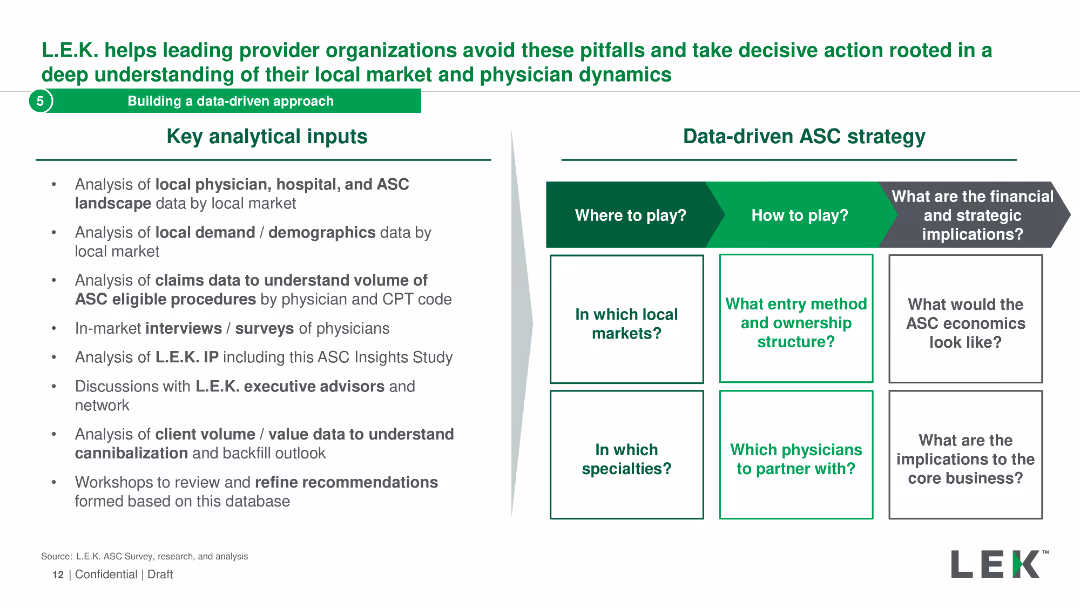
The slide is split into two sections: key analytical inputs and a matrix for a data-driven ASC strategy. It lists various data analysis methods and strategic questions.
Strategic Planning
Healthcare & Pharmaceuticals
It describes the analytical inputs and strategic considerations for building a data-driven ASC strategy, including local market analysis and physician dynamics.
data-driven, ASC, strategy, analysis, inputs
Header Horizontal
LEK
Saved
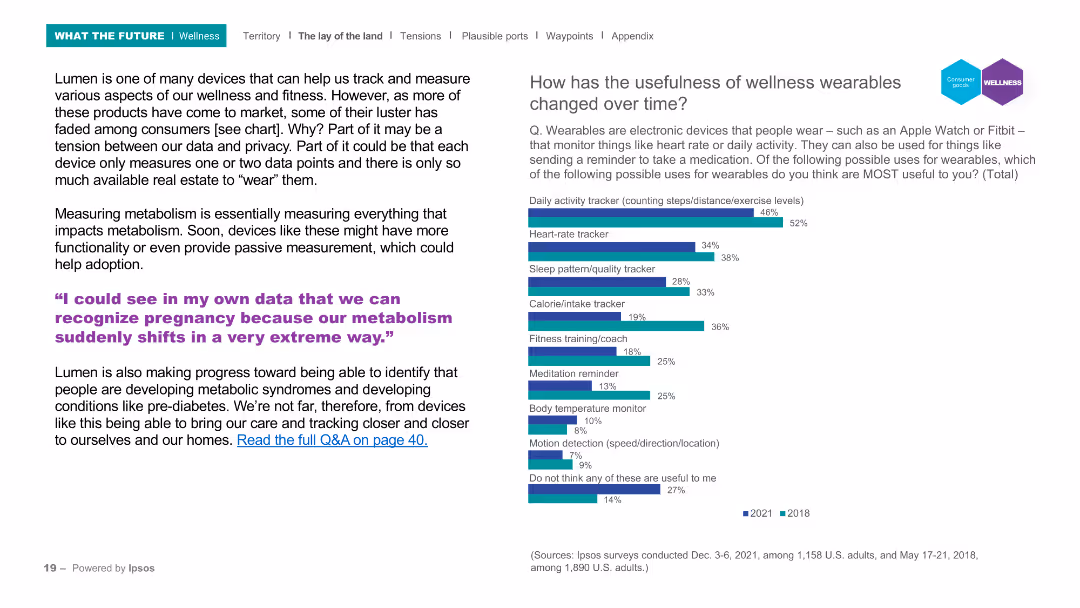
The slide includes a header, a background image, and two main sections: a text block on the left and a column chart on the right. The column chart compares the perceived usefulness of various wellness wearable features from 2018 and 2021, with a focus on features like activity tracking and heart rate monitoring.
Product and Service Analysis
Healthcare & Pharmaceuticals
Discusses the evolution and adoption of wellness wearables, highlighting their increasing functionality and the balance between data privacy and usefulness. The column chart illustrates changes in the perceived usefulness of wellness wearables over time, focusing on features such as activity tracking and heart rate monitoring.
Wellness, wearables, activity tracking, heart rate, survey
Mixed Chart
IPSOS
Saved
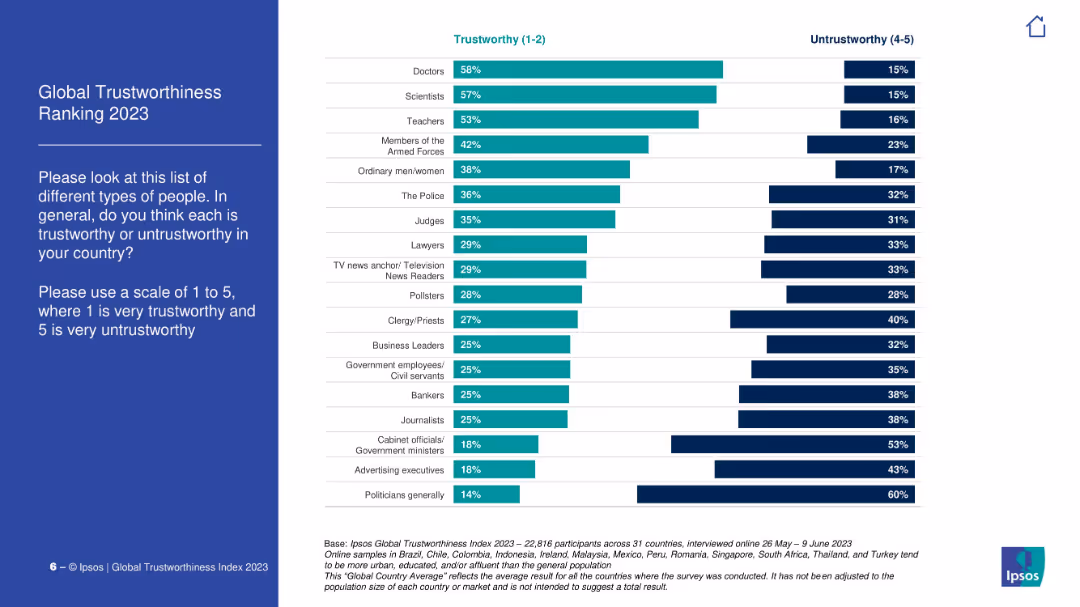
Horizontal bar chart with two data columns: % rating professions as trustworthy and untrustworthy. Professions listed on the left.
Market Analysis and Trends
Professional Services
This slide highlights the most and least trusted professions globally. Doctors, scientists, and teachers top the list for trustworthiness, while politicians, advertisers, and government officials are seen as the least trusted.
trustworthiness, professions, public opinion, Ipsos, survey, credibility, politics, media, science
Mixed Chart
IPSOS
Saved
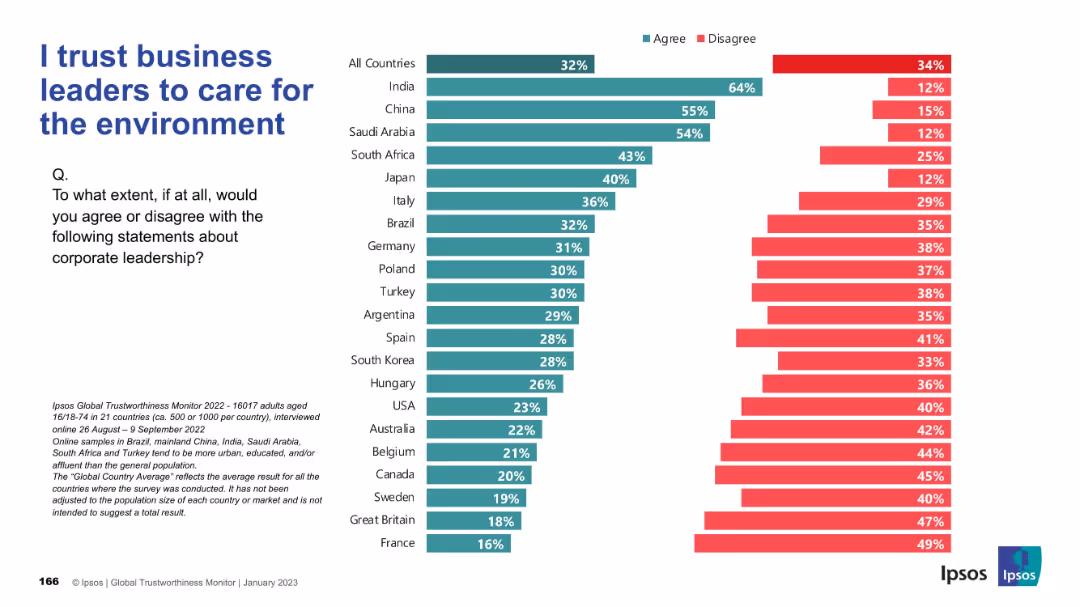
Similar bar chart format to Slide 19311; teal and red bars for agree/disagree; countries listed vertically; layout and design are consistent with previous slide.
Regulatory and Compliance
Environmental Services & Sustainability
The slide measures public belief in corporate leaders’ commitment to environmental issues. India, China, and Saudi Arabia rank high in trust, while Western nations express more skepticism.
sustainability, environment, leadership, ESG, perception, global views, Ipsos, corporate responsibility
Mixed Chart
IPSOS
Saved
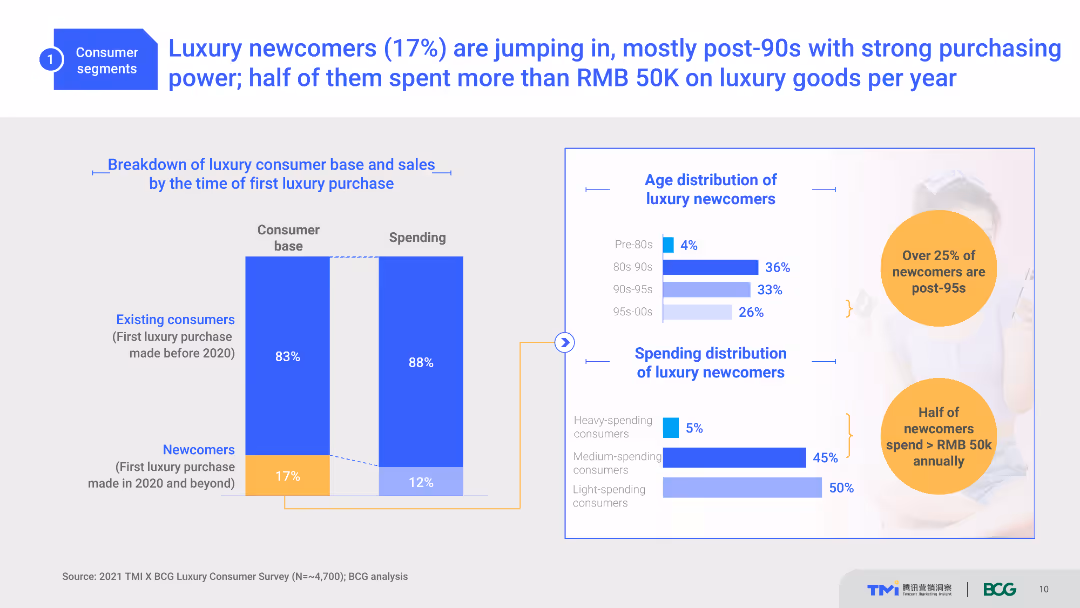
A slide with two column charts depicting the consumer base and spending, and bar charts showing age and spending distribution. Light blue, white, and orange colors are used with text explanations.
Customer and Market Segmentation
Consumer Goods
The slide shows the breakdown of luxury consumers by the time of their first luxury purchase, age distribution, and spending habits of newcomers, primarily post-90s.
Luxury, Consumer Segmentation, Spending, Age Distribution, Post-90s
Multiple Chart
BCG
Saved
This slide features a horizontal layout with text at the top and four images aligned horizontally below it, each representing different aspects of society (Population, Migration, Values, Education). The text is succinct and above the images.
Market Analysis and Trends
Education & Training
The slide presents the megatrend "People & Society," discussing demographic aspects such as population, migration, values, and education. It aims to highlight the dynamic nature of society and its foundational influence on various sectors and policies.
demographics, society, education, migration, population
Pillar
Roland Berger
Saved
A column chart depicting the multiples of annual gross salaries required to purchase a 70 sqm dwelling.
Market Analysis and Trends
Real Estate & Construction
This slide assesses housing affordability by showing how many annual gross salaries are needed to purchase a standard-sized dwelling.
housing affordability, gross salaries, dwelling, market analysis, real estate, affordability index
Mixed Chart
Deloitte
Saved
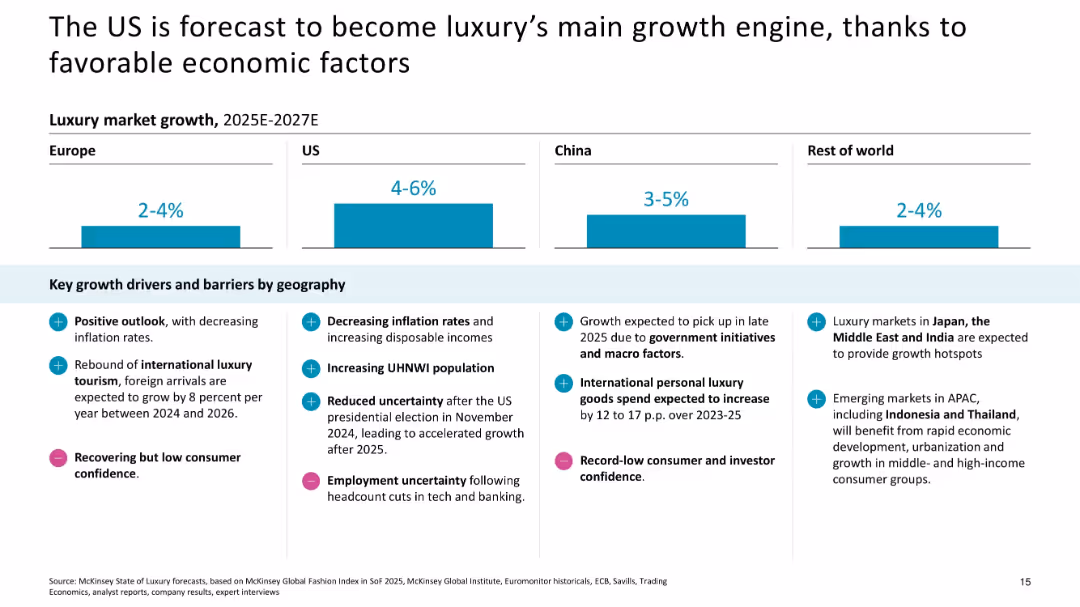
Column bar chart with regional growth forecasts and supporting bullet points
Strategic Planning
Consumer Goods
The slide forecasts the US as the primary growth driver for luxury between 2025–2027, citing lower inflation, political stability, and increased wealth, while noting regional barriers.
US market, economic drivers, forecast, inflation, UHNWIs, macro factors, regional barriers
Mixed Chart
McKinsey
Saved
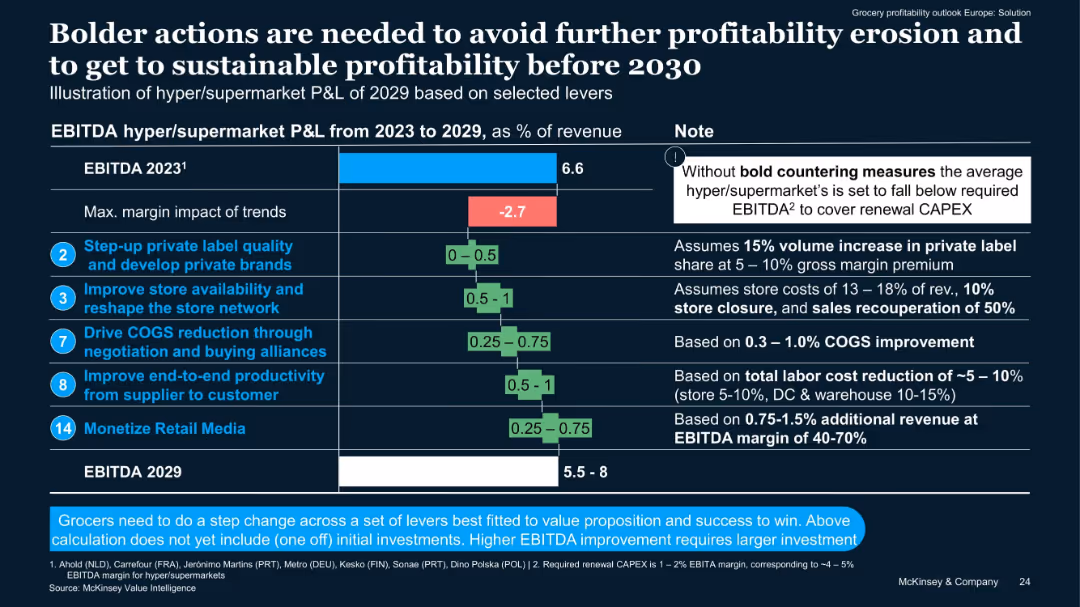
Horizontal bar chart with margin impacts, accompanied by numeric and note columns. Blue, green, and red color-coded bars.
Financial Performance
Retail & E-commerce
Shows projected EBITDA changes for hyper/supermarkets from 2023 to 2029 based on five key levers. Highlights a -2.7% margin trend risk without bold action, and outlines the potential upside of selected strategic initiatives.
EBITDA, private label, store network, COGS, productivity, retail media
Mixed Chart
McKinsey
Saved
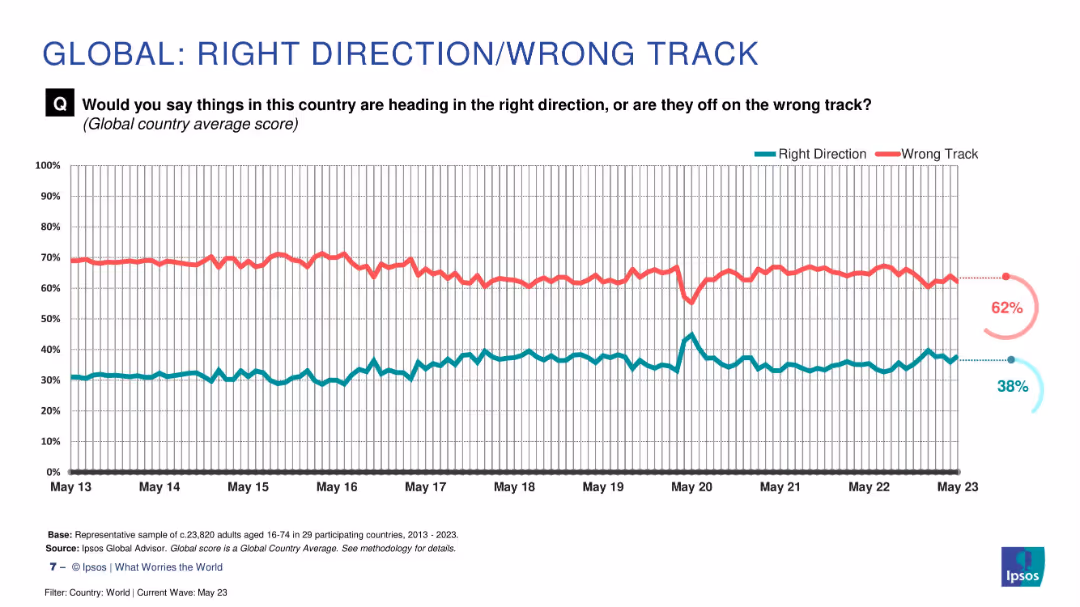
Longitudinal line graph from 2013 to 2023 comparing “Right Direction” vs. “Wrong Track” percentages
Market Analysis and Trends
Government & Public Sector
A long-term trend line illustrating global average perception of national direction over 10 years. "Wrong Track" has consistently remained higher than "Right Direction", although the latter shows recent modest gains. The gap has narrowed slightly but remains significant.
trend, decade, direction, sentiment, wrong track
Multiple Chart
IPSOS
Saved
A bar graph and timeline are depicted, contrasting the private funding value across different halves of the years. The visual elements are in shades of blue, offering a stark visual against the white background. The data points are clear, and there is a dotted line indicating a forecasted trend.
Investment Analysis
Financial Services
The slide outlines the growth in deal value in Singapore, making it a preferred investment destination in the region. It provides historical and current data on private funding values, useful for assessing the investment climate and predicting future trends in regional investment activities.
investment, growth, deal value, Singapore, private funding
Single Chart
Bain
Saved
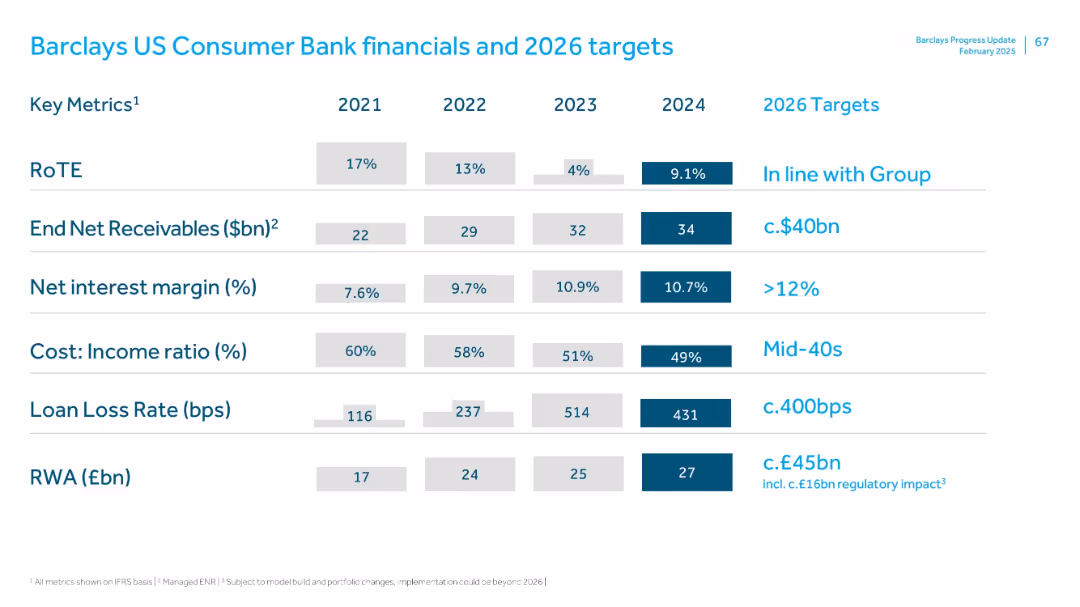
Key metrics table (2021–2024), color-coded with emphasis on 2024 and 2026 targets; blue and white minimalist layout
Financial Performance
Financial Services
The slide reviews US Consumer Bank metrics like RoTE, net receivables, net interest margin, cost-income ratio, loan loss rate, and RWA. 2026 targets aim for margin >12%, lower cost ratios, and manageable loan loss rates. Consistent growth in net receivables and RWA is shown.
US Consumer Bank, receivables, net interest margin, RoTE, loan loss, RWA
Single Chart
Barclays
Saved
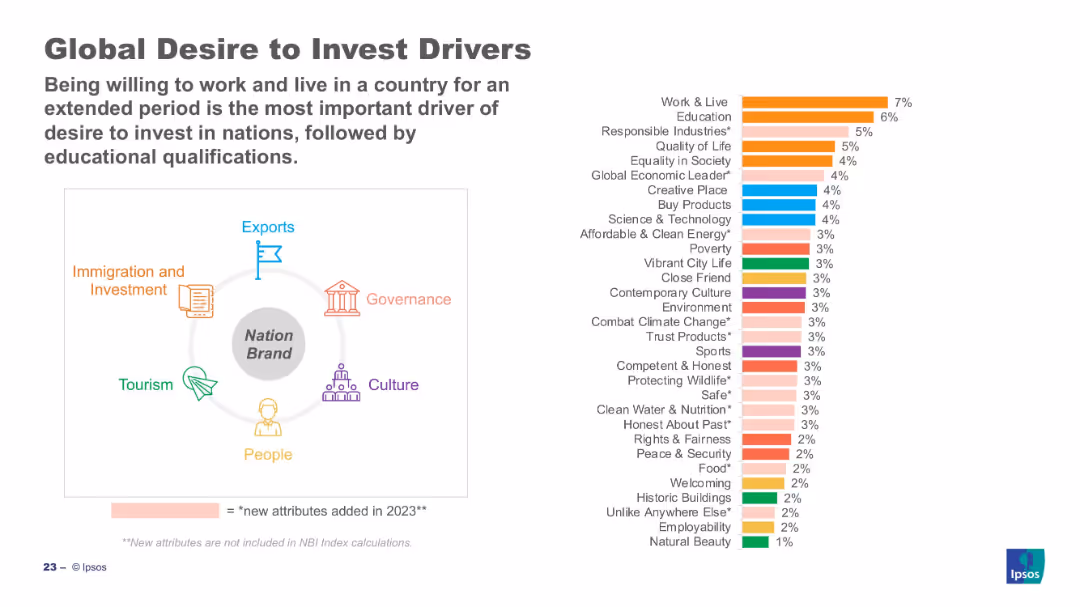
Bar chart (right) ranks top investment drivers; left visual maps drivers to nation brand sectors.
Customer and Market Segmentation
Professional Services
Work & live, education, and responsible industries are top investment drivers globally. The visual shows these drivers categorized under broader nation brand domains such as governance and economy. Many of the attributes were newly added in 2023.
investment, business drivers, Ipsos, perception, work, education, 2023, attributes, sustainability
Mixed Chart
IPSOS
Saved
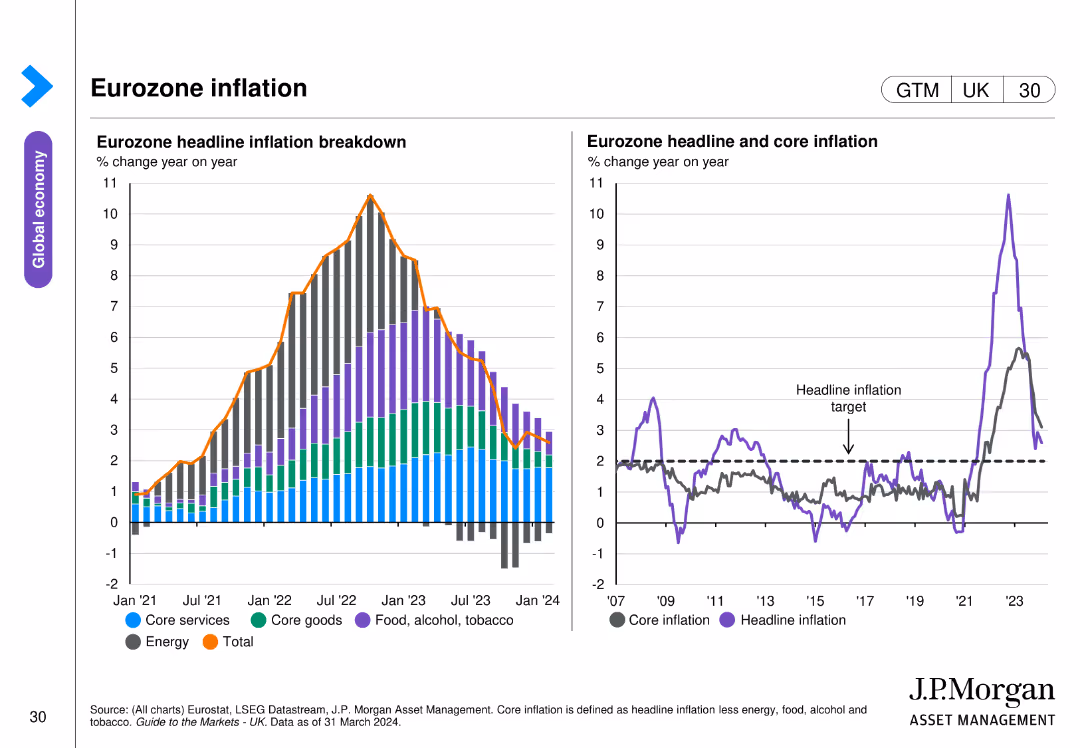
The slide features two column charts. The left chart shows a breakdown of eurozone headline inflation by different components. The right chart presents headline and core inflation trends. The charts are color-coded and include annotations for clarity.
Market Analysis and Trends
Financial Services
This slide analyzes eurozone inflation trends, breaking down the components of headline inflation and comparing headline and core inflation, important for inflation analysis.
eurozone, inflation, headline inflation, core inflation, economic trends
Multiple Chart
JP Morgan
Saved
Features stacked column charts for pre-tax income, line graphs for the macroeconomic environment, and quantitative data points.
Financial Performance
Financial Services
Describes the growth of pre-tax income across various business units and macroeconomic conditions.
Pre-tax income, economic growth, GDP growth, federal funds rate, business units
Multiple Chart
JP Morgan
Saved
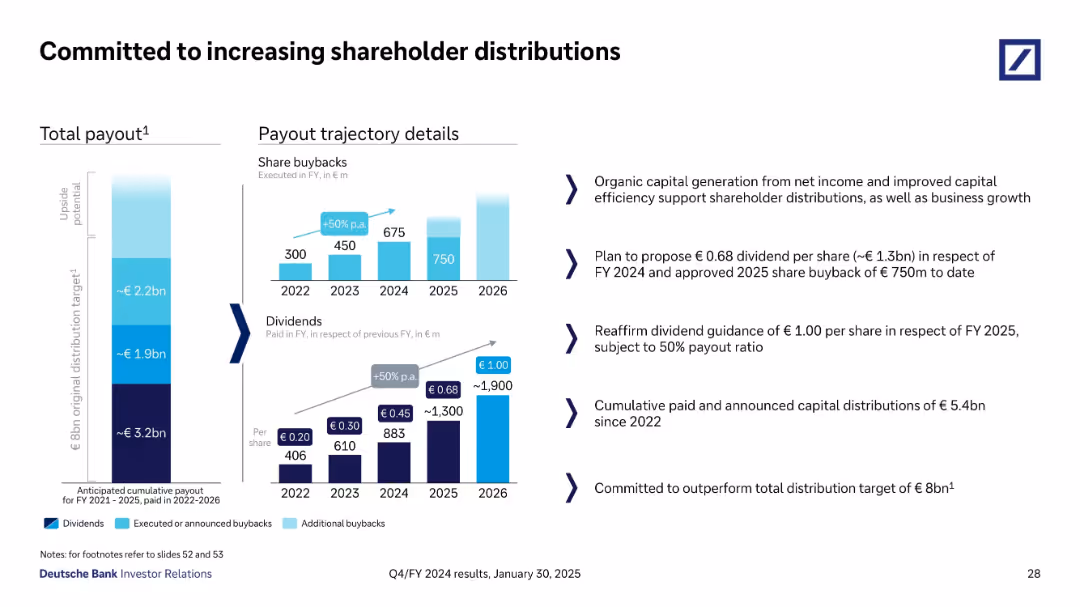
Split layout with vertical payout chart, bar charts of buybacks/dividends, and strategy bullet points
Strategic Planning
Financial Services
This slide outlines Deutsche Bank’s strategy to increase shareholder distributions through dividends and share buybacks. It shows a trajectory aiming for €8bn in distributions from FY 2021–2026, including a proposed €0.68 dividend for FY 2024 and €750m in buybacks for 2025.
Shareholder Return, Dividends, Buybacks, Strategy, FY2024, FY2025
Multiple Chart
Deutsche Bank
Saved
Slide with text descriptions and symbolic icons
Market Analysis and Trends
Retail & E-commerce
Discusses key influences on the 2018 holiday season, highlighting the role of Chinese consumers and the impact of economic factors on global retail.
holiday season, retail, Chinese market, economic factors
Header Vertical
Bain
Saved
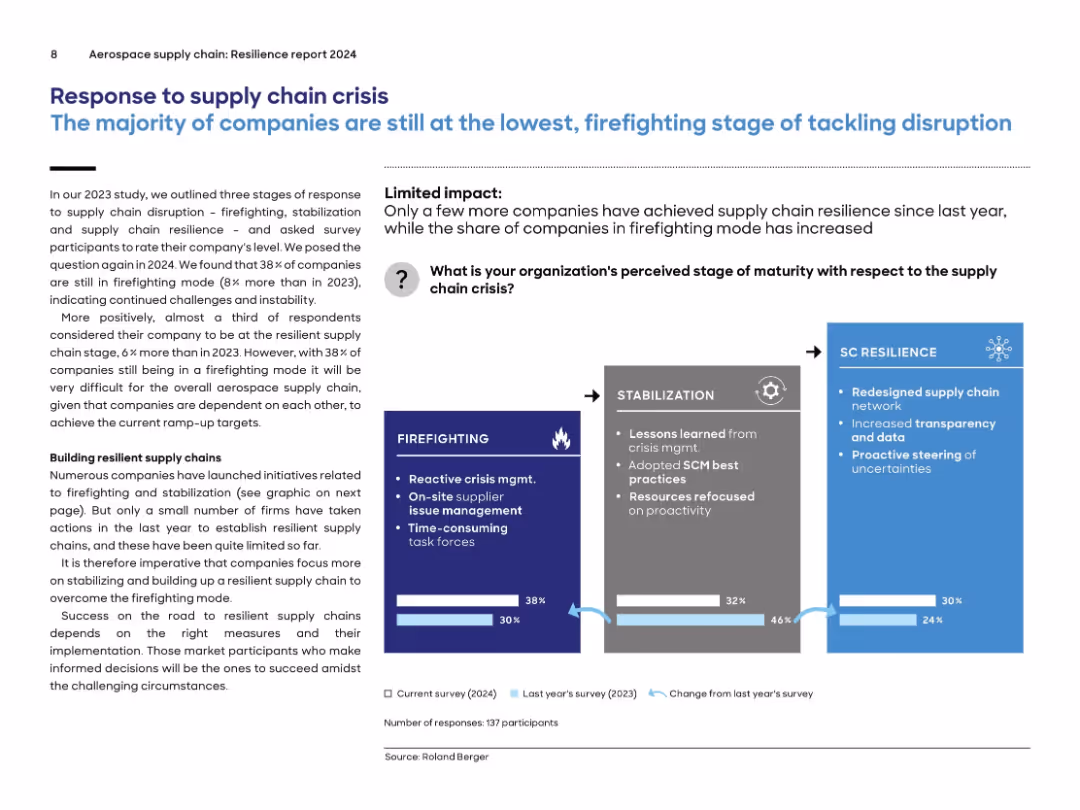
Horizontal 3-stage graphic from “Firefighting” to “SC Resilience”; percentage breakdown shown at the bottom; annotated illustrations explain each stage.
Strategic Planning
Environmental Services & Sustainability
The slide categorizes company responses to supply chain disruption into three maturity stages: Firefighting (38%), Stabilization (32%), and Resilience (30%). Most companies remain in the initial, reactive stage. Although there is improvement over 2023, only a small number have developed proactive supply chain strategies. An arrow-based visual conveys progression across maturity stages.
supply chain, crisis response, maturity, firefighting, stabilization, resilience, aerospace, survey
Mixed Chart
Roland Berger
Saved
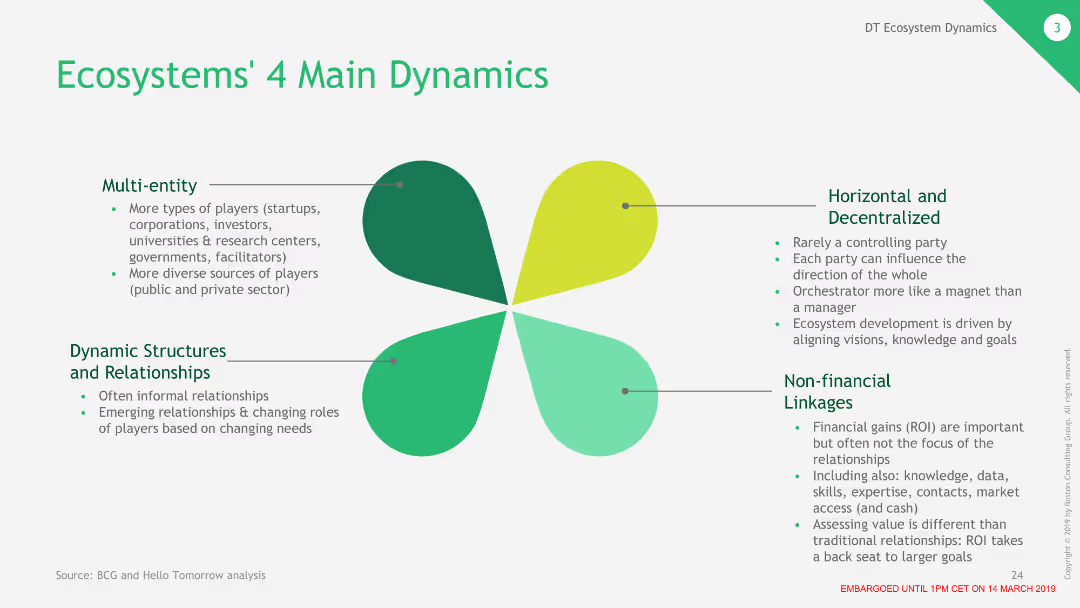
The slide features a four-leaf clover diagram, with each leaf representing one of the main dynamics of ecosystems: multi-entity, horizontal and decentralized, dynamic structures, and non-financial linkages.
Strategic Planning
Technology & Software
This slide outlines the four primary dynamics of ecosystems in deep tech, focusing on the variety of participants, decentralized nature, dynamic relationships, and importance of non-financial connections.
Ecosystems, Dynamics, Participants, Decentralized
Framework
BCG
Saved
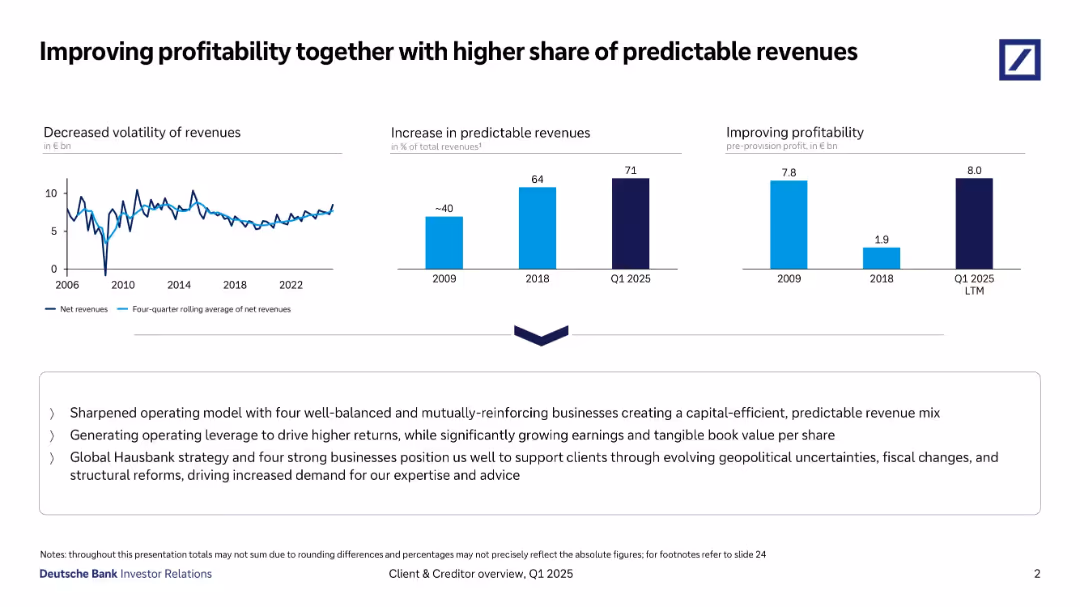
Three-panel horizontal layout showing revenue trends, predictable revenue growth, and profitability, with a strategic summary below.
Strategic Planning
Financial Services
Emphasizes reduced revenue volatility, increased share of predictable revenues (71% by Q1 2025), and strong pre-provision profitability. Highlights strategy with operational leverage, Hausbank positioning, and geopolitical risk management.
Profitability, Predictable Revenues, Strategy, Net Revenues, Hausbank
Multiple Chart
Deutsche Bank
Saved
This slide uses a colorful, icon-driven design to represent various strategic areas such as profitability, portfolio transformation, and corporate responsibility. Each area is highlighted with distinct icons and color blocks, making the information approachable and easy to digest.
Strategic Planning
Agriculture & Food Production
Presents Tyson's multi-faceted strategic approach in a visually engaging manner. It outlines core areas of focus including profitability, product portfolio, and corporate responsibility, aiming to communicate the company's long-term objectives and commitments to stakeholders in a clear and memorable way.
Strategy, Tyson, Profitability, Sustainability, Corporate Responsibility
Pillar
Barclays
Saved
Features a column charts with a key findings section to the left. The chart displays the efforts in recruitment, education, and reskilling due to generative AI's impact. The colors green and teal denote different levels of expertise.
Human Resources and Talent Management
Technology & Software
The slide assesses efforts made by organizations in preparing their workforce for the advent of generative AI. It emphasizes the proactive steps taken in hiring, educating, and reskilling employees and compares these efforts with the perceived expertise in generative AI within the organizations.
generative AI, recruitment, education, reskilling, workforce, efforts, expertise, preparation
Mixed Chart
Deloitte
Saved
Slide includes three column charts reflecting sentiments on the impacts of economic reforms by the Macron government, focusing on foreign investment, competitiveness, and economic conditions.
Regulatory and Compliance
Government & Public Sector
Discusses the perceived impact of recent economic reforms under President Macron’s administration, particularly in enhancing France’s attractiveness to investors.
economic reforms, Macron, France, investment, government
Mixed Chart
Bain
Saved
Previous
Next
If nothing, comes up, please save your slides first
Create a FREE account to continue browsing
Receive Instant Access to 1,000+ slides from companies like McKinsey, Google, and Goldman Sachs
First Name
Last Name
Email
Password
I agree to all
Terms & Privacy Policy
Thank you! Your submission has been received!
Oops! Something went wrong while submitting the form.
Have an account?
Sign in
Column Chart
Heatmap
Chevron
Org Chart
Infographic
Callouts
Timeline
List
Graphic
Picture
Process Flow
Diagram
Paragraph
Map
Table
Framework
Subtitle
Takeaway Box
Icon
Other Chart
Radar Chart
Waterfall Chart
Mekko Chart
Pie Chart
Scatter Plot
Line Chart
Bar chart
Bullet points