My Account
My Slides
Search by Category
Templates
Leave Feedback
Login
Logout
Get Started
Browse all Slides
Browse all Slides
Create a FREE Account
Instant access to 1,000+ real slides from top companies like McKinsey, BCG, Goldman Sachs, Google and many more!
First Name
Last Name
Email
Password
I agree to all
Terms & Privacy Policy
Thank you! Your submission has been received!
Oops! Something went wrong while submitting the form.
Have an account?
Sign in
Saved Slides
Contains bar charts and graphics explaining the future of business travel and its operational changes.
Strategic Planning
Transportation & Logistics
Discusses the evolving nature of business travel, advocating for flexibility and hybrid work models as key factors in future planning.
business travel, hybrid work, operational change, flexibility, travel management, future planning
Vertical Flow
BCG
Saved
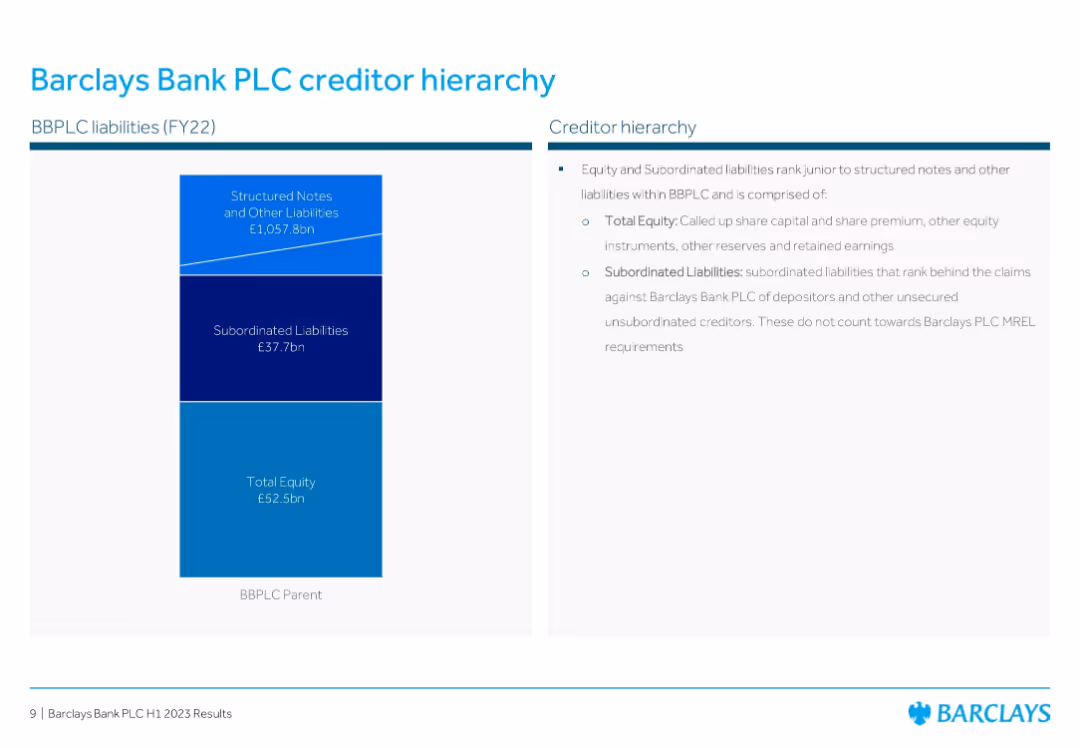
Stacked chart with equity and liability breakdown + bullet points explanation
Corporate Finance and Valuation
Financial Services
Illustrates the creditor hierarchy of Barclays Bank PLC for FY22. Details how structured notes, subordinated liabilities, and total equity are structured and ranked in terms of claims in the creditor stack.
Creditor Hierarchy, Subordinated Liabilities, Equity, Barclays, FY22, Capital Structure, Risk Ranking
Mixed Chart
Barclays
Saved
The slide features three sets of bar charts comparing LCOH reductions under different power control scenarios (positive, negative, combined). Each set shows cost comparisons for grid-only and with power control.
Risk Assessment and Management
Energy & Utilities
This slide examines how grid servicing by electrolyzers can significantly reduce the Levelized Cost of Hydrogen (LCOH). It presents various scenarios and quantifies potential cost savings through effective power control management.
LCOH, grid servicing, electrolyzers, power control, cost reduction
Multiple Chart
Kearney
Saved
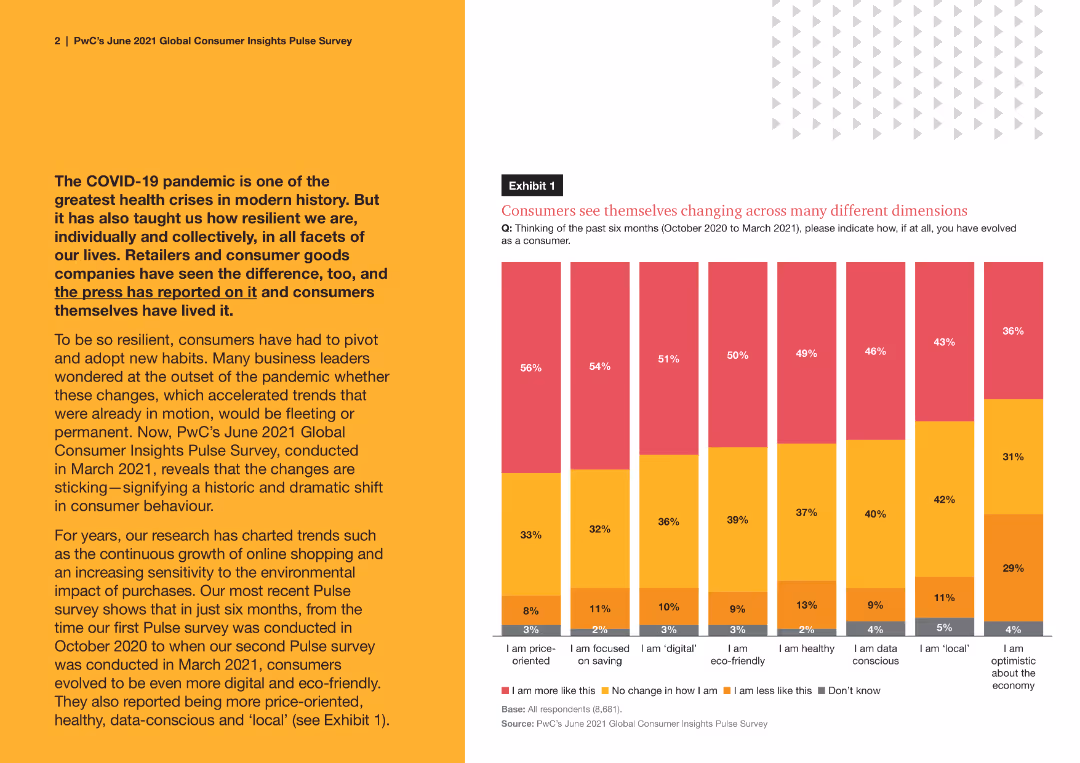
Column charts showing the trend in perceived importance of marketing within companies from June 2020 to September 2022. Includes percentages for 'Increased in Importance,' 'Decreased in Importance,' and 'No Change.'
Customer and Market Segmentation
Professional Services
This slide tracks changes in the perceived importance of marketing roles within companies over several survey points. It shows a general increase in importance but notes a slowing growth rate, indicating a stabilization in marketers' roles within business structures.
Marketing, Trend Analysis, Column Chart, 2020-2022, Business Roles, Survey Data, Growth Rate
Single Chart
Deloitte
Saved
Three segmented boxes describing different blockchain ecosystems: DCEP RMB payment system, private domestic blockchains, and global trade connectivity. Each segment includes key players and functionalities.
Technology and Digital Transformation
Technology & Software
Outlines three major blockchain ecosystems in China: DCEP payment system for digital transactions, private domestic blockchains for B2B transactions, and global trade connectivity.
Blockchain, ecosystems, China, DCEP, RMB payment system, private blockchains, global trade, connectivity, B2B transactions, digital payments
Table
EY
Saved
Slide with a column chart showing underlying total revenues for 4Q23, with annotations explaining changes and key figures.
Financial Performance
Financial Services
The slide presents UBS's underlying total revenues for 4Q23, noting a 3% decrease quarter-on-quarter, with detailed revenue components.
total revenues, quarterly performance, revenue components, UBS financial results
Mixed Chart
UBS
Saved
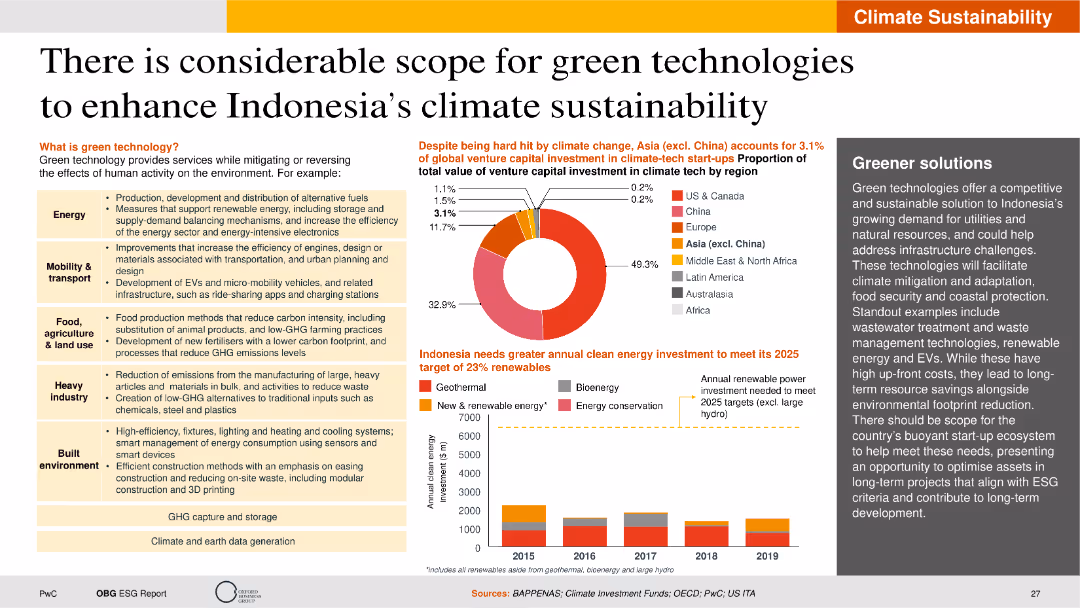
The slide is visually detailed with pie charts, bar charts, and text boxes. It highlights the scope of green technologies in various sectors, including energy, transportation, and agriculture.
Technology and Digital Transformation
Technology & Software
The slide explores the potential of green technologies to improve Indonesia's climate sustainability. It covers various sectors such as energy, mobility, agriculture, and the built environment, highlighting the benefits of green technologies in mitigating environmental impacts. The slide also presents data on venture capital investments in climate tech and the necessary investments for Indonesia to meet its renewable energy targets by 2025.
Green technology, climate sustainability, venture capital, renewable energy, mitigation
Multiple Chart
PwC/Strategy&
Saved
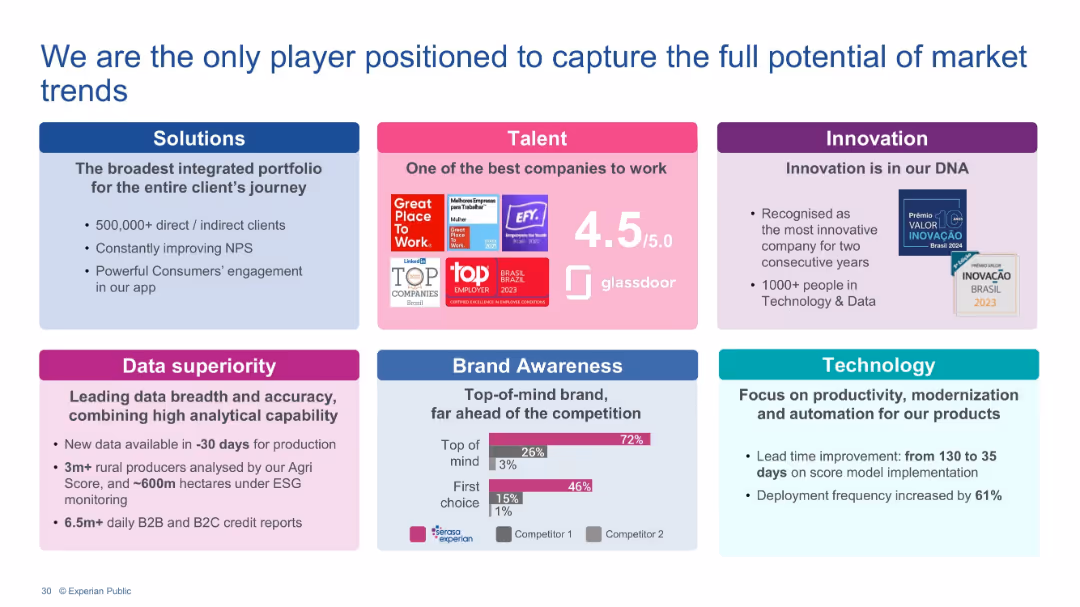
Grid layout with six colored boxes covering Solutions, Talent, Innovation, Data Superiority, Brand Awareness, and Technology. Each includes text, icons, and/or charts.
Strategic Planning
Technology & Software
This slide showcases Experian's strategic assets and competitive advantages including broad solutions portfolio, talented workforce, recognized innovation, data capabilities, strong brand awareness, and advanced technology practices. It builds the case for Experian’s unique ability to capture evolving market opportunities.
Brand strength, Talent, Innovation, Data accuracy, Technology, Market leadership, NPS, Client engagement
Mixed Chart
Barclays
Saved
The slide presents bar graphs with deal values and numbers, using shades of blue for differentiation and clarity in data presentation.
Investment Analysis
Financial Services
The slide compares the deal values and number of deals in Thailand, suggesting a trend towards another record year in 2021.
Deals, Thailand, 2021, Record, Values, Investments, Analysis, Financial
Single Chart
Bain
Saved
Circle charts with net positive/negative financial statuses compared across SEA countries.
Market Analysis and Trends
Financial Services
The slide compares the financial status of respondents to a year ago, indicating a general decrease in financial wellbeing.
financial status, SEA, comparison, circle chart, survey
Multiple Chart
IPSOS
Saved
This slide includes a structured table listing the 15 biggest token offerings since 2016, highlighting key data points like amount raised and industry focus. It uses a clean layout with alternating row colors for readability.
Investment Analysis
Financial Services
Provides a detailed list of the largest token offerings by funds raised, focusing on their end dates, industry categorization, and geographical details. It highlights major players like EOS, Telegram, and Kinesis, indicating significant activity in the blockchain and fintech sectors.
token offerings, blockchain, fintech, 2019, investments, fundraising, global
Mixed Chart
PwC/Strategy&
Saved
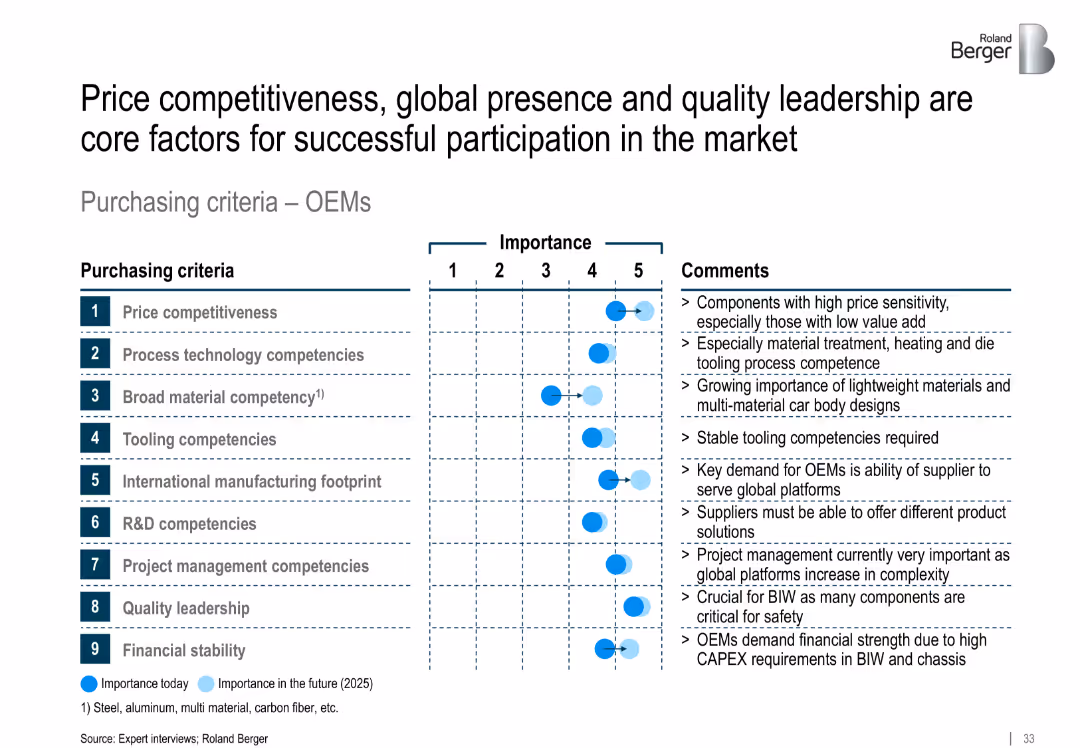
Grid matrix showing importance of nine purchasing criteria (e.g., price, tooling) ranked 1–5 with present and future indicators. Comments appear alongside.
Strategic Planning
Industrial & Manufacturing
This slide outlines what OEMs value in suppliers: price competitiveness, tooling, and global presence are ranked highest. It highlights the growing need for advanced R&D and material capabilities.
OEM criteria, purchasing, pricing, tooling, global footprint, competitiveness, Roland Berger
Mixed Chart
Roland Berger
Saved
This slide features a simple color-coded design to showcase digital imperative achievements by different countries. Each country is represented with a flag, followed by bullet points outlining key initiatives and progress in digital infrastructure, talent, and other areas. There are no complex graphics, just organized, concise text descriptions.
Industry Overview
Technology & Software
It outlines key digital strategy achievements of various countries, like Thailand's network strategy and Estonia's e-governance. Each section lists specific initiatives, reflecting on how these countries are advancing their digital infrastructures and capabilities, investing in talent, and integrating ICT into education systems to keep pace with global technological imperatives.
Digital Strategy, Global, Thailand, Australia, Estonia, Malaysia, Singapore, South Korea, ICT, Education, Infrastructure, Talent
Header Vertical
Kearney
Saved
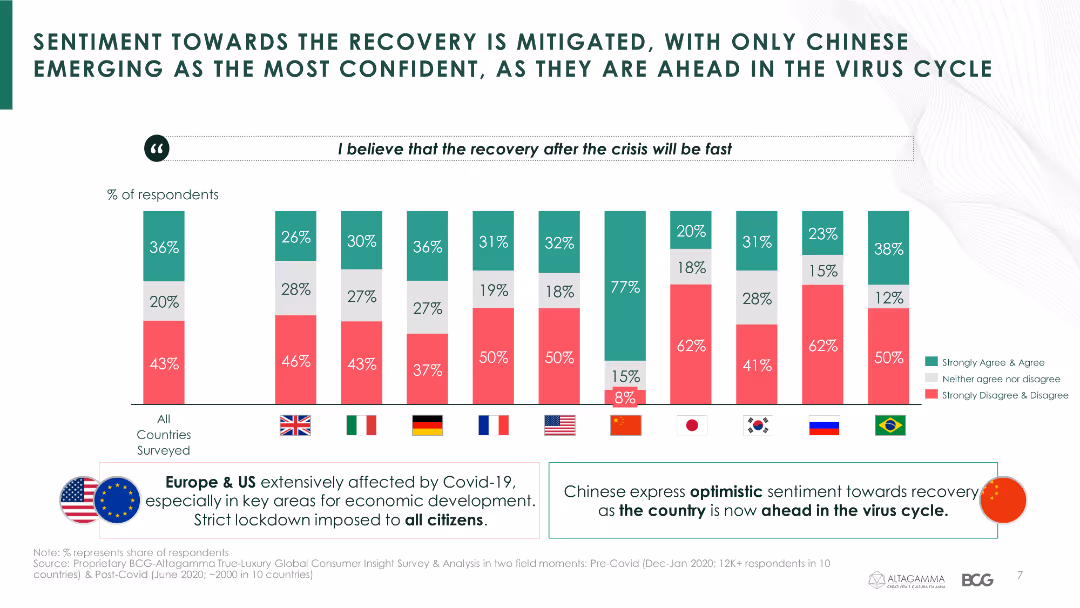
The slide contains a column chart comparing sentiment towards recovery after the crisis across different countries, with a focus on Chinese confidence levels.
Market Analysis and Trends
Consumer Goods
It discusses the differing levels of confidence in economic recovery among luxury consumers in various countries, emphasizing China's optimistic outlook.
sentiment, recovery, confidence, luxury consumers, economic impact, COVID-19, country comparison
Mixed Chart
BCG
Saved
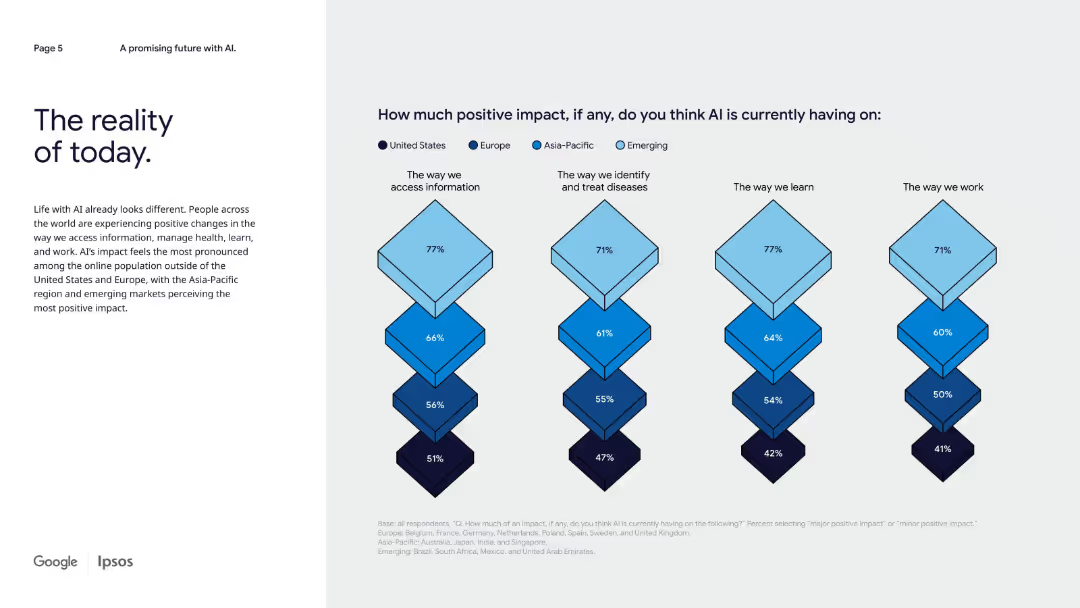
Left-aligned narrative text with right side diamond charts comparing AI’s positive impact across four domains by region.
Strategic Planning
Artificial Intelligence
This slide presents survey results on perceived positive AI impact globally, emphasizing that emerging and Asia-Pacific markets see more benefits across information access, healthcare, learning, and work compared to the U.S. and Europe.
AI today, regional comparison, impact by domain, emerging markets, health, learning, information access
Mixed Chart
IPSOS
Saved
The slide has a column chart comparing the number of companies by market capitalization ranges. The design is clear with well-defined data segments.
Market Analysis and Trends
Financial Services
This slide details the distribution of companies within the Global Top 100 based on market capitalization ranges, comparing data from March 2020 to March 2021.
market capitalization, company distribution, financial analysis, 2020-2021, comparative data
Mixed Chart
PwC/Strategy&
Saved
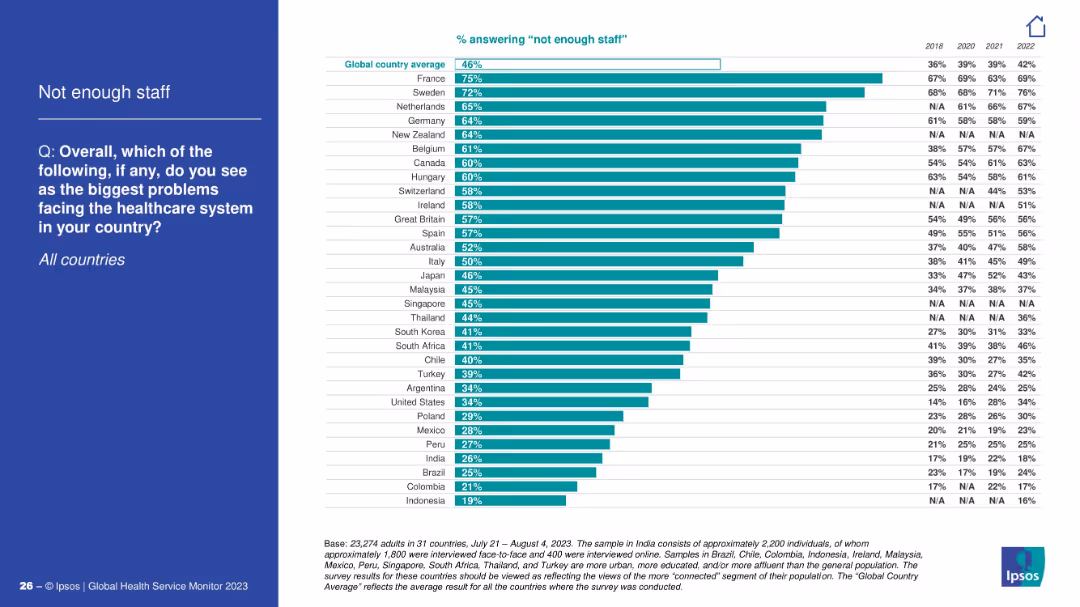
Bar chart with countries on y-axis and percentage on x-axis; left blue panel includes survey question and topic.
Performance Metrics and KPIs
Healthcare & Pharmaceuticals
This slide highlights country-level responses regarding staffing shortages in healthcare. France, Sweden, and the Netherlands top the list, with global average at 46%. A historical comparison from 2018–2022 is included.
staffing, global comparison, shortages, healthcare
Mixed Chart
IPSOS
Saved
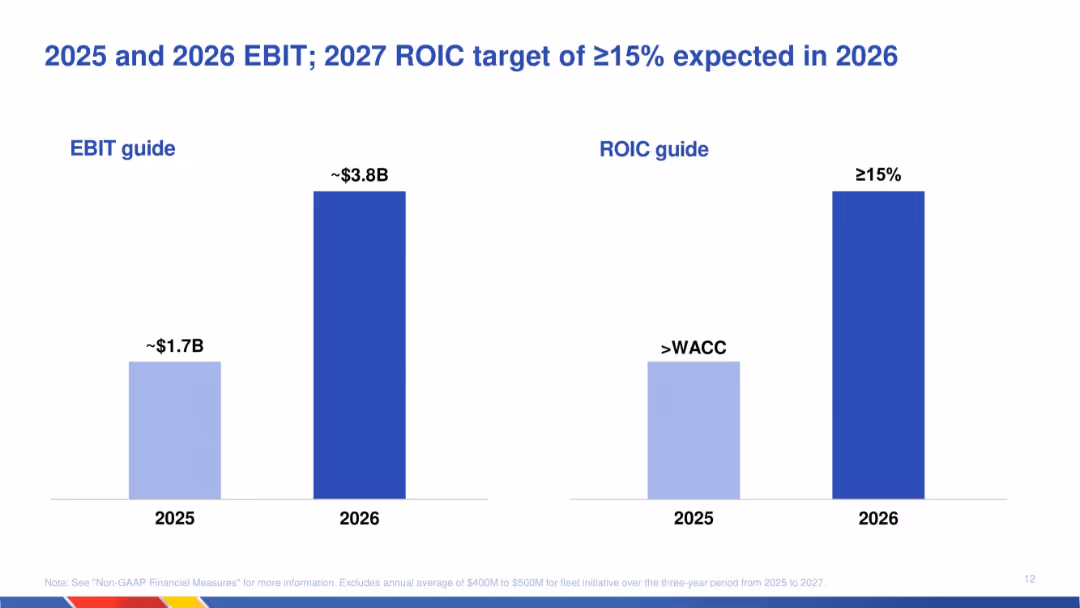
Side-by-side bar charts for EBIT and ROIC guidance across 2025 and 2026; simple format with emphasis on meeting and exceeding financial benchmarks.
Financial Performance
Transportation & Logistics
Provides financial projections indicating that EBIT is expected to more than double from 2025 to 2026, while the return on invested capital (ROIC) is projected to exceed 15% by 2026. Indicates confidence in strategic initiatives.
EBIT, ROIC, projections, financial targets, 2025, 2026, strategic outcomes, transportation, value creation
Single Chart
JP Morgan
Saved
The slide features a table comparing various fuel cell technologies. The table includes parameters like temperature, stack size, electrical performance, applications, advantages, and challenges.
Technology and Digital Transformation
Energy & Utilities
The slide compares different types of fuel cells, highlighting the potential of Polymer Electrolyte Membrane (PEM) technology in terms of efficiency, application range, and improvement potential.
Fuel cells, PEM, efficiency, comparison, advantages, challenges, technology, applications, temperature, performance
Table
Kearney
Saved
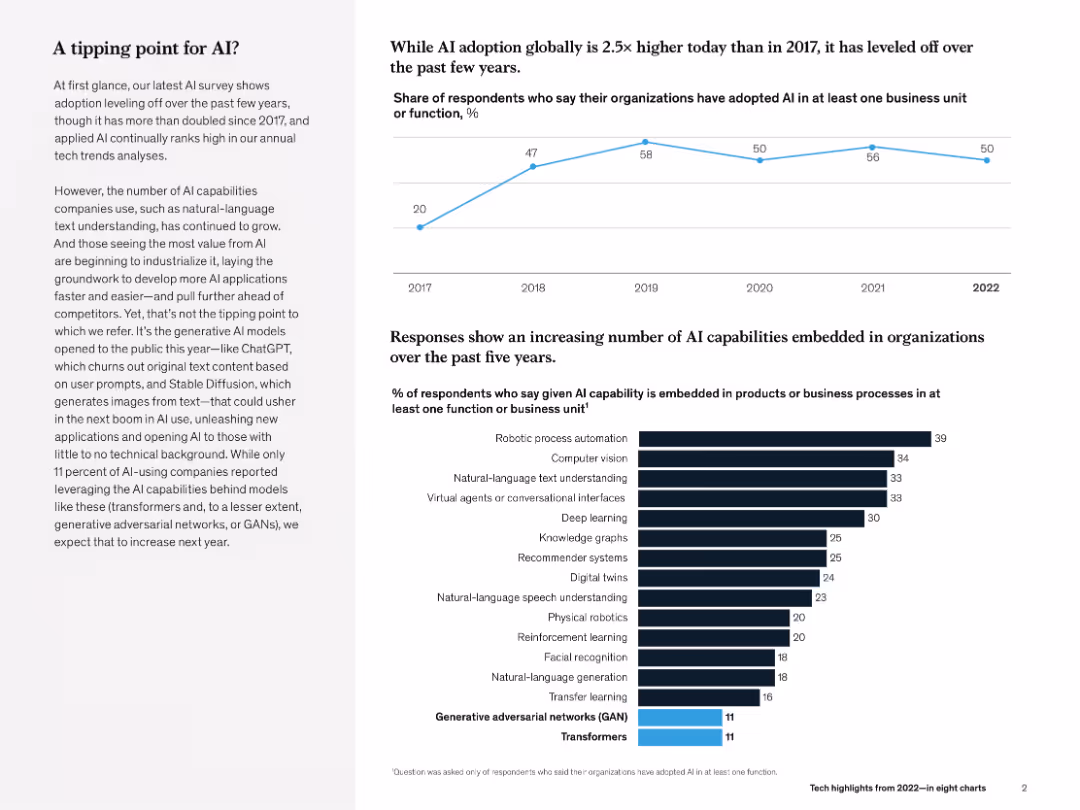
Line chart (top) and bar chart (bottom). Left-aligned text explains key insight. Minimalist black-and-blue theme.
Technology and Digital Transformation
Artificial Intelligence
The slide evaluates AI adoption trends (flatlining at ~50% post-2018) and shows growing diversity in AI use cases (e.g., robotic process automation, NLP). Emphasis is placed on emerging generative AI models like GANs and transformers.
AI adoption, transformers, GANs, NLP, robotic automation, McKinsey, business unit, survey
Multiple Chart
McKinsey
Saved
The slide features a line chart showing the carbon price in USD per ton over time (1990-2020) for various countries, with a legend on the left side listing the different carbon taxes and ETS initiatives tracked.
Regulatory and Compliance
Energy & Utilities
This slide shows the historical carbon price trends in Nordic countries and other regions, highlighting Sweden as having the highest carbon tax. It provides comparative data for different carbon pricing mechanisms over time.
carbon price, Nordic countries, Sweden, ETS, tax
Single Chart
Kearney
Saved
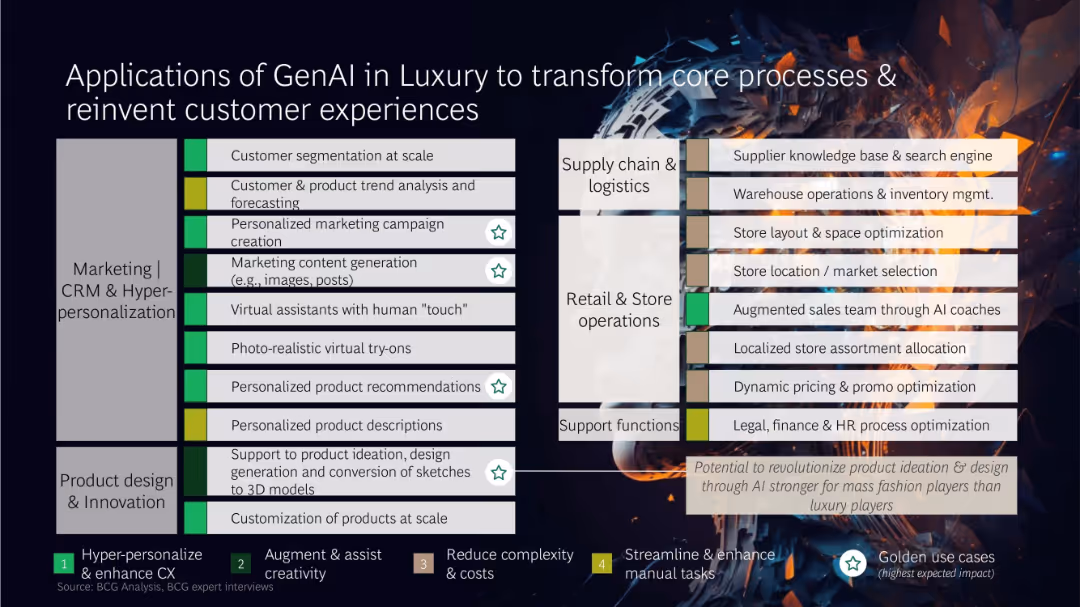
Matrix layout categorizing GenAI use cases across business functions, with color-coded impact labels and icons
Technology and Digital Transformation
Artificial Intelligence
This slide presents a comprehensive matrix of GenAI applications across marketing, product design, retail operations, supply chain, and support functions. High-impact use cases include dynamic pricing, AI-assisted sales, and virtual try-ons, transforming both front-end and back-end operations.
GenAI, luxury, CRM, product design, automation, customer experience, AI use cases
Table
BCG
Saved
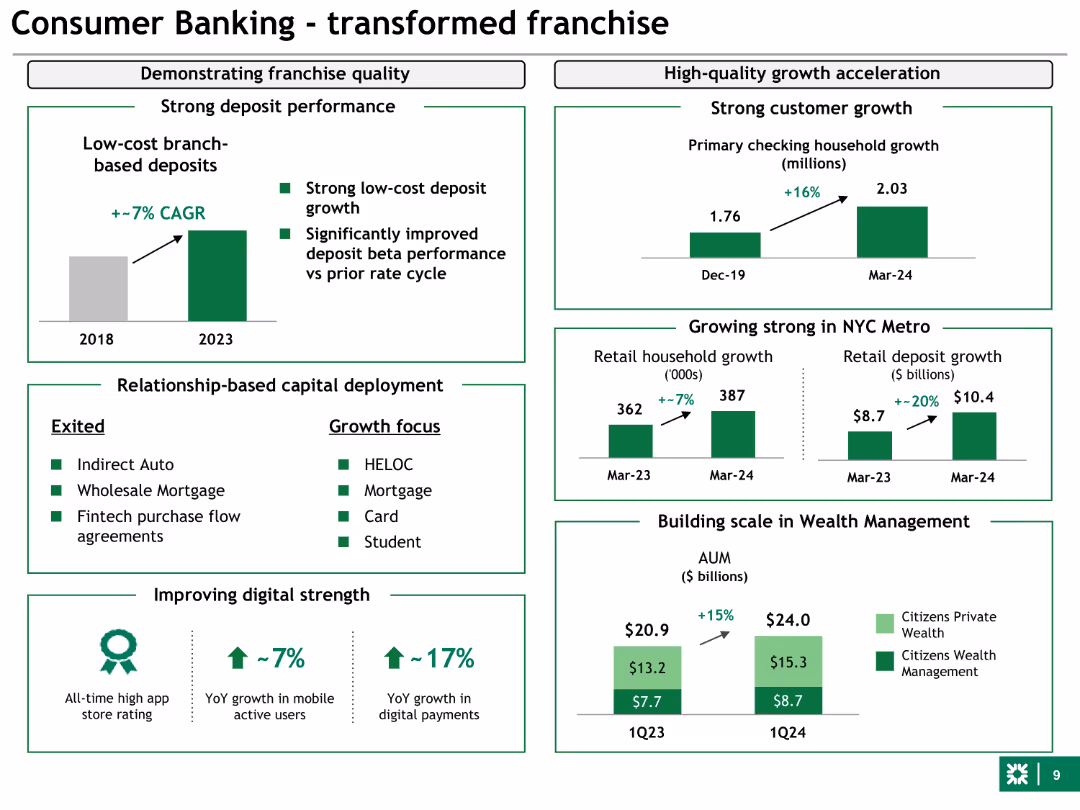
Combination of bar charts, bullet points, and icons. Highlights strong deposit performance, customer growth, and digital strength with green for emphasis.
Strategic Planning
Financial Services
This slide outlines the transformation in consumer banking, showing growth in deposits, customer numbers, and digital engagement. It details exited and growth focus areas.
consumer banking, transformation, growth, digital, deposits
Multiple Chart
Barclays
Saved
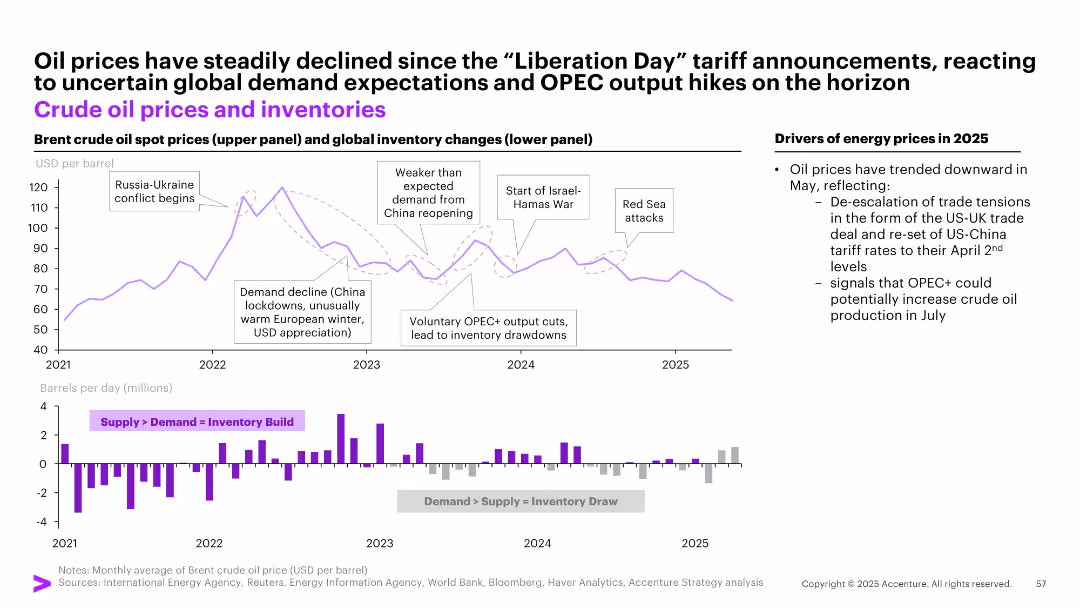
Two-panel chart: top showing Brent crude oil spot prices, bottom showing global inventory changes (bar graph), annotated with key events.
Market Analysis and Trends
Energy & Utilities
Explains price volatility in crude oil markets from 2021–2025, attributing changes to OPEC+ output adjustments, demand fluctuations, and geopolitical factors like Russia-Ukraine and Israel-Hamas conflicts. Oil prices fell post-tariff announcements amid easing tensions.
oil prices, OPEC+, inventory, Russia, demand, tariff, energy markets, supply shock, war, crude
Multiple Chart
Accenture
Saved
This slide presents a growth trend using a column chart to illustrate EPS growth from FY12 to FY17, with a projection for FY17. The chart uses shades of blue to differentiate the years, accompanied by a rising arrow indicating growth over time. The design is simple yet effective, focusing on financial data.
Financial Performance
Consumer Goods
The slide discusses Tyson's EPS growth over a five-year period, projecting future earnings. It emphasizes the company’s consistent financial growth and strategic financial planning, aiming to inform investors and stakeholders about its financial health and future earnings potential.
EPS, Growth, Financial, Projection, Tyson, Analysis
Single Chart
Barclays
Saved
Previous
Next
If nothing, comes up, please save your slides first
Create a FREE account to continue browsing
Receive Instant Access to 1,000+ slides from companies like McKinsey, Google, and Goldman Sachs
First Name
Last Name
Email
Password
I agree to all
Terms & Privacy Policy
Thank you! Your submission has been received!
Oops! Something went wrong while submitting the form.
Have an account?
Sign in
Column Chart
Heatmap
Chevron
Org Chart
Infographic
Callouts
Timeline
List
Graphic
Picture
Process Flow
Diagram
Paragraph
Map
Table
Framework
Subtitle
Takeaway Box
Icon
Other Chart
Radar Chart
Waterfall Chart
Mekko Chart
Pie Chart
Scatter Plot
Line Chart
Bar chart
Bullet points