My Account
My Slides
Search by Category
Templates
Leave Feedback
Login
Logout
Get Started
Browse all Slides
Browse all Slides
Create a FREE Account
Instant access to 1,000+ real slides from top companies like McKinsey, BCG, Goldman Sachs, Google and many more!
First Name
Last Name
Email
Password
I agree to all
Terms & Privacy Policy
Thank you! Your submission has been received!
Oops! Something went wrong while submitting the form.
Have an account?
Sign in
Saved Slides
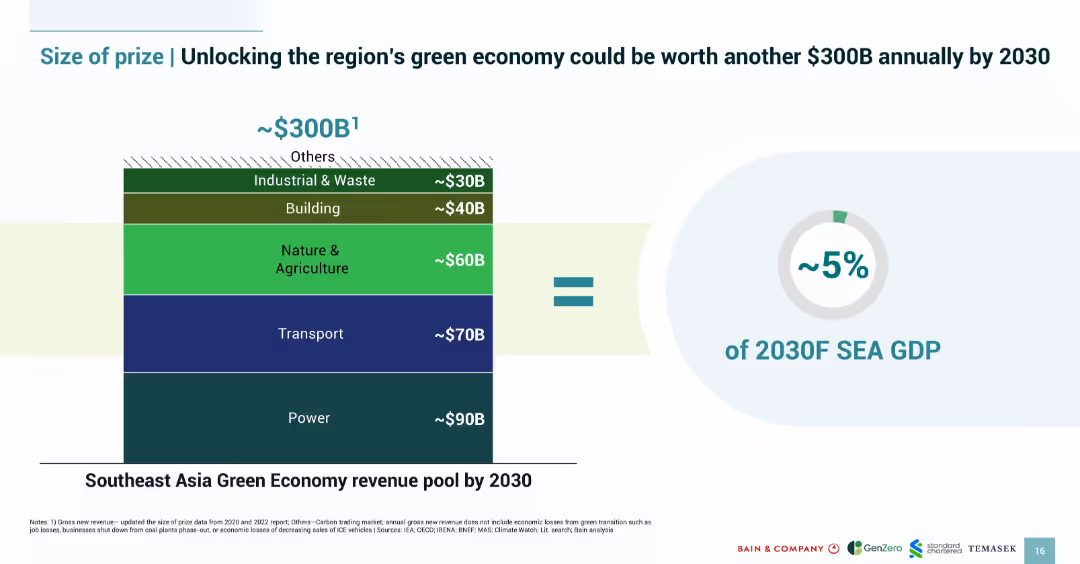
Vertical stacked bar chart with sectoral revenue pools on left, large equal sign, and GDP percentage metric on right; green color palette.
Investment Analysis
Environmental Services & Sustainability
Estimates ~$300B in annual revenue potential from Southeast Asia's green economy by 2030, equal to ~5% of projected SEA GDP. Breaks down potential across sectors like power, transport, agriculture, and buildings.
green economy, revenue pool, SEA, investment, GDP, sustainability, sectors
Multiple Chart
Bain
Saved
Table and bar chart comparing staff counts per 100,000 residents across states. Text explains findings. Dense with detailed information.
Operational Efficiency
Healthcare & Pharmaceuticals
Benchmarking NH DHHS staffing levels compared to other states, suggesting that NH is not overstaffed relative to total population served.
Staffing, Benchmarking, DHHS, Residents, Comparison
Mixed Chart
Alvarez & Marsal
Saved
The slide is segmented into different sections with icons representing various end-markets, activities, and growth drivers. It provides insights into market growth prospects through 2022-2027 for different segments within the engineered fabrics and films industry.
Market Analysis and Trends
Industrial & Manufacturing
Analyzing the potential for market growth in various sectors related to engineered fabrics and films, this slide indicates where high-growth opportunities exist, guiding strategic planning for companies in these markets. It's tailored for executives and strategists focused on expanding their market reach.
market growth, end-markets, strategic planning, growth drivers
Table
Morgan Stanley
Saved
The slide features two line charts. The left chart shows the share of GDP by sector (manufacturing, services, agriculture) from 1983 to 2023. The right chart shows total exports and imports as a percentage of GDP from 1983 to 2023.
Market Analysis and Trends
Financial Services
This slide examines China's economic transition, highlighting the changes in GDP composition by sector and trends in exports and imports over the last four decades. It illustrates the shift from manufacturing to services and the dynamics of trade.
China, economic transition, GDP, sector, exports, imports, manufacturing, services, agriculture, line chart
Multiple Chart
JP Morgan
Saved
The slide displays a column chart on the right side showing different stablecoins held by users, and the left side includes categories with percentage bars for each crypto asset type. Layout is moderately complex.
Market Analysis and Trends
Financial Services
This slide lists the most commonly held stablecoins, highlighting Tether (USDT), Binance USD (BUSD), and USD Coin (USDC) as the top three. It aims to provide insights into popular stablecoin choices among investors.
stablecoins, crypto, assets, types, popular
Multiple Chart
IPSOS
Saved
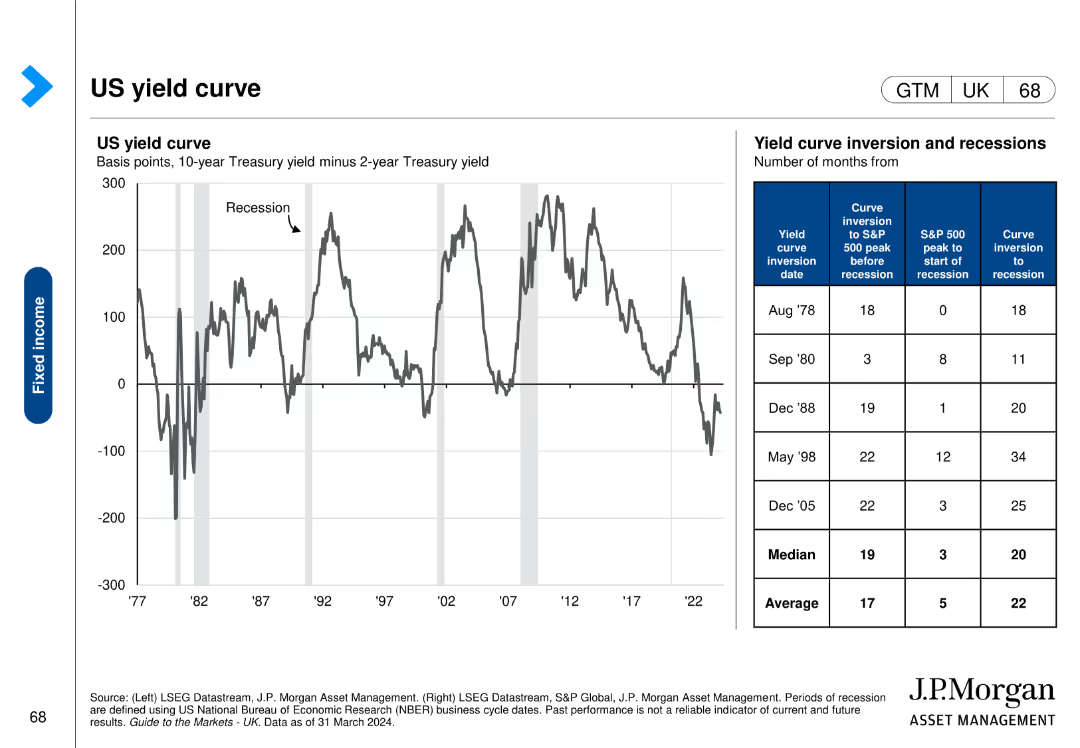
This slide includes a line chart showing the US yield curve over time and a table detailing yield curve inversion dates and subsequent economic events.
Risk Assessment and Management
Financial Services
The slide analyzes the US yield curve and its inversions, providing insights into economic risks and the timing of recessions, useful for risk management.
US, yield curve, inversion, recessions, economic events, risk assessment, management
Mixed Chart
JP Morgan
Saved
Exhibit 2 displays a table categorizing technology trends and their relevance across multiple industries with color-coded relevance.
Industry Overview
Technology & Software
This table slide exhibits the relevance of various technology trends across different industry sectors.
Industries, Technology, Trends, Relevance, Silicon Age, Engineering Tomorrow
Single Chart
McKinsey
Saved
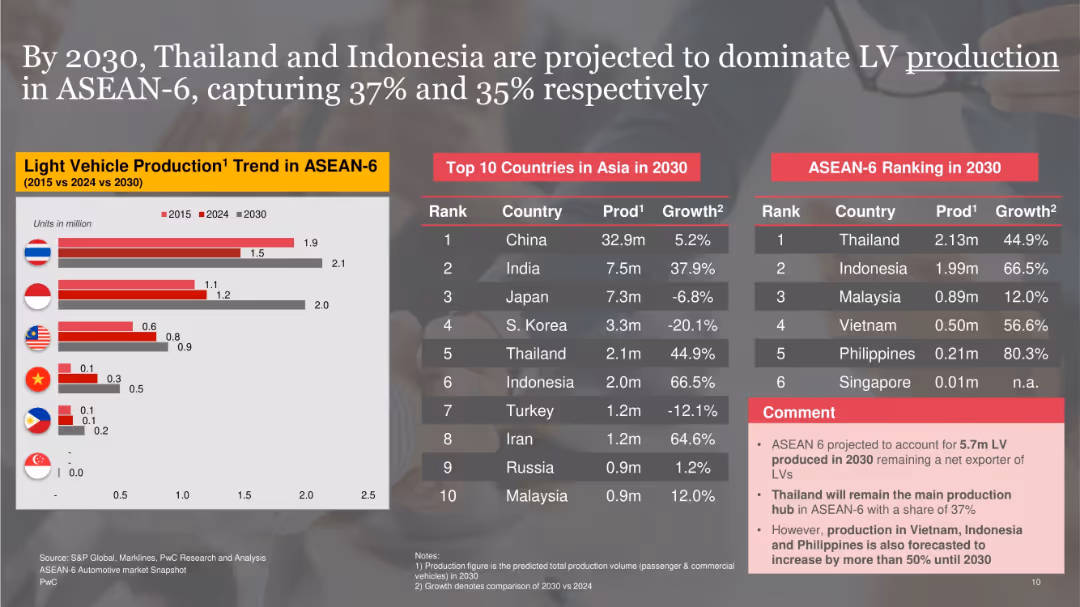
Left bar chart shows production trends in ASEAN-6 (2015, 2024, 2030); right side features Asia’s top 10 producers and ASEAN-6 rankings in 2030.
Strategic Planning
Industrial & Manufacturing
Shows projections for light vehicle production in ASEAN-6, forecasting Thailand and Indonesia as dominant hubs by 2030. Provides context with broader Asian rankings and growth forecasts. Commentary emphasizes Vietnam, Philippines, and Indonesia's rapid production capacity growth.
vehicle production, ASEAN-6, Thailand, Indonesia, 2030, growth, Asia rankings
Mixed Chart
PwC/Strategy&
Saved
The slide features two line charts showing quarterly revenue and contribution margin trends. Text explains Gartner's research services for executives and their teams.
Industry Overview
Professional Services
It provides an overview of Gartner's research services, highlighting ongoing access to research, on-demand response, and support for major enterprise functions.
Gartner, research, revenue, contribution margin, executives, services, trends
Multiple Chart
Gartner
Saved
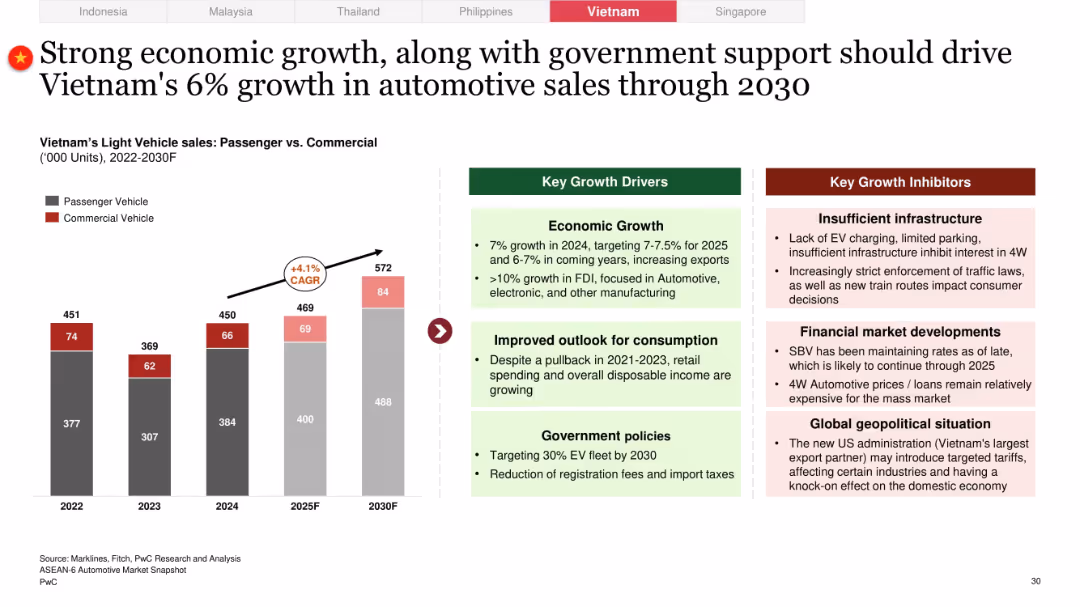
Typical two-part layout with bar graph showing PV/CV sales from 2022 to 2030 and growth/inhibitor boxes on the right
Market Analysis and Trends
Industrial & Manufacturing
Vietnam anticipates steady 6% CAGR in automotive sales, driven by FDI, growing consumption, and policy support. Key inhibitors include weak infrastructure, financing constraints, and global geopolitical risks.
Vietnam, vehicle sales, FDI, consumption outlook, infrastructure gaps, auto lending, CAGR forecast
Mixed Chart
PwC/Strategy&
Saved
This slide uses two bar charts to show market cap values in 2010 versus 2019 for companies in the US and China, with a percentage of tech companies noted.
Competitive Landscape
Technology & Software
Analyzing the shift in market capitalization among top companies in the US and China from 2010 to 2019, the slide indicates a significant increase in the proportion of tech companies.
market cap, tech companies, US, China, 2010 vs 2019
Multiple Chart
McKinsey
Saved
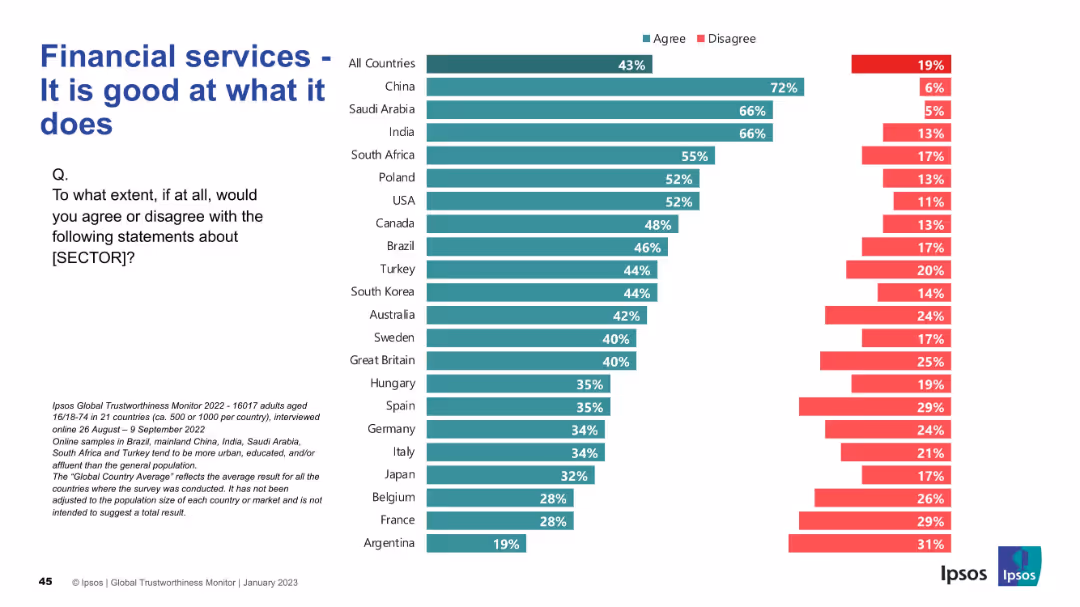
Bar chart split by "Agree" and "Disagree" responses by country; simple layout with clean segmentation
Strategic Planning
Financial Services
This slide presents a global perception of the financial services sector’s competence. China, India, and Saudi Arabia have high agreement (66–72%), indicating strong regional trust. The average global agreement is 43%.
financial services, competence, trust, international, agreement, Ipsos, bar chart, perception, countries
Mixed Chart
IPSOS
Saved
This slide includes a column chart comparing the expected changes in the proportion of acute beds over the next five years by country and hospital type.
Strategic Planning
Healthcare & Pharmaceuticals
This slide predicts an increase in the demand for acute beds in hospitals over the next five years, with detailed analysis by country and hospital type.
acute beds, demand surge, hospital planning, future trends, regional analysis
Multiple Chart
LEK
Saved
Displays column charts showing changes in capital metrics like CET1 ratio and leverage ratio, alongside MREL/TLAC requirements with surplus figures.
Performance Metrics and KPIs
Financial Services
Provides an update on the bank's capital position, detailing changes in capital ratios and requirements, key for regulatory compliance and stability assessment.
Capital, CET1 ratio, leverage, compliance
Multiple Chart
Deutsche Bank
Saved
Features multiple column charts showing how high-growth brands prioritize company purpose across various business aspects.
Strategic Planning
Professional Services
Details how high-growth brands integrate purpose into their operations and decision-making, enhancing corporate strategy.
growth, purpose, brands, strategy, corporate, business, marketing
Mixed Chart
Deloitte
Saved
The slide features text and icons representing different client segments and services offered. Sections provide details on corporate and personal banking.
Strategic Planning
Financial Services
This slide describes UBS's balanced mix of personal and corporate banking, highlighting the client base and services offered.
UBS, Banking, Client Segments, Services, Strategic Planning
Multiple Chart
UBS
Saved
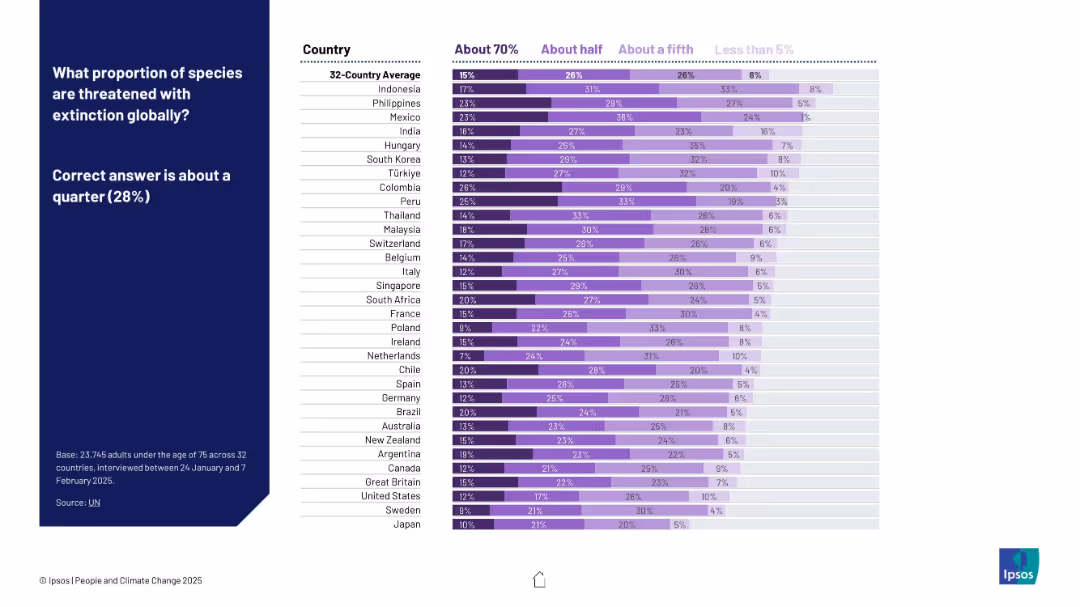
Horizontal bar chart with purple tones indicating varying perceptions by country. Sidebar on the left presents the correct answer and survey question.
Market Analysis and Trends
Environmental Services & Sustainability
This slide examines global public perceptions about how many species are threatened with extinction. Despite the correct figure being 28%, survey results vary significantly across countries, illustrating a common overestimation of biodiversity loss.
extinction, biodiversity, perception, survey, Ipsos, climate, bar chart, countries, awareness, species
Mixed Chart
IPSOS
Saved
Contains bar charts and diagrams explaining asset lifecycle management in energy sectors, including case study of Iberdrola.
Operational Efficiency
Energy & Utilities
Details the importance of asset lifecycle management in the energy industry, using a case study to illustrate effective predictive maintenance.
asset management, lifecycle management, energy industry, predictive maintenance, Iberdrola, operational efficiency
Mixed Chart
Accenture
Saved
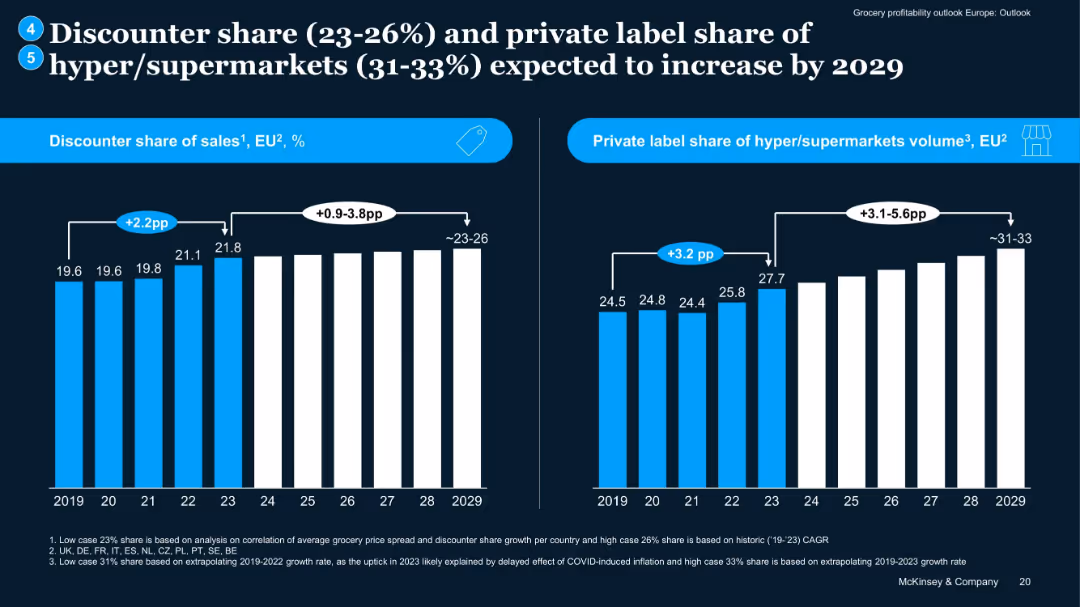
Two bar charts: left for discounter sales share, right for private label volume share, covering 2019–2029.
Market Analysis and Trends
Retail & E-commerce
Projects continued growth in discounter market share and private label volume among hypermarkets. Notes impact of COVID inflation on trend upticks, with forward projections extending to 2029, suggesting increased margin pressure and competition.
discounter growth, private label, projections, grocery trends, EU
Multiple Chart
McKinsey
Saved
Column chart on the right showing DCR challenges in percentages, with two quotes on the left from a VP, Publisher, and Product Lead, Brand.
Risk Assessment and Management
Professional Services
Highlights various challenges faced by DCR users such as leveraging results, data interoperability, and internal resource challenges, displayed in a column chart.
DCR challenges, leveraging results, data interoperability, internal resources, privacy
Mixed Chart
IPSOS
Saved
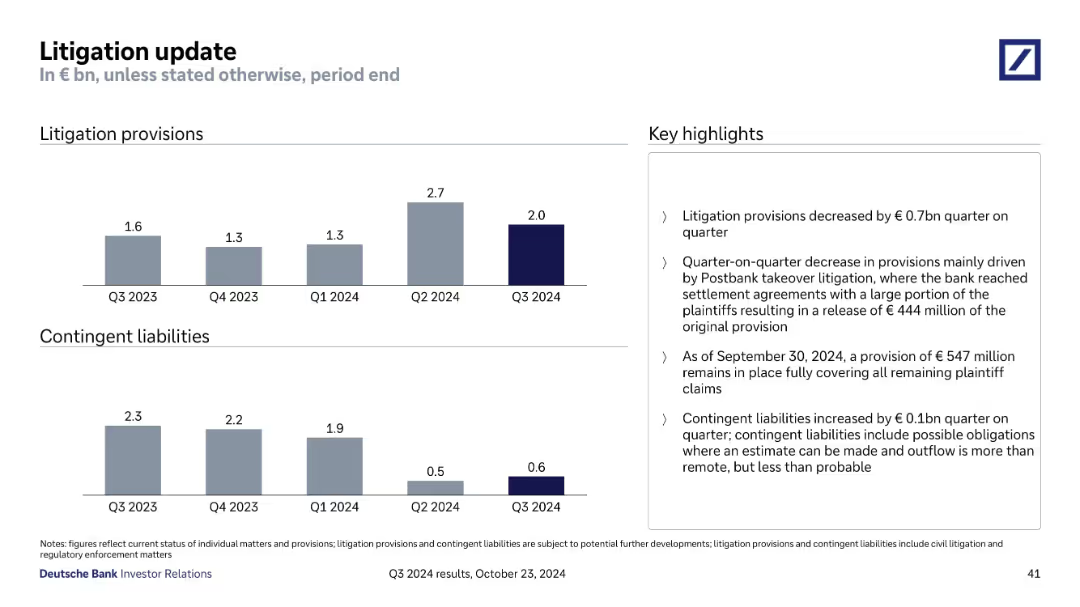
Two bar charts showing litigation provisions and contingent liabilities over time, with highlights explaining changes.
Regulatory and Compliance
Financial Services
Tracks litigation provisions and contingent liabilities from Q3 2023 to Q3 2024. Notes Q2 2024 spike and Q3 reduction driven by Postbank litigation settlement. Indicates €547m provision remains for outstanding claims and slight increase in contingent liabilities.
Litigation, Provisions, Contingent Liabilities, Postbank, Legal Risk
Multiple Chart
Deutsche Bank
Saved
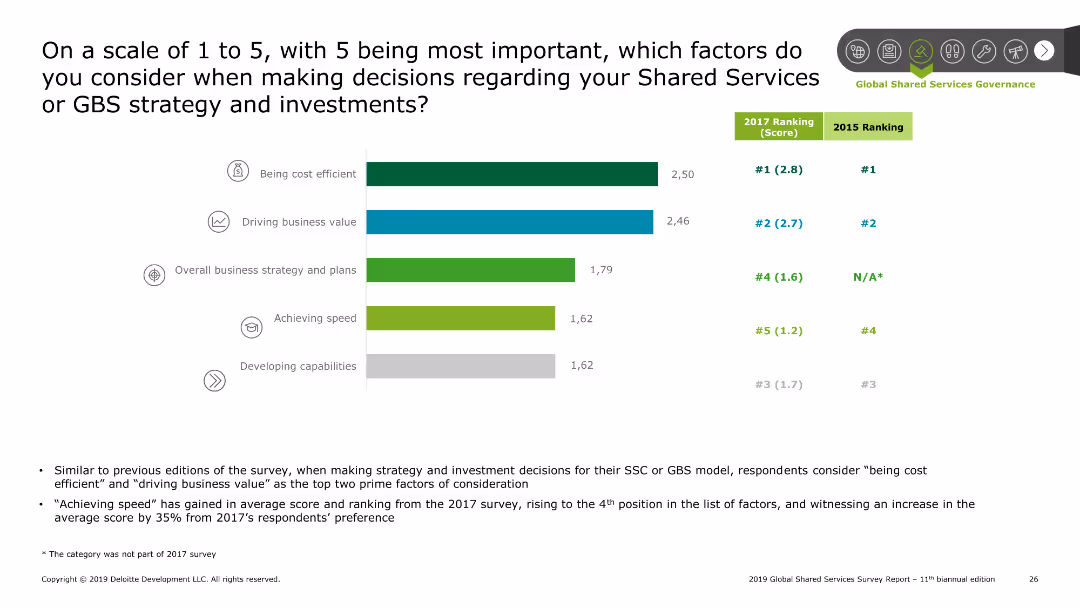
Bar chart ranking factors on a scale of 1 to 5, with being cost efficient and driving business value as top considerations. Comparison with 2017 rankings shown. Summary points on the bottom discuss trends and findings.
Strategic Planning
Professional Services
The slide outlines key factors considered in Shared Services strategy decisions. A bar chart ranks factors such as cost efficiency and business value on a scale of 1 to 5. Comparison with 2017 rankings is included. Summary points discuss the rise in importance of achieving speed and other notable trends.
SSC, strategy, decision factors, cost efficiency, business value
Mixed Chart
Deloitte
Saved
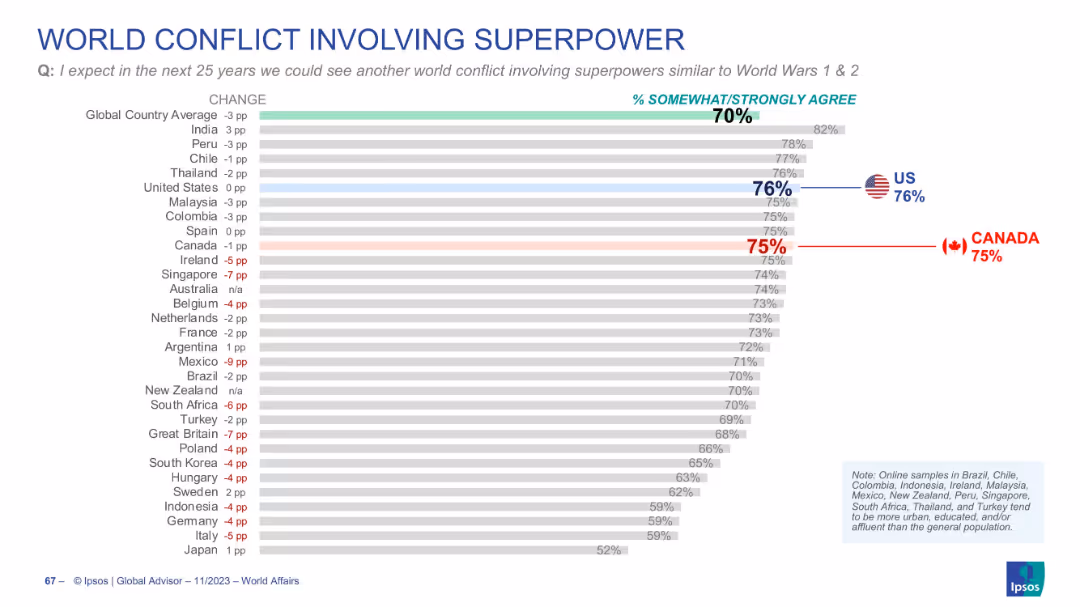
Horizontal bar chart comparing countries’ agreement levels; includes percentage changes; U.S. and Canada highlighted; clean layout with bold headers.
Market Analysis and Trends
Government & Public Sector
This slide presents survey results on the expectation of a future world conflict involving superpowers, similar to WWI/WWII. It shows percentage agreement by country, highlighting that 70% globally agree, with the US and Canada both around 75–76%. Change over time is also displayed.
world conflict, superpowers, global opinion, Canada, US, survey, Ipsos
Single Chart
IPSOS
Saved
Matrix-style bar chart with five national domains across three sentiment categories
Risk Assessment and Management
Government & Public Sector
The slide presents predicted impacts of refugees on labor, culture, economy, public services, and security. While opinions are mixed, concern outweighs optimism, particularly for national security and public services. Around a third anticipate positive impact across domains.
refugee impact, future outlook, national security, public services, Ipsos, labor market, sentiment analysis
Mixed Chart
IPSOS
Saved
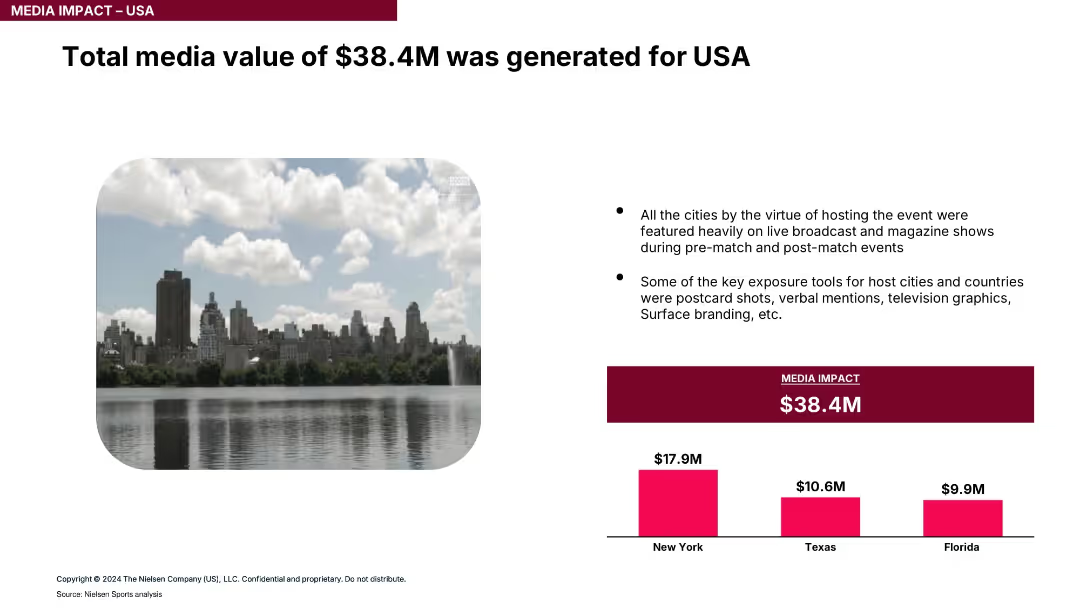
Large image of NYC with bullet points and pink bar chart comparing media value generated by city.
Market Analysis and Trends
Media & Entertainment
The slide estimates total media exposure value from the event at $38.4M, with New York leading, followed by Texas and Florida. It attributes value to TV coverage, branding, and visual content.
media value, exposure, television, branding, event marketing, city coverage, ROI
Mixed Chart
Nielsen
Saved
Previous
Next
If nothing, comes up, please save your slides first
Create a FREE account to continue browsing
Receive Instant Access to 1,000+ slides from companies like McKinsey, Google, and Goldman Sachs
First Name
Last Name
Email
Password
I agree to all
Terms & Privacy Policy
Thank you! Your submission has been received!
Oops! Something went wrong while submitting the form.
Have an account?
Sign in
Column Chart
Heatmap
Chevron
Org Chart
Infographic
Callouts
Timeline
List
Graphic
Picture
Process Flow
Diagram
Paragraph
Map
Table
Framework
Subtitle
Takeaway Box
Icon
Other Chart
Radar Chart
Waterfall Chart
Mekko Chart
Pie Chart
Scatter Plot
Line Chart
Bar chart
Bullet points


![Q. Over the next few years, do you think refugees in [COUNTRY] are likely to have a positive or negative impact on each of the following, or not make much difference to:](https://cdn.prod.website-files.com/654e70fb59937215cac87b19/6899ca56175570c8a9d498eb_lLqwg6qIZuT9PL7tM39BAJqeor7iD6BnjhDGNGIMDOo.avif)