My Account
My Slides
Search by Category
Templates
Leave Feedback
Login
Logout
Get Started
Browse all Slides
Browse all Slides
Create a FREE Account
Instant access to 1,000+ real slides from top companies like McKinsey, BCG, Goldman Sachs, Google and many more!
First Name
Last Name
Email
Password
I agree to all
Terms & Privacy Policy
Thank you! Your submission has been received!
Oops! Something went wrong while submitting the form.
Have an account?
Sign in
Saved Slides
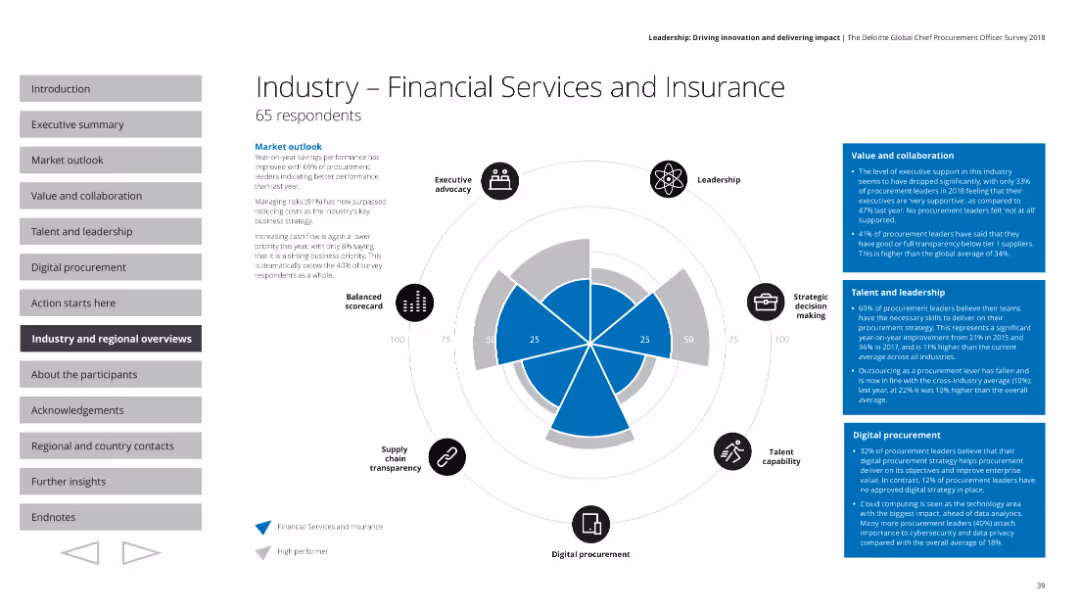
The slide contains a radar chart comparing various performance indicators. It includes small icons around the chart, text boxes with details, and a section header.
Industry Overview
Financial Services
This slide presents an overview of the financial services and insurance industry's performance based on a survey. Key aspects such as executive advocacy, leadership, strategic decision making, talent capability, digital procurement, and supply chain transparency are highlighted. It includes market outlook and specific metrics on value, collaboration, talent, and leadership.
Financial services, insurance, industry overview, radar chart, market outlook
Mixed Chart
Deloitte
Saved
The slide contains multiple icons and data points organized around a central IT icon, surrounded by other business functions and contract values.
Sales and Business Development
Technology & Software
This slide showcases Gartner’s Global Technology Sales, highlighting sales forces, contract values, and enterprise engagement.
Sales, Technology, Contract Value, Gartner, Enterprises
Diagram
Gartner
Saved
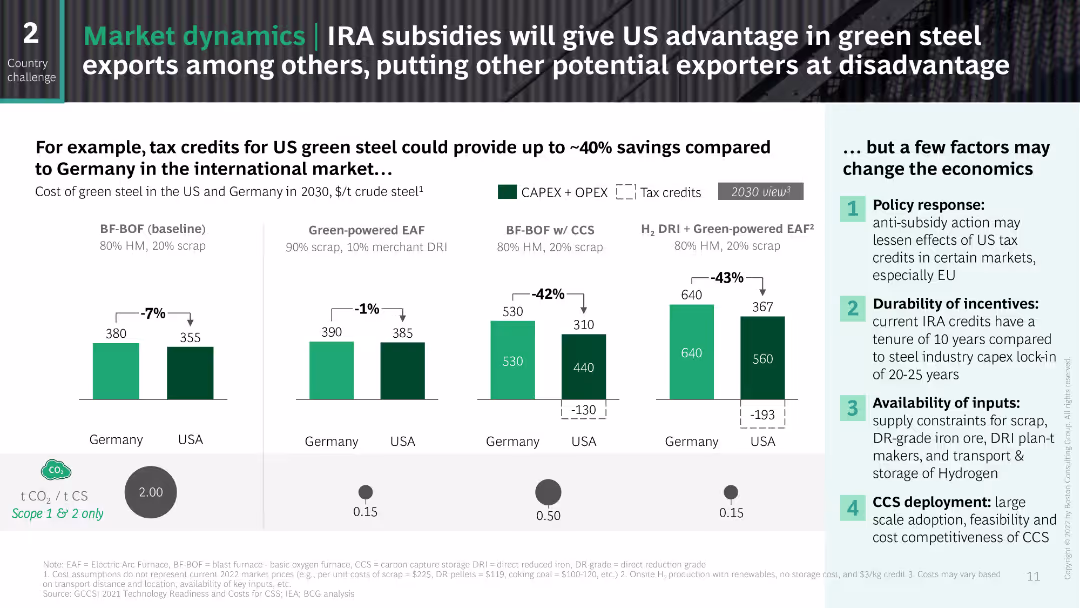
The slide uses a side-by-side comparison format to illustrate the cost differences between green steel production in the US and Germany. It includes column charts with cost breakdowns and a section on potential economic factors affecting these costs. The design is clear and data-focused.
Financial Performance
Industrial & Manufacturing
This slide compares the potential cost savings of US green steel exports versus German green steel, considering the impact of IRA subsidies and highlighting factors that may affect these economics, such as policy responses and input availability.
green steel, IRA, subsidies, cost comparison, US, Germany
Multiple Chart
BCG
Saved
The slide features multiple pie charts and percentage statistics showcasing the positive impact of the nbn network on various aspects of wellbeing like employment, health, and social connections.
Market Analysis and Trends
Telecommunications
Explores the positive effects of the nbn network on users' wellbeing across several domains, indicating substantial benefits in employment, health, education, and community connectivity.
nbn, Wellbeing, Impact, Satisfaction, Positive
Multiple Chart
Accenture
Saved
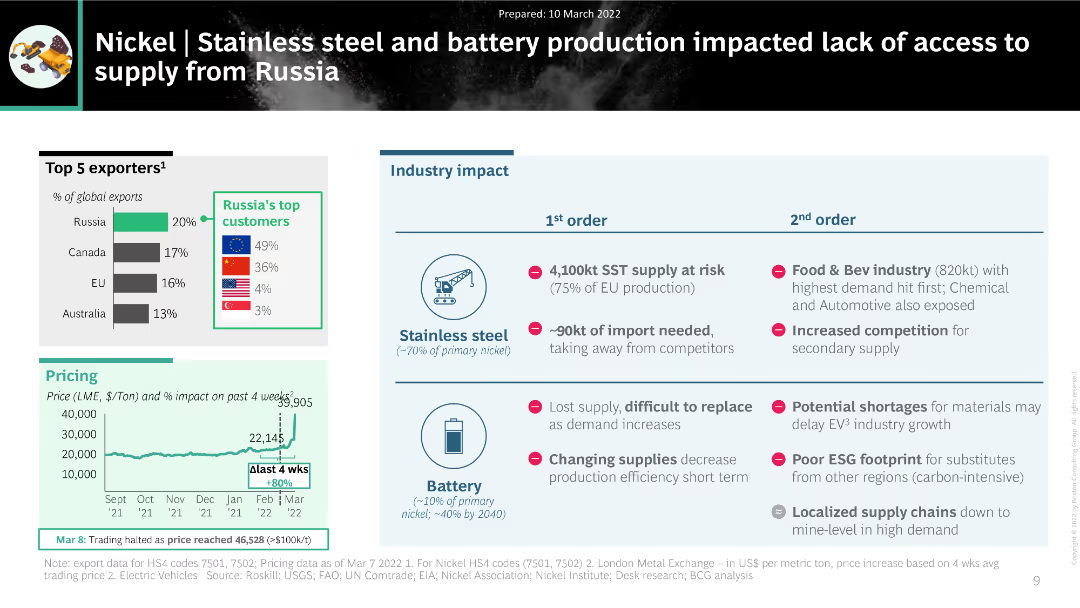
The slide features a combination of charts and tables, including a column chart showing the top exporters of nickel, a pricing trend chart, and a table summarizing the industry impact on stainless steel and battery production.
Market Analysis and Trends
Industrial & Manufacturing
The slide analyzes the impact of disrupted nickel supply from Russia on stainless steel and battery production. It includes data on top exporters, pricing trends, and the cascading effects on various industries, highlighting significant supply chain challenges.
nickel, supply disruption, stainless steel, battery production, industry impact
Multiple Chart
BCG
Saved
A bubble chart showing the growth and CARG (2020-2025) of different IT services, categorized by 'Run,' 'Build,' and 'Design.' Each bubble represents a service category with varying sizes indicating their market impact.
Technology and Digital Transformation
Technology & Software
This slide illustrates the transition from on-premise to cloud services, highlighting the growth rates and market sizes of different IT service categories, aiding in strategic planning for digital transformation.
On-Prem to Cloud, IT Services, Growth, Digital Transformation, Market Impact
Single Chart
Gartner
Saved
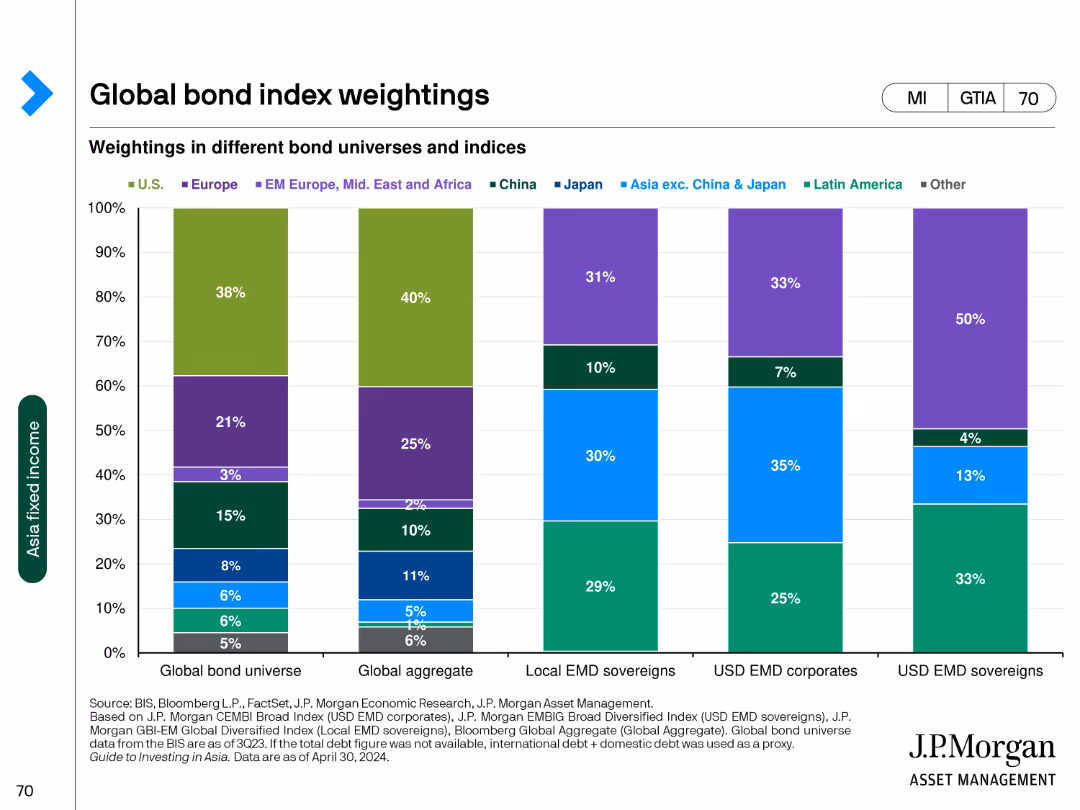
The slide features a column chart displaying the weightings in different bond universes and indices across various regions such as the U.S., Europe, and China.
Market Analysis and Trends
Financial Services
The slide presents the weight distribution in global bond universes, aggregate bonds, local EMD sovereigns, and USD EMD corporates and sovereigns.
bond, weightings, global, indices, regions
Single Chart
JP Morgan
Saved
Comprises bullet points with accompanying icons describing characteristics of future organizational models designed for efficiency and adaptability.
Organizational Structure and Change
Professional Services
Discusses the evolution of organizational structures that prioritize speed, flexibility, and cross-functional collaboration to adapt to rapidly changing markets.
organizational change, flexibility, speed, adaptability, structure
Header Horizontal
McKinsey
Saved
A horizontal bar chart showing the percentage of titles distributed among various linear and OTT services as of February 2022, alongside a key statistic of 817K unique program titles.
Product and Service Analysis
Media & Entertainment
The slide provides an overview of the distribution of video content titles across different services, emphasizing the growth in content availability.
video, content, titles, services, distribution
Mixed Chart
Nielsen
Saved
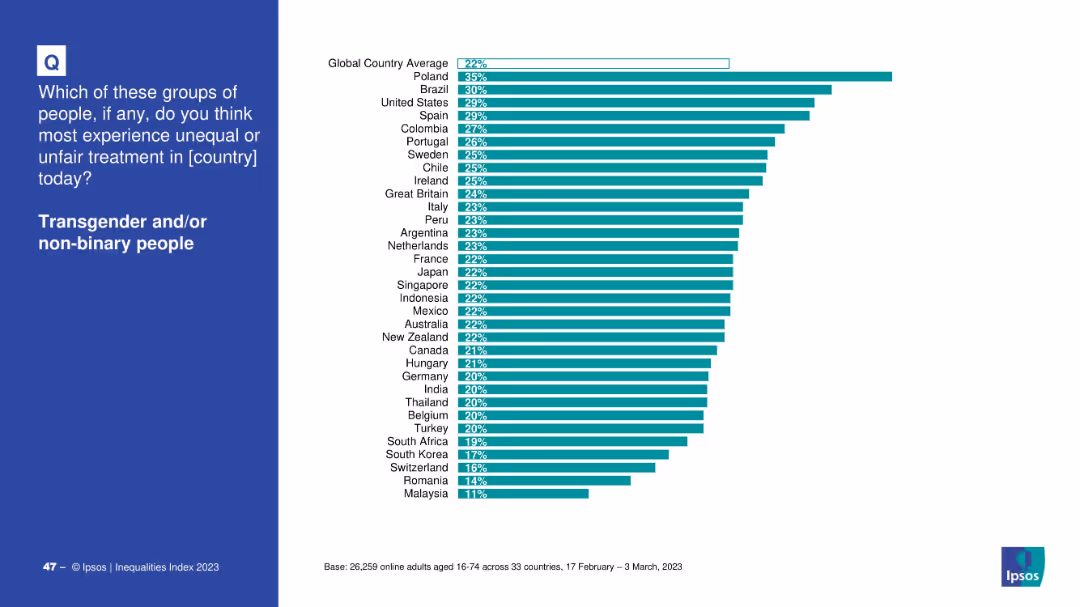
Bar chart showing global country comparison, teal bars on white background, blue text panel on left
Market Analysis and Trends
Government & Public Sector
This slide presents the perceived unfair treatment of transgender and/or non-binary individuals across 33 countries. Poland, Brazil, and the US top the chart. A global average of 22% indicates notable concern for this group.
transgender, non-binary, inequality, global perception, survey, discrimination, Ipsos, bar chart, 2023
Mixed Chart
IPSOS
Saved
Contains bar graphs, and detailed text analysis comparing China, the US, and EU in terms of battery production capabilities. The slide uses a combination of purple, blue, and grey colors.
Competitive Landscape
Energy & Utilities
This slide details the strategic industrial policies of the world's largest economies in the battery sector, focusing on manufacturing capacities and government incentives.
battery industry, China, US, EU, industrial policy, manufacturing capacity, government incentives
Mixed Chart
Accenture
Saved
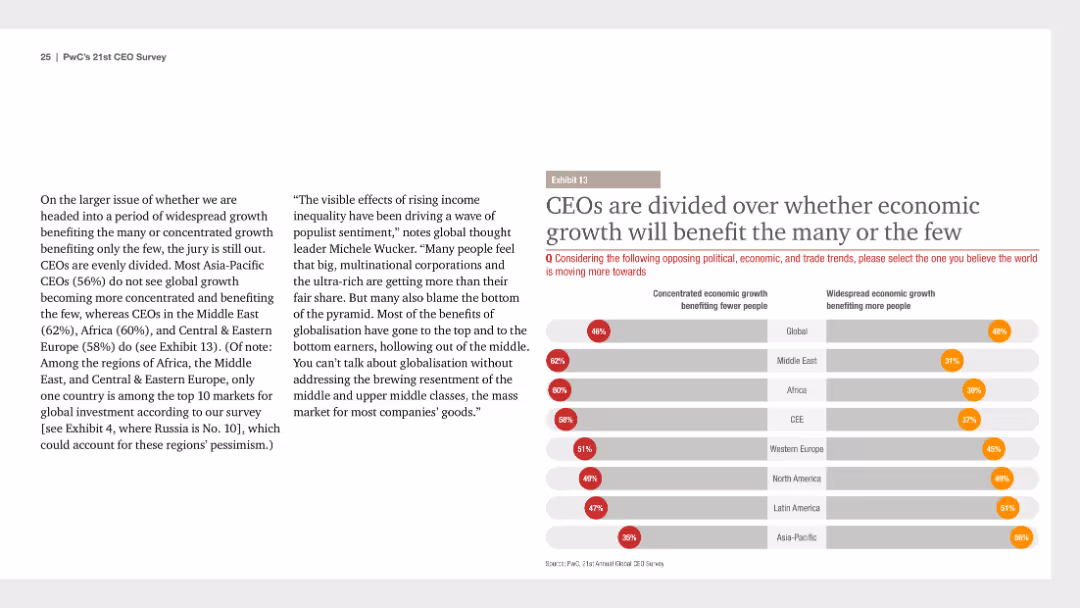
A column chart showing regional opinions on whether economic growth will benefit the many or the few. Accompanying text discusses CEO perspectives on global growth and economic inequality.
Risk Assessment and Management
Financial Services
The slide presents divided opinions among CEOs about whether economic growth will benefit many people or a few, highlighting regional differences and economic inequality concerns.
economic, growth, inequality, CEOs, regional
Multiple Chart
PwC/Strategy&
Saved
Diagrams and flowcharts display the structure and financial divisions within Barclays Investment Bank.
Organizational Structure and Change
Financial Services
Provides an overview of the financial performance and structural organization of Barclays Investment Bank in 2023.
investment bank, structure, 2023, financial, Barclays
Diagram
Barclays
Saved
The slide presents a detailed text description of Booz Allen's ESG strategy, highlighting internal and external drivers, impact pillars, and goals, with a focus on sustainability.
Strategic Planning
Professional Services
This slide describes Booz Allen's environmental, social, and governance (ESG) strategy, emphasizing their goals, internal and external drivers, and impact pillars for sustainable growth.
Booz Allen, ESG strategy, sustainability, impact pillars, internal drivers
Pillar
Booz Allen Hamilton
Saved
Contains icons and descriptive text segments analyzing luxury market performance in sectors like Cars, Yachts, and Fine Dining. Each segment is clearly defined with associated performance indicators.
Market Analysis and Trends
Consumer Goods
This slide delves into various luxury market segments in 2020, detailing the impact of COVID-19 on sectors like automotive, yachts, fine dining, and hospitality. It examines the nuances of market resilience or decline across these categories, highlighting specific challenges and consumer behavior trends.
luxury sectors, market analysis, COVID-19 impact, consumer behavior, sector performance
Pillar
Bain
Saved
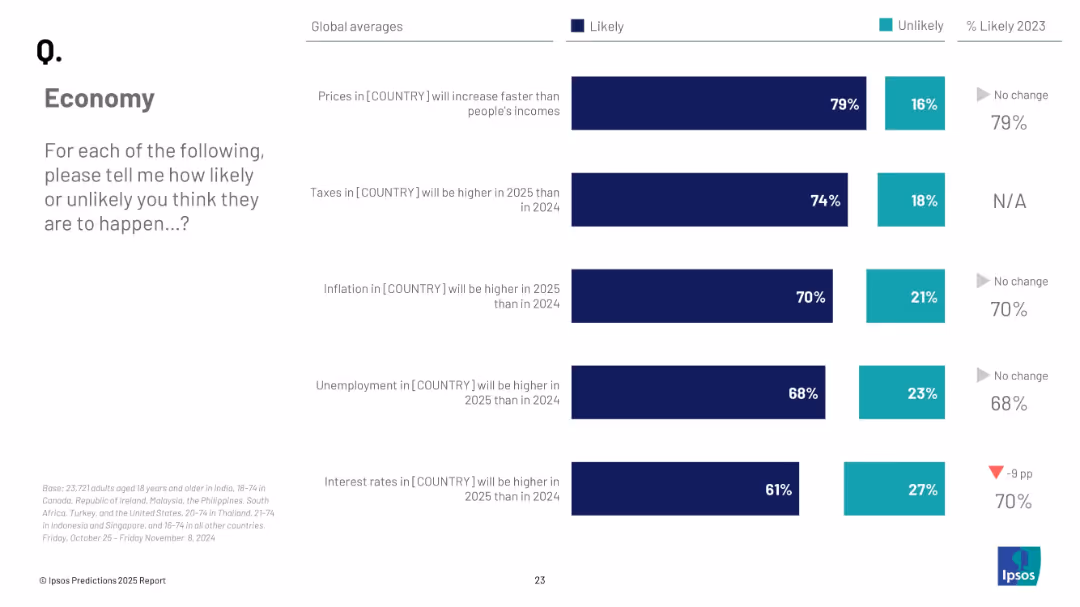
Stacked bar chart showing global averages of how likely people believe five economic events will occur in 2025, including prices, taxes, inflation, etc.
Strategic Planning
Financial Services
A global snapshot of predicted economic conditions for 2025, including anticipated changes in prices, taxes, inflation, unemployment, and interest rates. Most expectations trend toward worsening conditions.
economy, global trends, inflation, taxes, unemployment, strategic forecast, Ipsos, 2025
Mixed Chart
IPSOS
Saved
The slide includes a line chart and a bar chart. The line chart shows the 5-year excess return percentage over time. The bar chart compares various performance metrics such as gross return, net return, tracking error, and market capture.
Financial Performance
Financial Services
Evaluates the performance of J.P. Morgan's Growth Advantage Strategy SMA, focusing on risk-adjusted returns, tracking error, information ratio, and market capture metrics.
risk-adjusted returns, performance, strategy, metrics, consistency
Mixed Chart
JP Morgan
Saved
Features column charts and a text box. Charts show U.S. market podcast ad revenues from 2015 to 2022, highlighting a significant growth in revenue. Text box details the growth rates of podcasting compared to other digital channels. Red and black bars indicate different years.
Financial Performance
Media & Entertainment
Discusses the rapid growth of podcast advertising revenues in the U.S., significantly outpacing overall internet ad revenue growth. Provides a detailed comparison to other digital advertising channels.
Podcasting, Ad Revenues, Digital Channels, Growth Rates, Market Trends
Single Chart
PwC/Strategy&
Saved
A stacked column chart showing total TV reach composition by viewing source and ad model for P2+ over a year, highlighting a shift away from linear TV.
Market Analysis and Trends
Media & Entertainment
The slide illustrates a 10% year-over-year increase in viewers not tuning into any form of linear TV, with AVOD becoming more complementary to SVOD consumption.
TV, viewers, linear TV, AVOD, SVOD
Mixed Chart
Nielsen
Saved
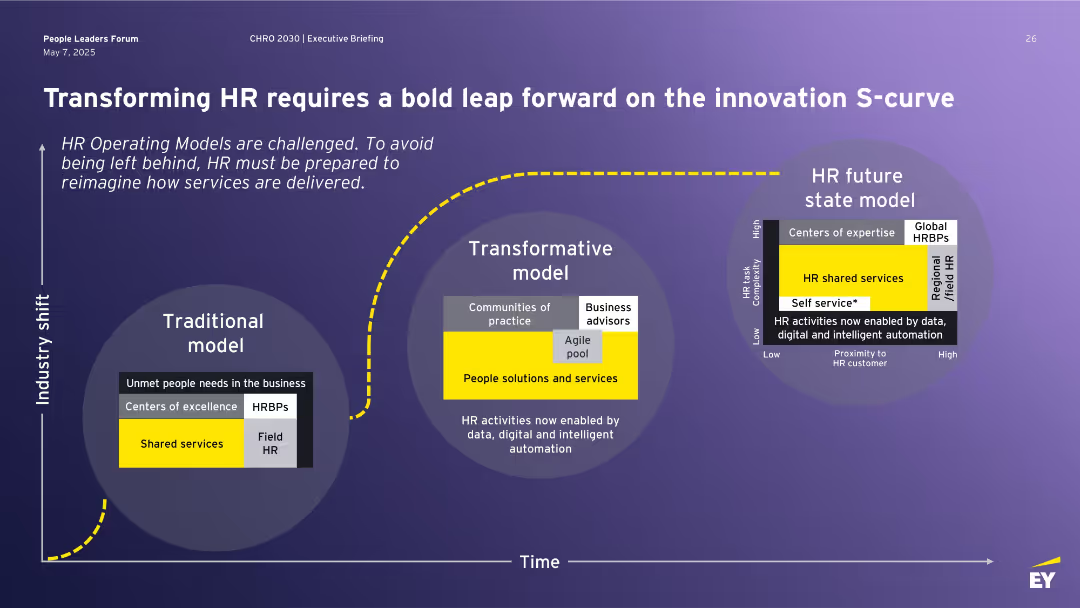
Three-part horizontal layout illustrating evolution from Traditional to Transformative to Future HR model using labeled circle diagrams, with a yellow dotted line representing industry shift over time.
Technology and Digital Transformation
Professional Services
This slide outlines the evolution of HR operating models from traditional to transformative and future-state frameworks. It highlights the impact of data, automation, and digital tools on HR service delivery. The innovation S-curve illustrates a necessary leap to stay relevant and meet business needs.
HR transformation, operating model, shared services, automation, innovation, S-curve, future of work
Single Chart
EY
Saved
Text dominant layout with small pie charts in red and grey tones. There's a distinct contrast between the 'Orange World' text section and statistical data side.
Strategic Planning
Professional Services
The slide explores the move towards a more autonomous, fragmented network of operations, highlighting changes in employment structures and the rise of freelance work.
Work, Autonomy, Freelance, Employment, Opportunities
Mixed Chart
PwC/Strategy&
Saved
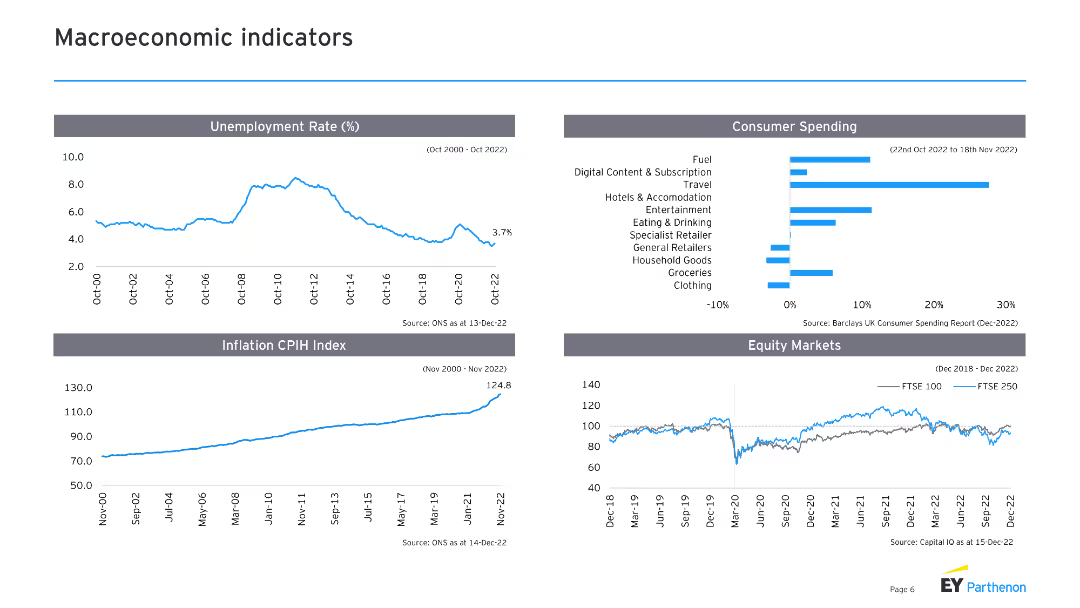
The slide includes four sections with line charts and column charts: unemployment rate, consumer spending, inflation CPIH index, and equity markets. Each chart has supporting text explaining the trends and data sources.
Market Analysis and Trends
Financial Services
This slide covers key macroeconomic indicators, including unemployment rates, consumer spending patterns, inflation trends, and equity market performance. It provides a comprehensive overview of the current economic landscape.
Macroeconomic indicators, unemployment, consumer spending, inflation, equity markets
Multiple Chart
EY
Saved
The slide features two main charts: a column chart on the left showing developed market central bank bond purchases in USD billions over a rolling 12-month period, and a line chart on the right depicting historical policy rates and forward curves for Fed, ECB, BoE, and BoJ.
Market Analysis and Trends
Financial Services
This slide analyzes central bank bond purchases and policy rates, highlighting trends and forward curves for major economies. Useful for understanding monetary policy impacts.
monetary policy, central bank, bond purchases, policy rates, forward curves, Fed, ECB, BoE, BoJ
Multiple Chart
JP Morgan
Saved
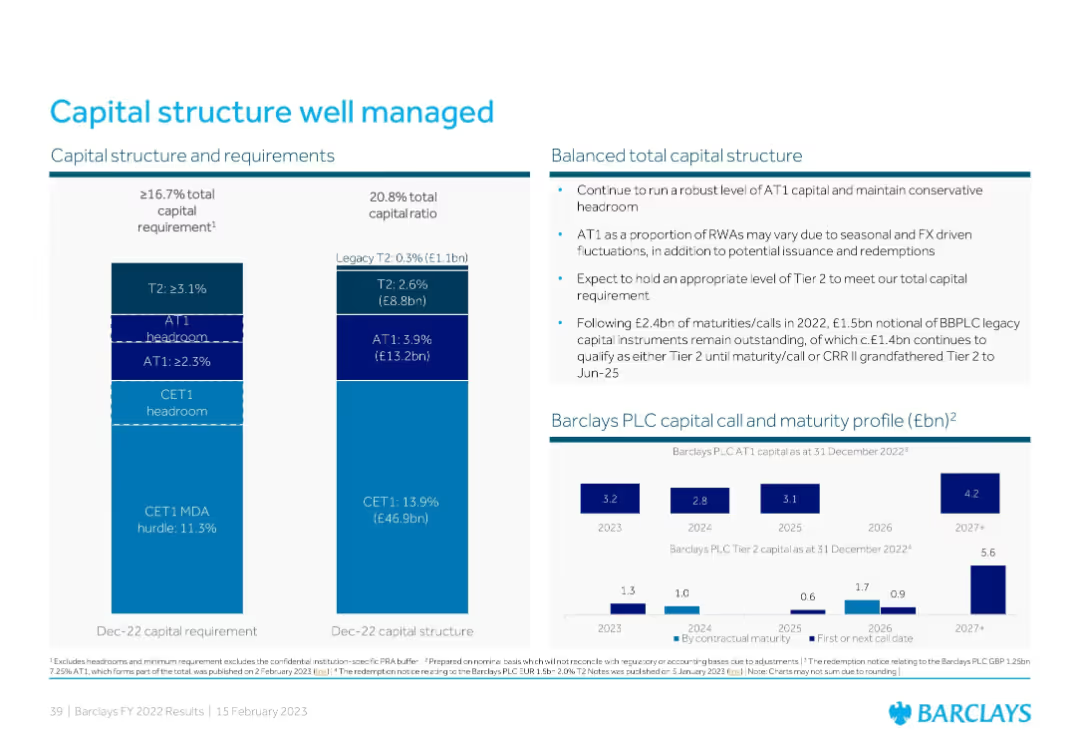
Three-part layout: a stacked bar chart for regulatory capital requirement, a current capital structure bar, and a capital maturity profile showing AT1 and Tier 2 maturity timelines.
Corporate Finance and Valuation
Financial Services
Barclays outlines its well-managed capital structure, breaking down its CET1, AT1, and Tier 2 capital layers and maturity profiles. It highlights regulatory requirements, headroom levels, and future capital instrument call/maturity expectations through 2027+.
capital structure, AT1, Tier 2, maturity profile, Barclays
Multiple Chart
Barclays
Saved
Mixed layout with photos of cities, bullet points, and a green bar chart showing projected economic impact by city.
Investment Analysis
Hospitality & Tourism
This slide projects future tourism value driven by current event attendance, estimating $9.2M in impact primarily for New York, followed by Texas and Florida. Highlights return visits and potential economic benefit.
tourism forecast, economic impact, future visits, spending, event ROI, US cities, projections
Mixed Chart
Nielsen
Saved
Previous
Next
If nothing, comes up, please save your slides first
Create a FREE account to continue browsing
Receive Instant Access to 1,000+ slides from companies like McKinsey, Google, and Goldman Sachs
First Name
Last Name
Email
Password
I agree to all
Terms & Privacy Policy
Thank you! Your submission has been received!
Oops! Something went wrong while submitting the form.
Have an account?
Sign in
Column Chart
Heatmap
Chevron
Org Chart
Infographic
Callouts
Timeline
List
Graphic
Picture
Process Flow
Diagram
Paragraph
Map
Table
Framework
Subtitle
Takeaway Box
Icon
Other Chart
Radar Chart
Waterfall Chart
Mekko Chart
Pie Chart
Scatter Plot
Line Chart
Bar chart
Bullet points