My Account
My Slides
Search by Category
Templates
Leave Feedback
Login
Logout
Get Started
Browse all Slides
Browse all Slides
Create a FREE Account
Instant access to 1,000+ real slides from top companies like McKinsey, BCG, Goldman Sachs, Google and many more!
First Name
Last Name
Email
Password
I agree to all
Terms & Privacy Policy
Thank you! Your submission has been received!
Oops! Something went wrong while submitting the form.
Have an account?
Sign in
Saved Slides
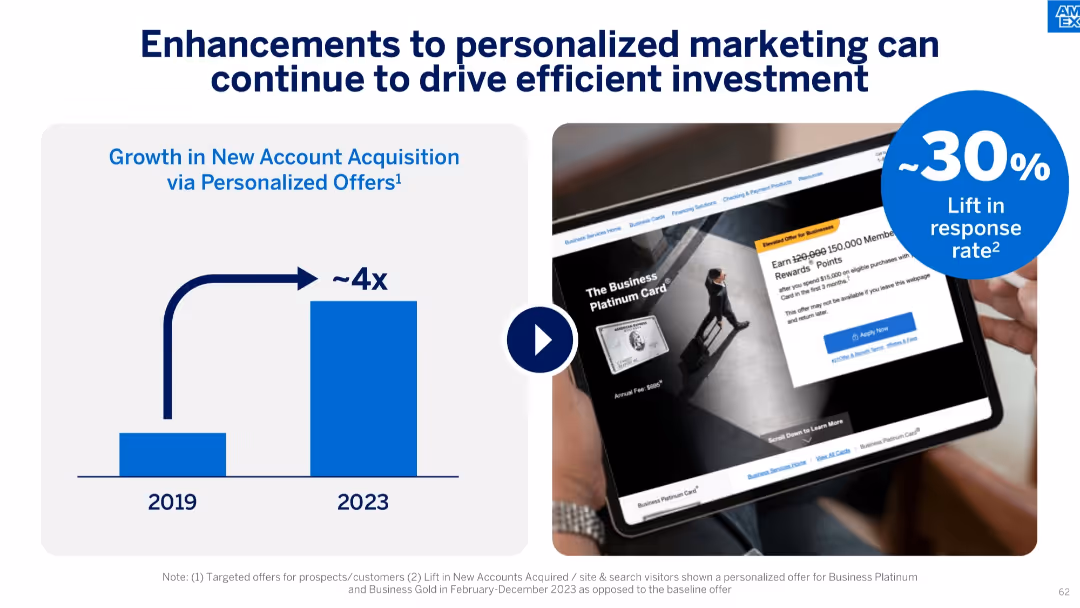
Split into two halves: left has a vertical bar chart (2019 vs 2023), right shows a tablet ad mockup and a 30% lift icon.
Investment Analysis
Financial Services
The slide demonstrates how personalized marketing efforts have significantly improved new account acquisition (~4x growth) and lifted response rates by ~30%. It showcases data from 2019 to 2023, emphasizing the value of targeted digital offers.
personalized marketing, account acquisition, response rate, ROI, 2023, digital offers, ad performance, efficiency, marketing growth, customer targeting
Mixed Chart
McKinsey
Saved
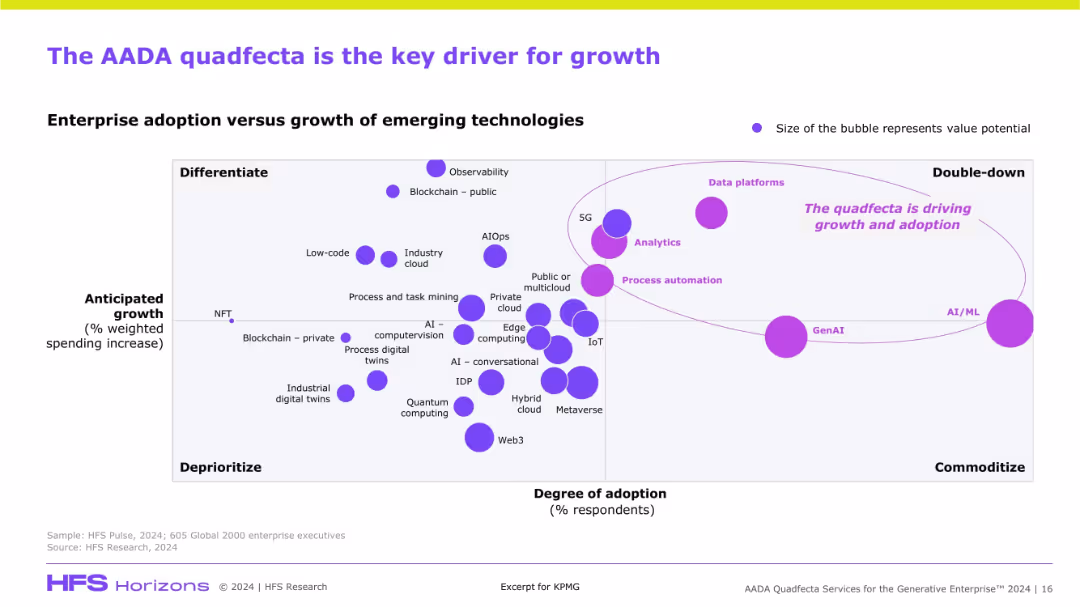
Scatterplot chart mapping emerging technologies based on adoption and anticipated growth. Bubble size denotes value potential. Purple elements highlight AADA’s prominence.
Market Analysis and Trends
Artificial Intelligence
This slide visualizes the strategic positioning of AADA technologies (Analytics, AI/ML, Automation, Data Platforms) as high-growth, high-adoption drivers. GenAI and AI/ML appear as key focal areas for investment and differentiation in enterprise tech.
emerging tech, AADA, GenAI, AI/ML, analytics, data platforms, adoption, growth, quadrant chart
Single Chart
KPMG
Saved
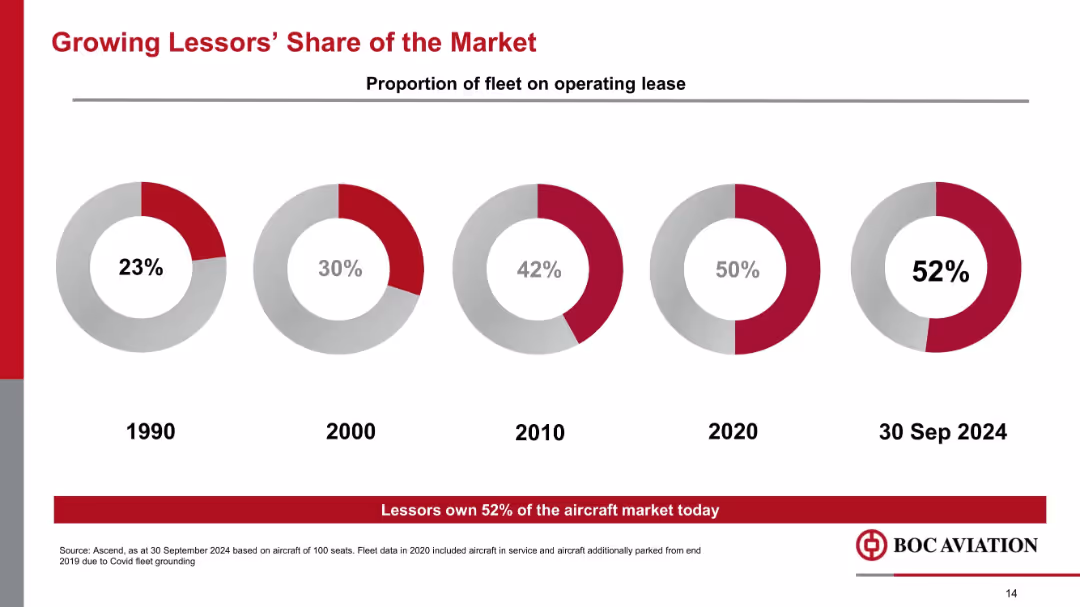
Donut chart progression showing operating lease share from 1990 to Sep 2024, with 52% share noted for 2024.
Market Analysis and Trends
Transportation & Logistics
The slide tracks the increasing dominance of aircraft lessors, whose market share of operating leases has risen from 23% in 1990 to 52% in 2024. It signals structural changes in how airlines manage fleet financing.
operating lease, lessors, fleet management, market share, leasing trend, aviation finance
Mixed Chart
Goldman Sachs
Saved
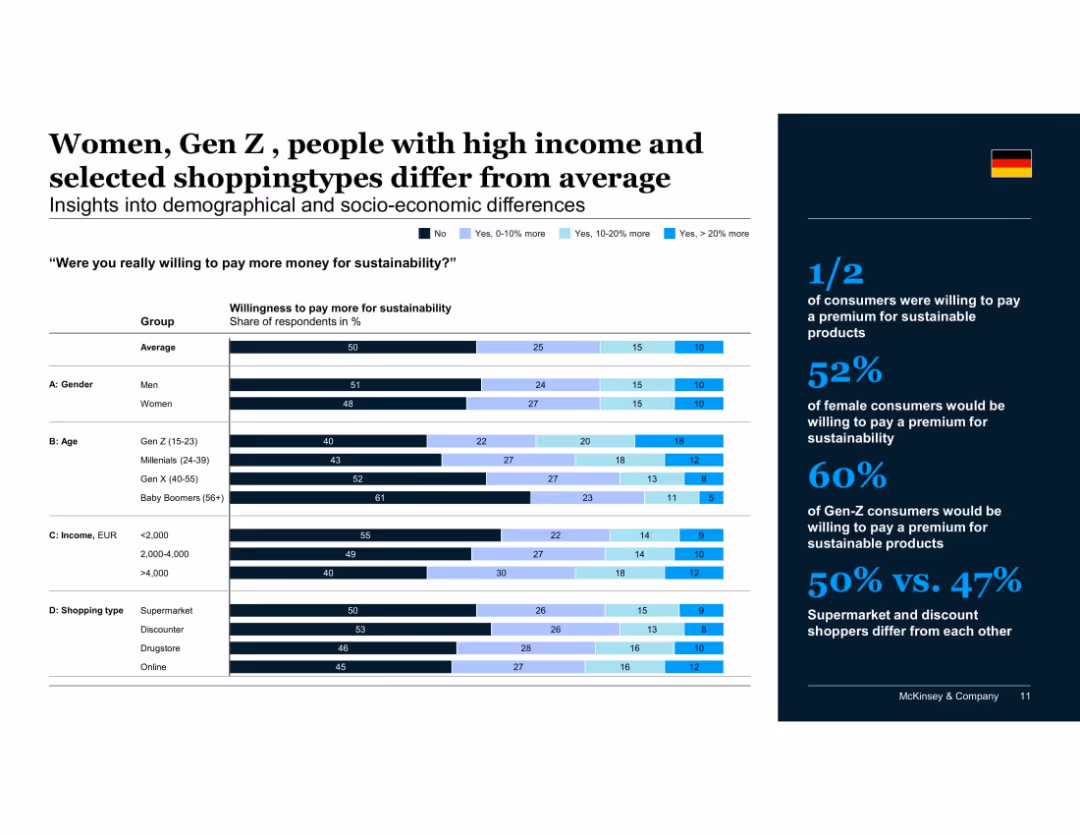
Horizontal stacked bar chart showing willingness to pay more for sustainability by demographics and shopping types
Customer and Market Segmentation
Consumer Goods
Half of consumers are willing to pay a premium for sustainable goods. Gen Z, women, and high-income earners are more likely to pay more, as are drugstore and discount shoppers, indicating clear segmentation by demographic and behavior.
willingness to pay, Gen Z, women, income, sustainability, demographic differences, shopping behavior, price sensitivity, McKinsey
Mixed Chart
McKinsey
Saved
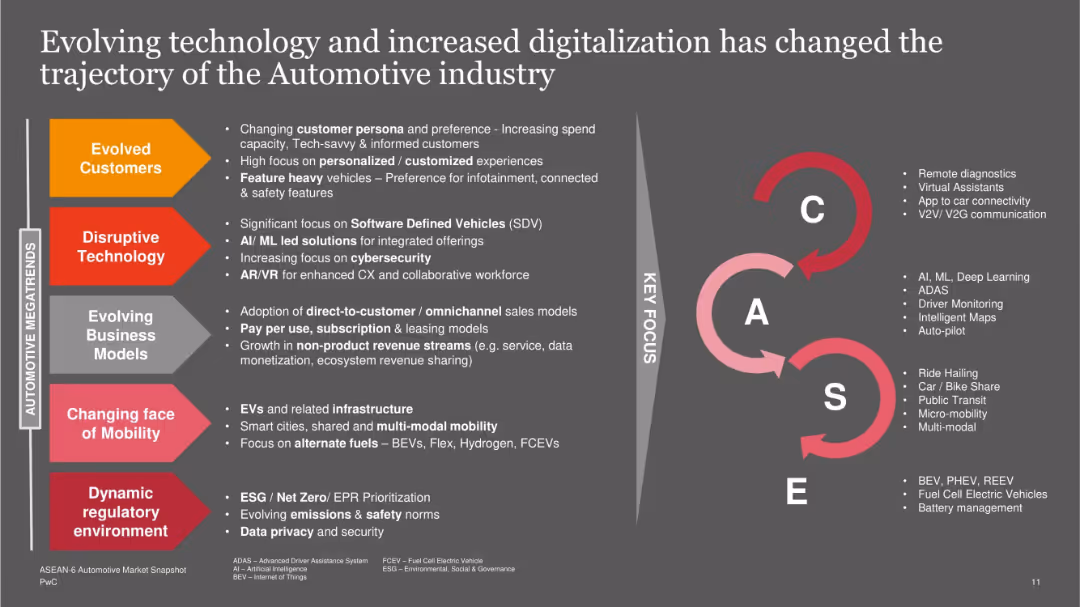
Left vertical layout lists six megatrends with arrow blocks; right side visualizes the CASE framework (Connected, Autonomous, Shared, Electric) and key focus areas.
Technology and Digital Transformation
Industrial & Manufacturing
Describes six megatrends influencing the automotive industry, including evolved customers, disruptive tech, business models, mobility, and regulation. The CASE framework reinforces strategic shifts in tech integration, customer focus, and infrastructure adaptation.
megatrends, CASE, automotive tech, mobility, EV, cybersecurity, AI, business models
Table
PwC/Strategy&
Saved
There are two large column charts, a pie chart, and a textbox with bullet points. Red highlights are used for key data points, and percentages are presented in a clear format.
Market Analysis and Trends
Transportation & Logistics
The slide provides a performance overview of Leonardo's helicopter business, including past results and projections, with a focus on growth and profitability factors.
helicopter, orders, revenue, EBITA, profitability, civil recovery, market trends, production efficiency
Multiple Chart
Goldman Sachs
Saved
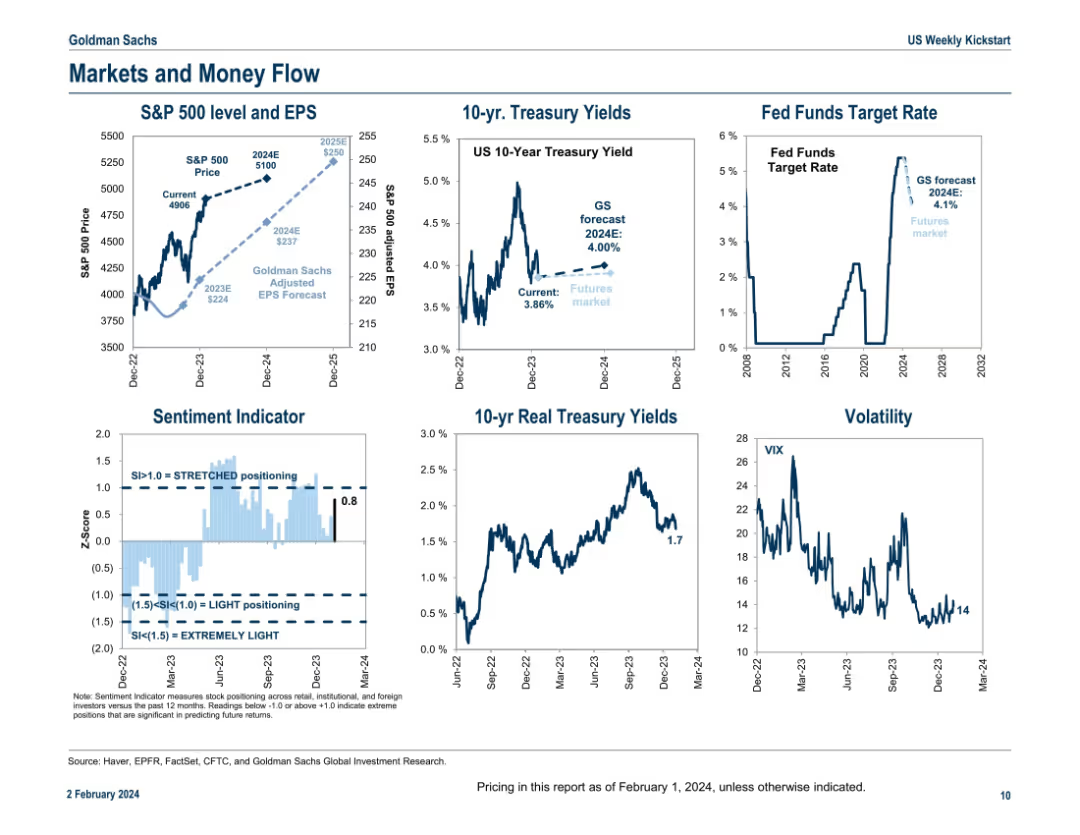
Six mini-panel layout of line charts; covers equity, bond yields, rates, sentiment, and volatility in a concise dashboard format.
Market Analysis and Trends
Financial Services
A multi-panel dashboard providing a snapshot of market indicators including S&P 500 price and EPS trends, treasury yields, sentiment, Fed funds rate projections, real yields, and VIX volatility. The slide is a macroeconomic pulse check summarizing key movements and outlooks as of early 2024.
equity, yields, sentiment, Fed rate, volatility, S&P 500, EPS, VIX, bonds
Multiple Chart
Goldman Sachs
Saved
Features a collection of stacked column charts detailing demographics such as gender, age, employment status, education, and tenure among survey respondents from different countries. Each chart uses a consistent green color scheme, and the layout provides a clear division between different demographic categories.
Market Analysis and Trends
Professional Services
This slide presents demographic data of respondents from a global survey on deskless workers, including distributions by age, gender, education, and employment status. Useful in understanding the diversity of the survey population and contextualizing the data in discussions of workplace practices in multinational contexts.
demographics, survey, global, education, employment, gender, age
Multiple Chart
BCG
Saved
A bar graph on the right compares the number of new digital services adopted by consumers during the pandemic years. The left side details the increase in purchases made in digital services.
Financial Performance
Technology & Software
Examines the growing number of digital service purchases made by existing consumers, indicating market growth and the potential for new service development.
consumer purchases, digital services, pandemic, market growth, service development, adoption rates
Single Chart
Bain
Saved
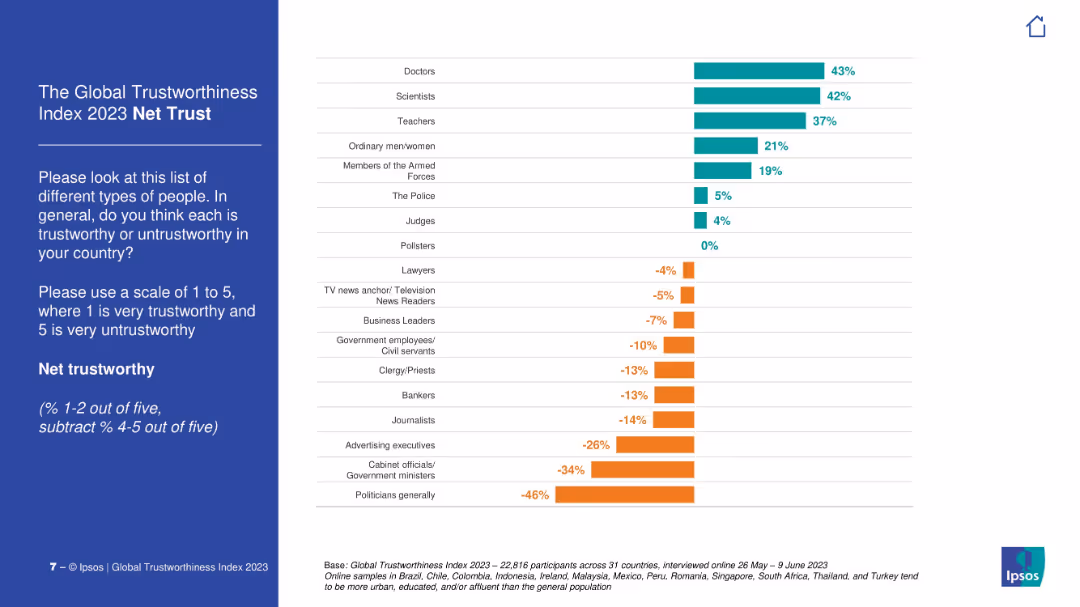
Vertical bar chart showing net trust score (positive % minus negative %) for various professions. Includes color-coded bars for positive and negative values.
Market Analysis and Trends
Professional Services
This slide summarizes the net trustworthiness of different professions based on global survey results. Doctors, scientists, and teachers are the most positively viewed, while politicians and advertisers hold highly negative scores.
net trust, public perception, professions, global survey, Ipsos, credibility, media trust, political distrust
Mixed Chart
IPSOS
Saved
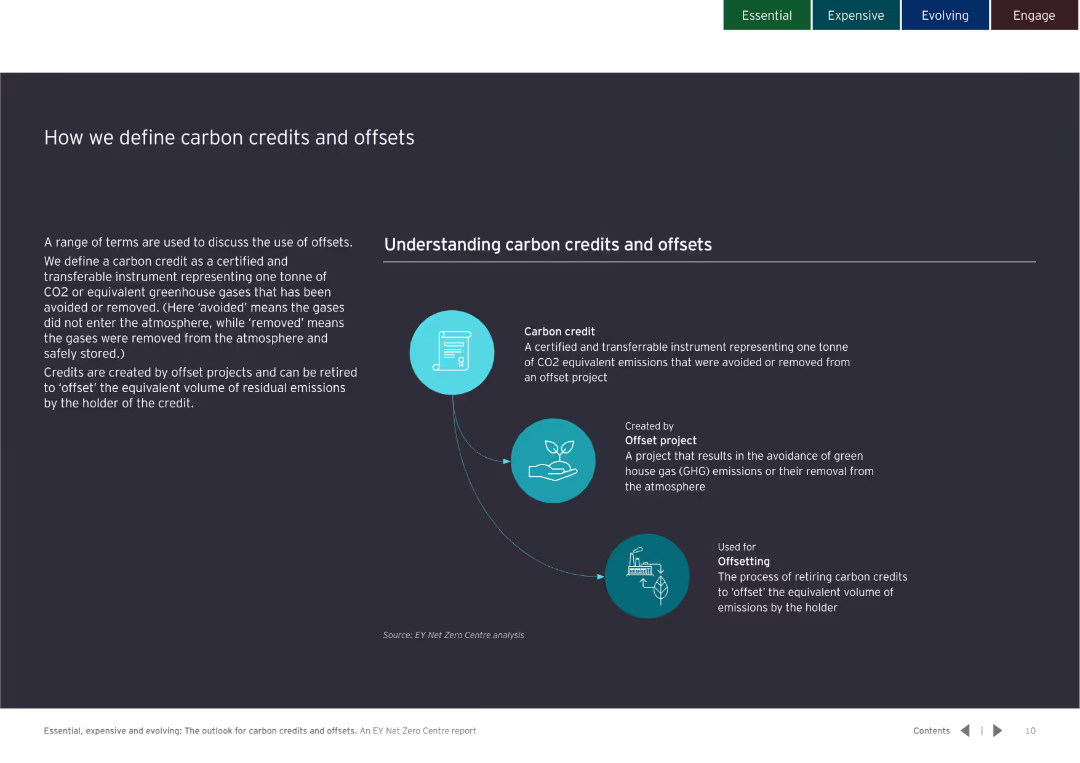
Contains detailed text definitions and an infographic explaining carbon credits and offsets, including creation and use.
Regulatory and Compliance
Environmental Services & Sustainability
Defines carbon credits as instruments for avoided or removed CO2 emissions, explaining their creation through offset projects and usage in emission reductions.
Carbon, credit, offset, definition, regulation, compliance, CO2, emissions, reduction
Diagram
EY
Saved
A world map highlights key locations with markers. An inset magnifies the Singapore region, showing more detail with labeled yard locations.
Strategic Planning
Energy & Utilities
The slide demonstrates Seatruim's global presence, highlighting its worldwide yards and the strategic position of Singapore in the company's operations. It could be used to emphasize the company's expansive global operations and strategic locations.
Global, Operations, Reach, Yards, Singapore
Graphic
Morgan Stanley
Saved
A bar chart highlighting the potential economic impact of a skills crisis, with key points summarized in text. The color scheme is purple and teal against a white background.
Risk Assessment and Management
Education & Training
The slide quantifies the potential economic loss to G20 countries due to a skills crisis and stresses the need for investment in education and technology.
Skills Crisis, G20, Economic Impact, Education Investment, Technology, GDP Growth, Risk Management, Labor Market, Forecast
Single Chart
Accenture
Saved
The slide features a column chart with historical data on leveraged finance fees, broken down by sponsors and corporates.
Risk Assessment and Management
Financial Services
The slide presents data on how Credit Suisse has managed leveraged finance fees through different credit cycles, showing the market share and trends over time.
credit cycles, leveraged finance, Credit Suisse, fees, market share, trends, sponsors, corporates, management
Single Chart
Credit Suisse
Saved
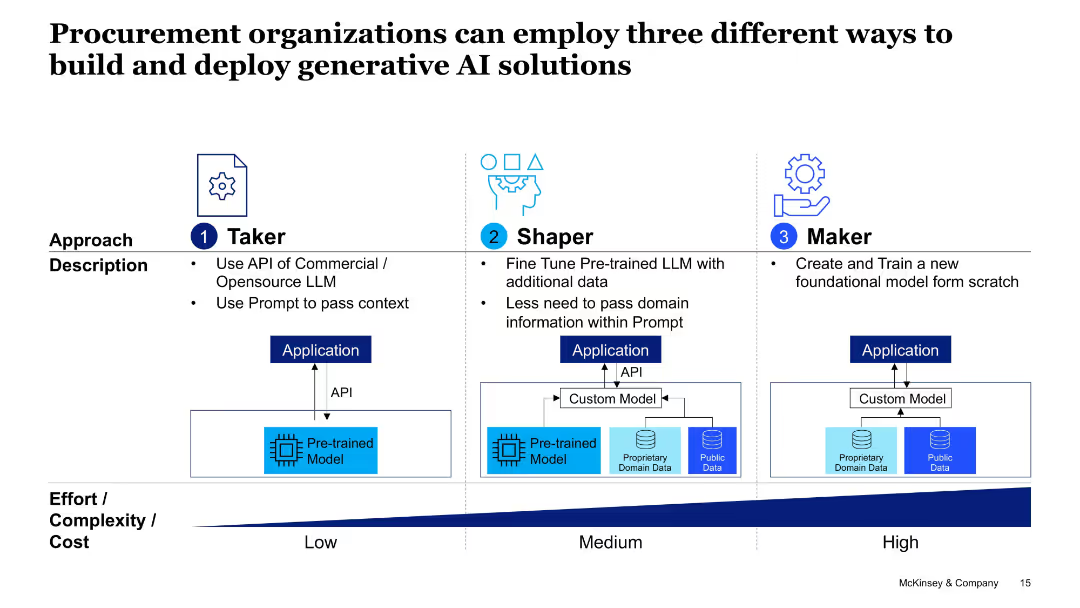
Visual comparison of 3 models (Taker, Shaper, Maker) using application flowcharts; effort/cost axis at bottom.
Technology and Digital Transformation
Professional Services
This slide categorizes three implementation strategies for Gen AI in procurement—using APIs (Taker), fine-tuning models (Shaper), and building models from scratch (Maker)—with increasing complexity and customizability.
GenAI deployment, Taker, Shaper, Maker, LLM, procurement, application model, complexity
Table
McKinsey
Saved
Contains a text-heavy slide with multiple sections and key strategic objectives outlined in boxes with connecting lines.
Strategic Planning
Financial Services
A strategic slide outlining priorities and focus areas for 2024. It includes client experience, durable revenue streams, and investment in culture, potentially used in strategic or business development meetings.
Strategy, Objectives, Execution, Priorities
Header Vertical
Goldman Sachs
Saved
The slide presents a dark background with text and icons. Four numbered points highlight key debate topics with accompanying icons representing trustworthiness, explainability, application prioritization, and other risks related to AI.
Risk Assessment and Management
Technology & Software
This slide discusses crucial debate topics surrounding AI trends, such as the importance of trustworthiness, the necessity of explainability, the benefits of application prioritization, and the spectrum of other relevant risks, including cybersecurity, regulatory compliance, privacy, and fairness issues.
AI Ethics, Trustworthiness, Explainability, Risk Assessment
Header Vertical
McKinsey
Saved
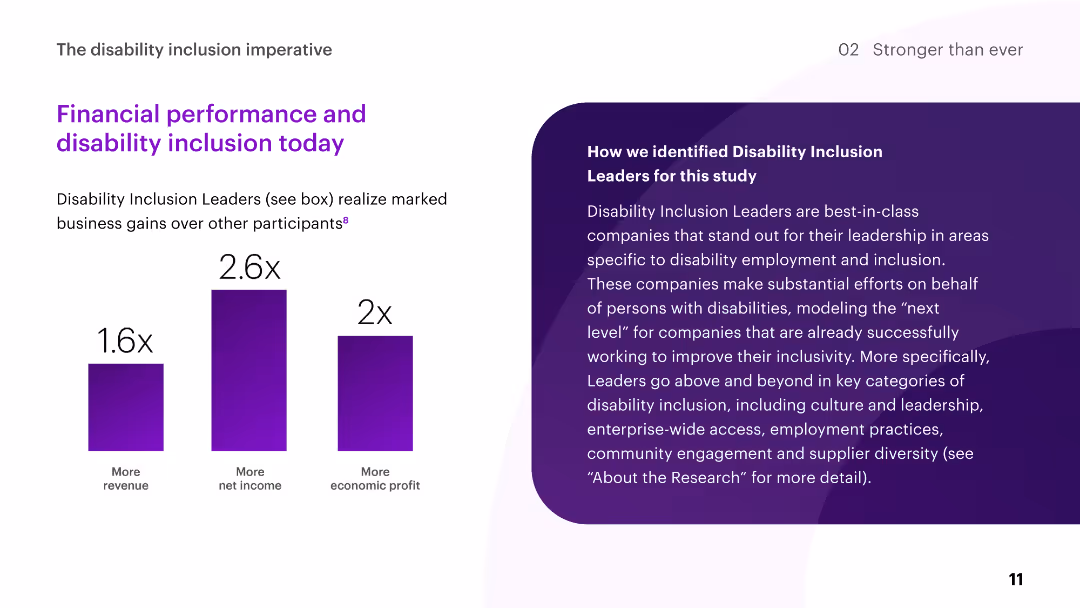
The slide includes column charts showing the financial performance of Disability Inclusion Leaders compared to other participants, highlighting revenue, net income, and economic profit.
Human Resources and Talent Management
Professional Services
The slide illustrates the business gains realized by Disability Inclusion Leaders, emphasizing higher revenue, net income, and economic profit compared to other participants.
disability inclusion, financial performance, revenue, net income, profit
Mixed Chart
Accenture
Saved
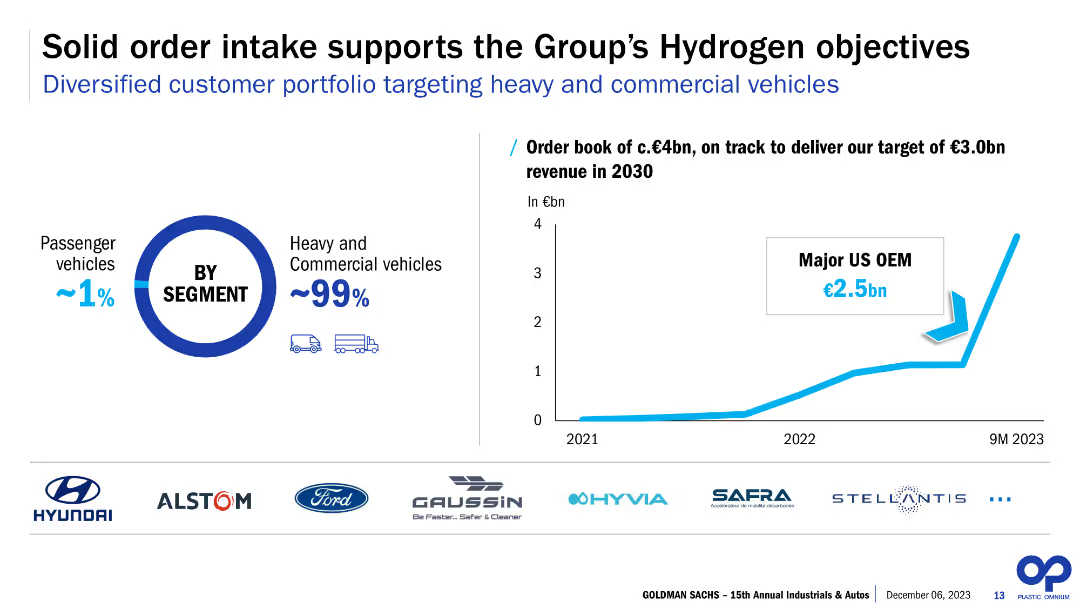
The slide features a column chart illustrating the order book from 2021 to 9M 2023, and a pie chart showing the segment distribution between passenger and commercial vehicles. It also lists logos of major clients and shows a projected revenue target for 2030.
Strategic Planning
Energy & Utilities
The slide discusses the solid order intake supporting Plastic Omnium’s hydrogen objectives, with a focus on heavy and commercial vehicles. It highlights major clients and sets a revenue target of €3.0bn by 2030, indicating strong future prospects and strategic planning in the hydrogen sector.
Hydrogen, order intake, commercial vehicles, passenger vehicles, revenue target, major clients, strategic planning, future prospects, Plastic Omnium, 2030
Multiple Chart
Goldman Sachs
Saved
This slide features multiple column charts comparing the Total Incident Frequency (TIF) and Total Recordable Incident Frequency (TRIF) of Seadrill against industry benchmarks over several years. The graphs are color-coded to differentiate between TIF, TRIF, and a benchmark, providing a clear visual distinction. The design is clean, with minimal text to allow focus on the trends shown by the graphs. Annotations highlight significant data points and trends.
Operational Efficiency
Energy & Utilities
The slide demonstrates Seadrill's commitment to safety and efficiency, showing a downward trend in incident rates compared to industry standards. It is likely used in safety briefings, regulatory reviews, or investor meetings to underscore Seadrill's strong safety record and operational excellence. The line graphs serve to reassure stakeholders of the company’s adherence to high safety standards and its effectiveness in minimizing operational risks, which is crucial for maintaining trust and fulfilling regulatory requirements.
safety, operational efficiency, Seadrill, line graphs, incident rates, industry benchmarks, safety standards, regulatory compliance, stakeholder reassurance, trust
Multiple Chart
Barclays
Saved
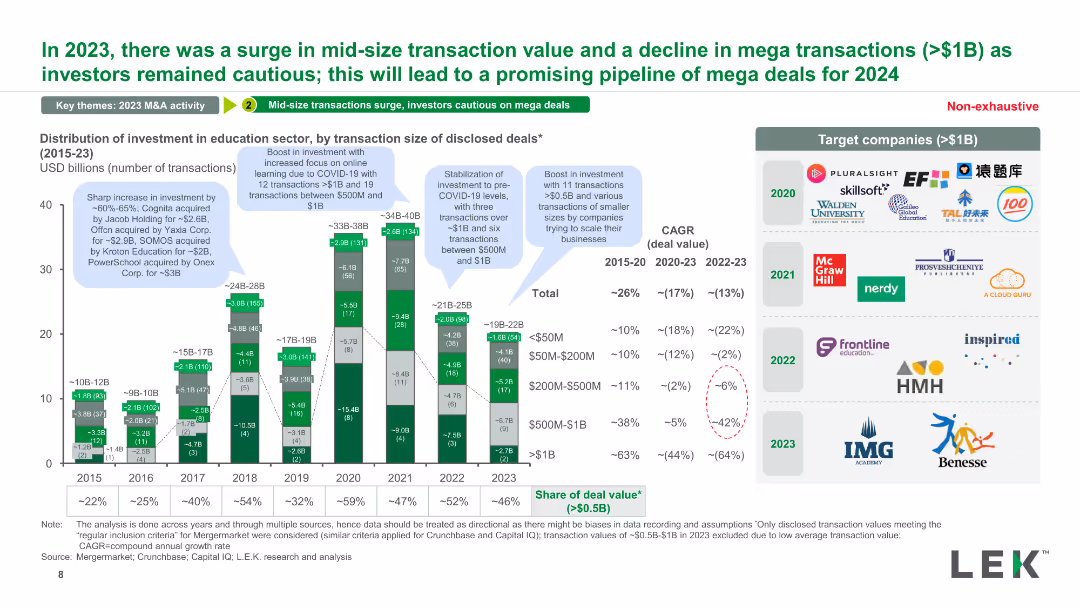
A stacked column chart depicting the distribution of investment in the education sector by transaction size of disclosed deals from 2015 to 2023. Highlights include significant transactions and their values.
Financial Performance
Education & Training
The slide details how investment in the education sector is distributed by transaction size, indicating trends in mid-size and mega transactions and their impact on the overall investment landscape.
investment, transaction size, disclosed deals, education sector, distribution
Mixed Chart
LEK
Saved
Divided into two main sections with text, the slide features an image of a woman looking at merchandise in the lower left corner. The right side of the slide emphasizes 'no-regret' moves businesses can make.
Strategic Planning
Retail & E-commerce
Provides a strategic framework for creating an integrated channel strategy that addresses customer needs and drives lifetime loyalty. It's intended for businesses seeking to blend online and offline retail experiences seamlessly. The slide suggests starting with understanding consumers and driving towards lifetime loyalty to build a strong omnichannel retail presence, offering steps to remove barriers to conversion, and considering future physical retail space requirements.
Omnichannel, Retail, Strategy, Consumers, Loyalty
Boxed
Bain
Saved
Features two donut charts and a gauge chart. Each donut chart is segmented with various responses about employee awareness of career paths, colored distinctly for clarity. The gauge chart highlights a percentage.
Human Resources and Talent Management
Professional Services
Analyzes the level of employee awareness regarding career progression within the company, illustrated through clear visual charts. Suitable for internal reviews or strategic HR planning.
career paths, employee awareness, HR, charts
Multiple Chart
PwC/Strategy&
Saved
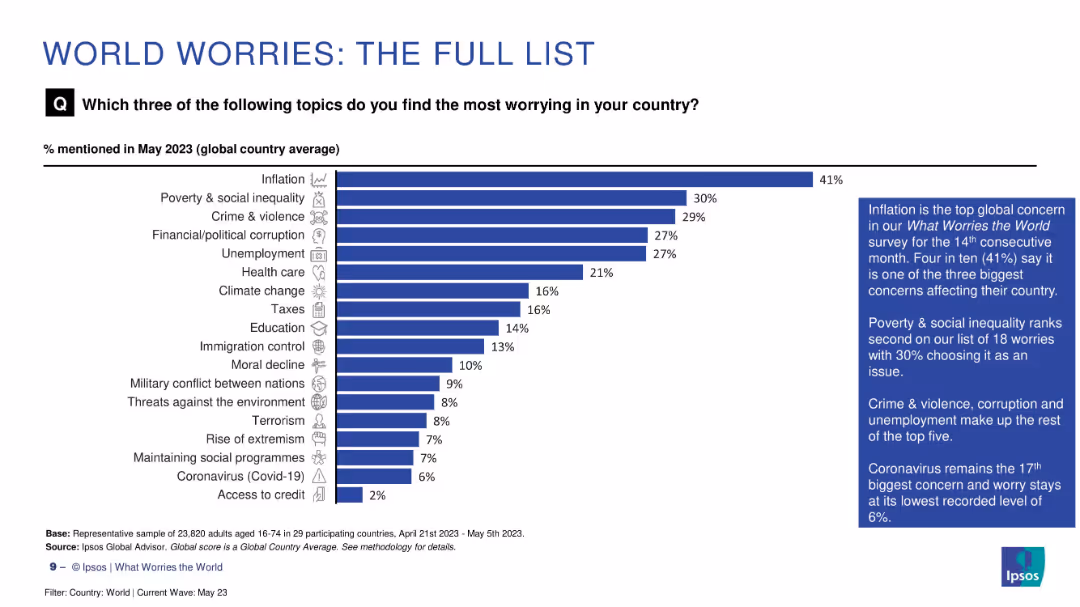
Vertical bar chart showing top 18 global concerns in descending order with annotated summary on the side
Market Analysis and Trends
Professional Services
This slide presents a ranked list of 18 key global worries. Inflation leads at 41%, followed by poverty, crime, and corruption. Less pressing concerns include extremism, terrorism, and COVID-19. Annotations summarize top themes and note declining concern levels for some long-standing issues.
global concerns, ranking, inflation, corruption, health
Mixed Chart
IPSOS
Saved
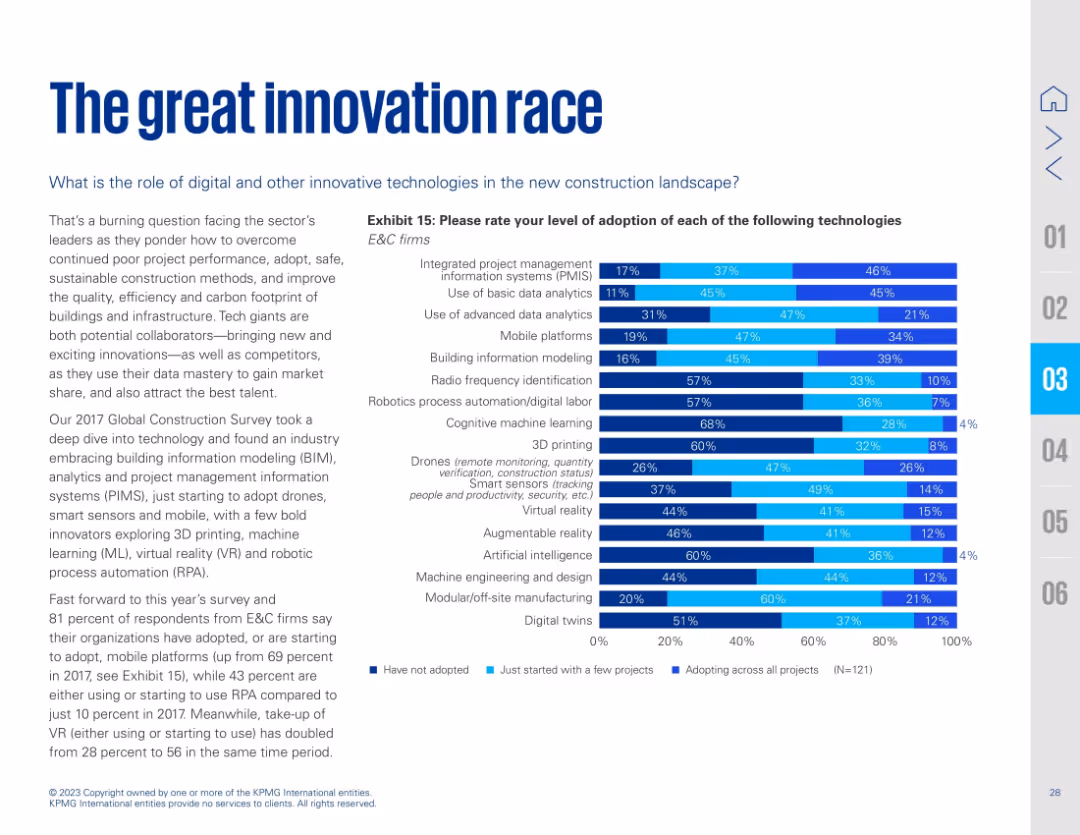
Bold blue title with introductory paragraph on left; large stacked bar chart (Exhibit 15) on right showing adoption of 15 digital technologies in E&C. Blue gradient indicates stages of adoption.
Technology and Digital Transformation
Technology & Software
This slide analyzes adoption rates of digital technologies in the E&C sector. It reveals significant growth in mobile platforms, VR, and robotics, with many firms now standardizing use of PMIS, analytics, and AI. The narrative frames innovation as a competitive advantage and necessity to overcome persistent industry challenges like inefficiency and sustainability.
digital transformation, construction tech, innovation, BIM, VR, robotics, AI, PMIS, analytics, E&C
Mixed Chart
KPMG
Saved
Previous
Next
If nothing, comes up, please save your slides first
Create a FREE account to continue browsing
Receive Instant Access to 1,000+ slides from companies like McKinsey, Google, and Goldman Sachs
First Name
Last Name
Email
Password
I agree to all
Terms & Privacy Policy
Thank you! Your submission has been received!
Oops! Something went wrong while submitting the form.
Have an account?
Sign in
Column Chart
Heatmap
Chevron
Org Chart
Infographic
Callouts
Timeline
List
Graphic
Picture
Process Flow
Diagram
Paragraph
Map
Table
Framework
Subtitle
Takeaway Box
Icon
Other Chart
Radar Chart
Waterfall Chart
Mekko Chart
Pie Chart
Scatter Plot
Line Chart
Bar chart
Bullet points