My Account
My Slides
Search by Category
Templates
Leave Feedback
Login
Logout
Get Started
Browse all Slides
Browse all Slides
Create a FREE Account
Instant access to 1,000+ real slides from top companies like McKinsey, BCG, Goldman Sachs, Google and many more!
First Name
Last Name
Email
Password
I agree to all
Terms & Privacy Policy
Thank you! Your submission has been received!
Oops! Something went wrong while submitting the form.
Have an account?
Sign in
Saved Slides
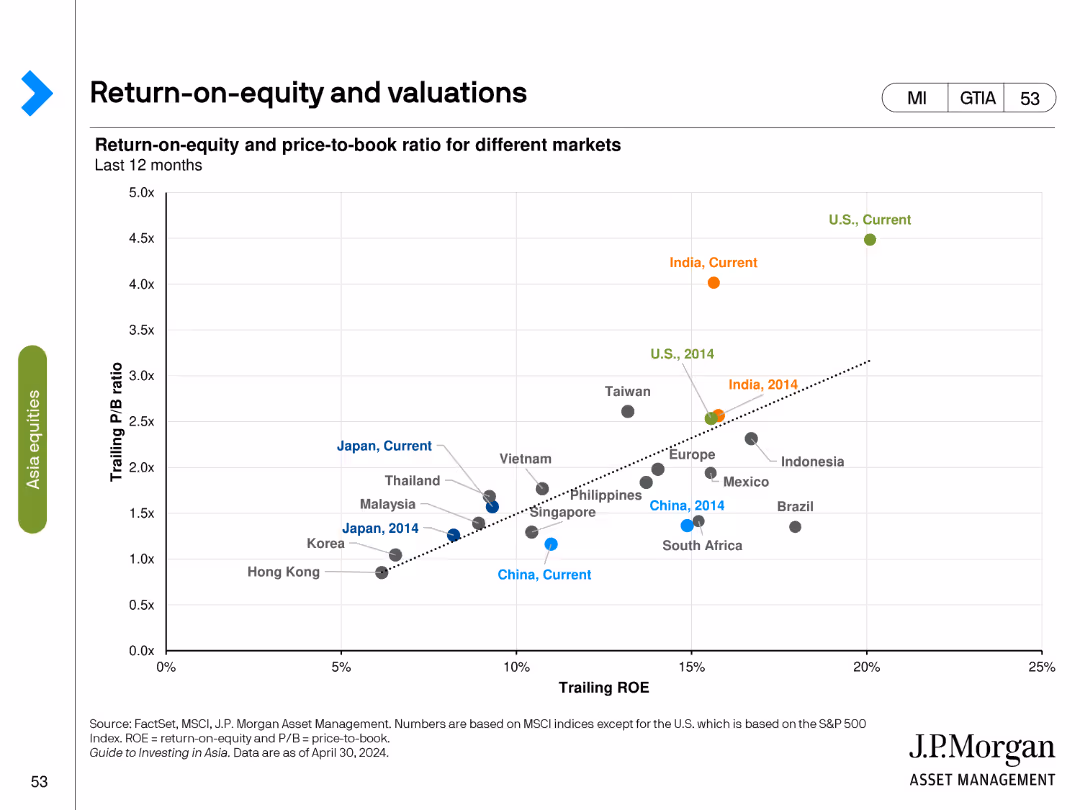
Scatter plot showing return-on-equity (ROE) and price-to-book (P/B) ratios for different markets over the last 12 months.
Investment Analysis
Financial Services
Examines ROE and P/B ratios to assess market valuations, comparing current data with historical benchmarks to evaluate market performance.
ROE, P/B ratio, scatter plot, market valuation, financial metrics, investment analysis, historical comparison, global markets
Single Chart
JP Morgan
Saved
This slide contains a column chart showing reasons for not buying crypto investment funds in 2022 and 2023, with percentages and demographic variations.
Risk Assessment and Management
Financial Services
The slide details why respondents avoid crypto investment funds, citing reasons such as high risk, volatility, lack of government guarantees, and insufficient market knowledge.
Crypto funds, non-purchase, reasons, risk, 2023, 2022, government guarantees, volatility, knowledge
Multiple Chart
IPSOS
Saved
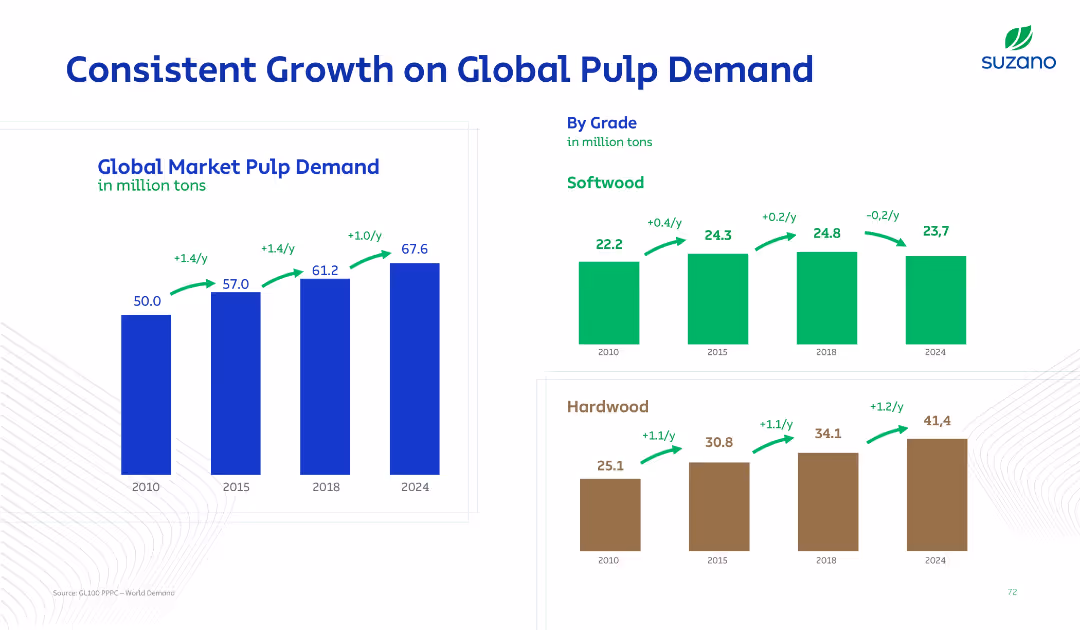
Three-bar charts: global market pulp growth and breakdowns by softwood and hardwood. Arrows and year-by-year data points show clear annual growth rates.
Market Analysis and Trends
Industrial & Manufacturing
Global market pulp demand is shown to steadily increase from 2010 to 2024, with distinct breakdowns for softwood and hardwood pulp. Growth rates are marked, highlighting yearly demand trends by grade.
global demand, pulp, softwood, hardwood, annual growth, trends, market analysis, forecast
Multiple Chart
Goldman Sachs
Saved
Features a multi-line chart depicting responses on strategic intent for D&I, with specific focus differences by region and demographic, annotated for clarity.
Strategic Planning
Professional Services
Focuses on the perceptions of U.S. non-minority women regarding strategic intent in D&I, suggesting areas for improvement.
D&I, strategic intent, U.S., non-minority women, line chart, improvement areas, demographic focus
Mixed Chart
Accenture
Saved
The slide includes a column chart depicting the percentage of people receiving various types of help, comparing data from May and December. Text boxes highlight key percentages.
Client Case Studies
Healthcare & Pharmaceuticals
This slide presents data on the types of help received by people in the last month, comparing survey results from May and December, with a focus on the percentage of people receiving different types of help.
help, survey, received, comparison, types of help, column chart, healthcare, public opinion, time periods
Single Chart
IPSOS
Saved
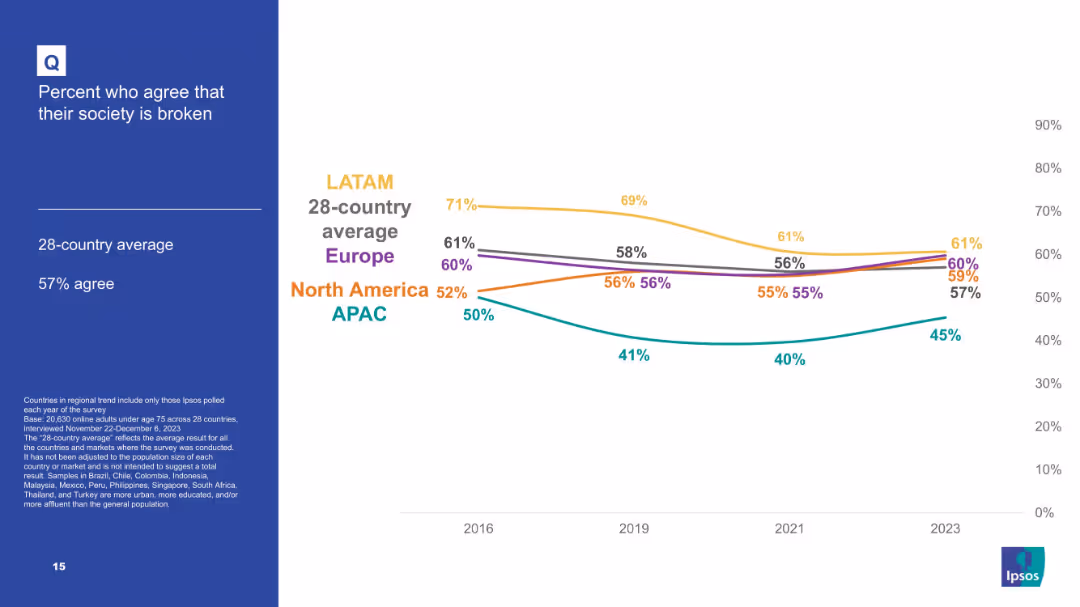
Line chart showing regional averages (LATAM, Europe, etc.) on a clean white background with regional color codes.
Market Analysis and Trends
Government & Public Sector
This slide compares regional perceptions of societal breakdown from 2016 to 2023. LATAM consistently scores the highest agreement that society is broken, while APAC shows lower but rising concern over the years.
regional trends, political pessimism, LATAM vs APAC, Ipsos tracking, societal issues, public view, system distrust
Mixed Chart
IPSOS
Saved
The slide features a circular diagram representing Booz Allen's ESG governance structure, including roles of the Board of Directors, ESG Committee, ESG Council, and ESG Team.
Regulatory and Compliance
Professional Services
This slide explains Booz Allen's ESG governance, detailing the roles and responsibilities of the Board of Directors, ESG Committee, ESG Council, and ESG Team in managing ESG topics.
Booz Allen, ESG governance, ESG Committee, Board of Directors, compliance
Diagram
Booz Allen Hamilton
Saved
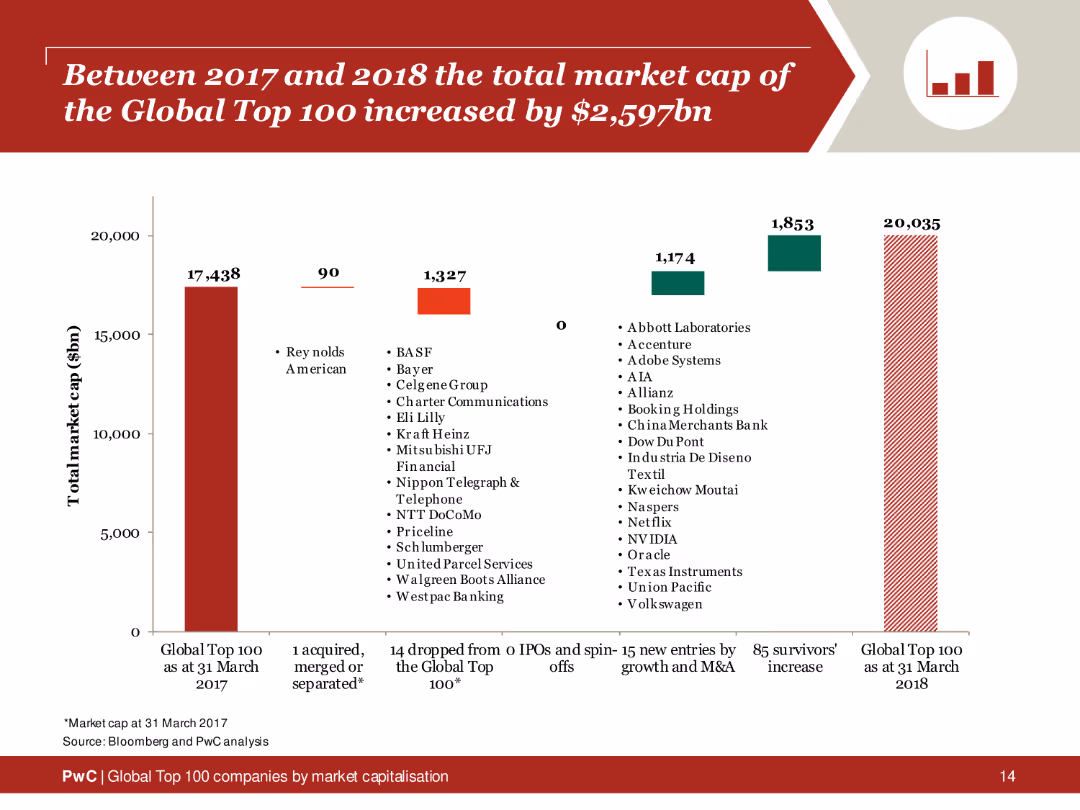
Column chart depicting changes in the total market cap of the Global Top 100 companies from 2017 to 2018, with sections showing new entries and survivors.
Financial Performance
Financial Services
Analysis of the market cap increase of the Global Top 100 companies, showing growth driven by new entries and existing companies.
market cap, global top 100, 2017, 2018, increase
Single Chart
PwC/Strategy&
Saved
This slide includes a horizontal bar chart showing preferred channels for purchasing new cars, alongside a column chart comparing preferences across different generations.
Market Analysis and Trends
Transportation & Logistics
It analyzes consumer preferences for purchasing new cars, emphasizing the importance of dealerships and showrooms, and compares generational differences in buying preferences.
purchasing channels, car buyers, generational differences, dealerships, showrooms
Multiple Chart
EY
Saved
The slide uses a combination of column charts and text to compare historical growth, COVID-19 impact, recovery, and long-term growth outlook from different sources like market participant interviews and end-user surveys.
Market Analysis and Trends
Energy & Utilities
The slide presents an analysis of the lighting solutions market forecast using data from market participant interviews, end-user surveys, and secondary research. It highlights growth trends and the impact of COVID-19 on the market.
Market forecast, growth outlook, COVID-19 impact, sources, lighting solutions
Multiple Chart
EY
Saved
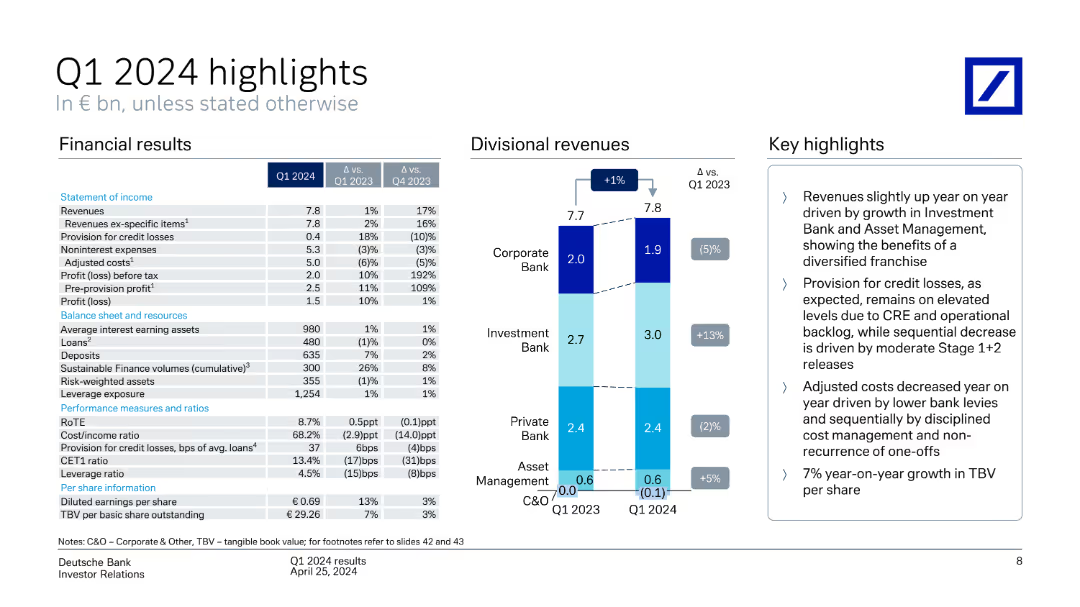
A column chart showing divisional revenues, a table with financial results, and key highlights on the right. The slide is moderately dense with a balanced mix of text and visual elements.
Financial Performance
Financial Services
The slide presents Q1 2024 financial highlights for Deutsche Bank, including revenue, profit, and balance sheet metrics. It compares performance across different divisions and provides key insights.
Financial results, divisional revenues, profit, revenue, Q1 2024 highlights
Mixed Chart
Deutsche Bank
Saved
The slide includes a quote from Ariane Le Port and a column chart showing organic Q1 growth in TMT vs. total Ipsos.
Client Case Studies
Telecommunications
It highlights Ipsos's success with advanced TMT firms, including a quote from Google’s Creative Effectiveness Lead and growth data for the TMT sector.
TMT, growth, clients, revenues, Ipsos
Mixed Chart
IPSOS
Saved
Diagram illustrating various touch points in the human-machine relationship, including technological inequality, social media, future of work, biotechnology, and AI.
Technology and Digital Transformation
Technology & Software
The slide explores the complex interactions between humans and machines, emphasizing the need for society to adapt and shape technological advancements. It covers topics such as technological inequality, social media impact, future work scenarios, biotechnology, and AI integration.
Human-Machine Interaction, Technological Inequality, AI
Diagram
Roland Berger
Saved
The slide includes a column chart showing the increase in WM loans from 2019 to 2023, and text highlighting the growth in net new assets and revenues for current checking account holders.
Strategic Planning
Financial Services
The slide emphasizes the momentum to expand household lending and the impact on net new assets and revenues, showcasing significant growth in WM loans and household penetration.
Banking, Lending, Net New Assets, Revenues, WM Loans, Household Penetration, Column Chart, Morgan Stanley
Mixed Chart
Morgan Stanley
Saved
Contains bullet points and small icons that correspond to each section, using a clean and professional layout with blue accents to highlight key aspects.
Strategic Planning
Professional Services
Highlights the unique aspects of Alvarez & Marsal's approach to business challenges, including leadership focus, managing complexity, and a practical orientation towards results. The slide is structured to clearly delineate the company's strengths in handling complex business situations.
leadership, complexity management, business solutions, operational heritage
Header Vertical
Alvarez & Marsal
Saved
Continues demographic profiling with additional charts about the type of work, organization size, and full-time employment status, using a variety of chart types to present the data clearly and effectively.
Industry Overview
Government & Public Sector
Completes the demographic overview of the survey respondents by detailing their employment type, organization size, and whether they are engaged in full-time work. This information provides deeper insights into the employment conditions and contexts of the surveyed population, aiding in the analysis of broader workforce trends.
employment type, organization size, full-time status, demographic data
Multiple Chart
PwC/Strategy&
Saved
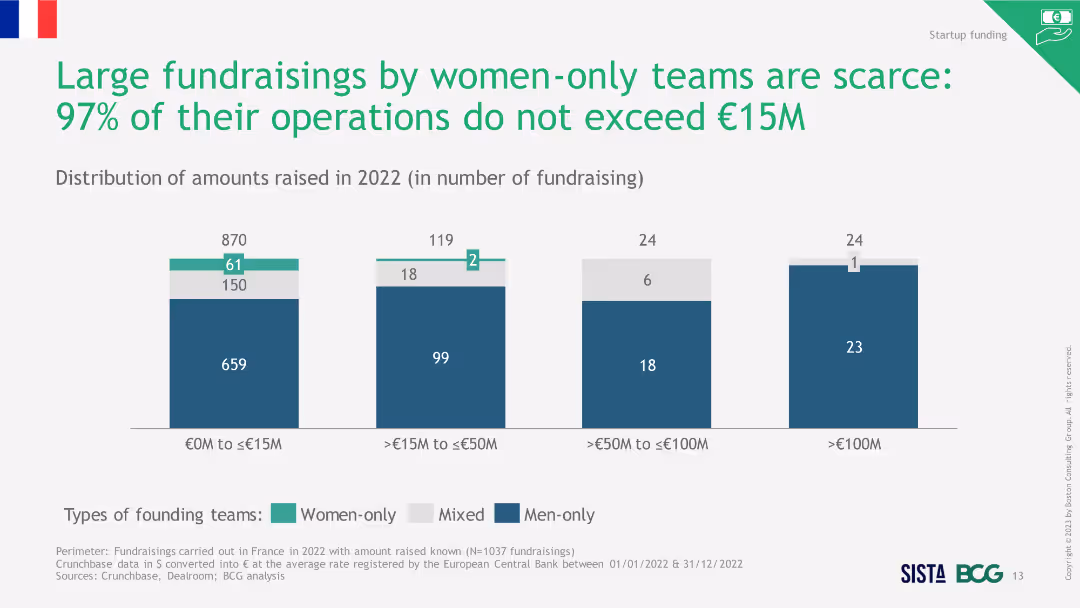
Column chart showing the distribution of amounts raised in 2022 by different founding teams, highlighting the scarcity of large fundraisings by women.
Investment Analysis
Financial Services
The slide emphasizes that large fundraisings by women-only teams are rare, with most fundraisings not exceeding €15M in 2022.
large fundraisings, women-only teams, scarcity, 2022
Single Chart
BCG
Saved
A content slide with text on the left and a column chart on the right. The chart shows areas with current or planned central team utilities.
Operational Efficiency
Financial Services
The slide addresses the future of shared utilities in risk management, focusing on areas like AI model risk management and data governance for centralized teams.
shared utility, risk management, AI, data governance, central teams
Mixed Chart
EY
Saved
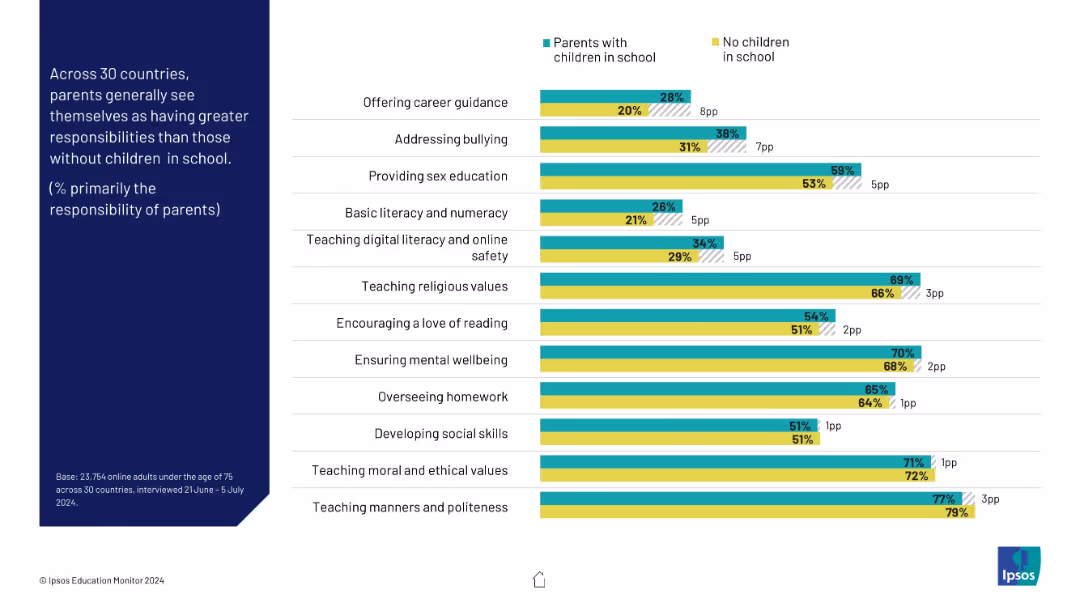
Split horizontal bar chart showing parent vs non-parent views on educational responsibility across topics
Organizational Structure and Change
Education & Training
This slide contrasts views of parents vs non-parents on who should be responsible for education-related tasks. Parents generally assign themselves more responsibility across categories like safety, literacy, and values.
parents, responsibilities, education, comparison, safety, digital literacy, school roles
Mixed Chart
IPSOS
Saved
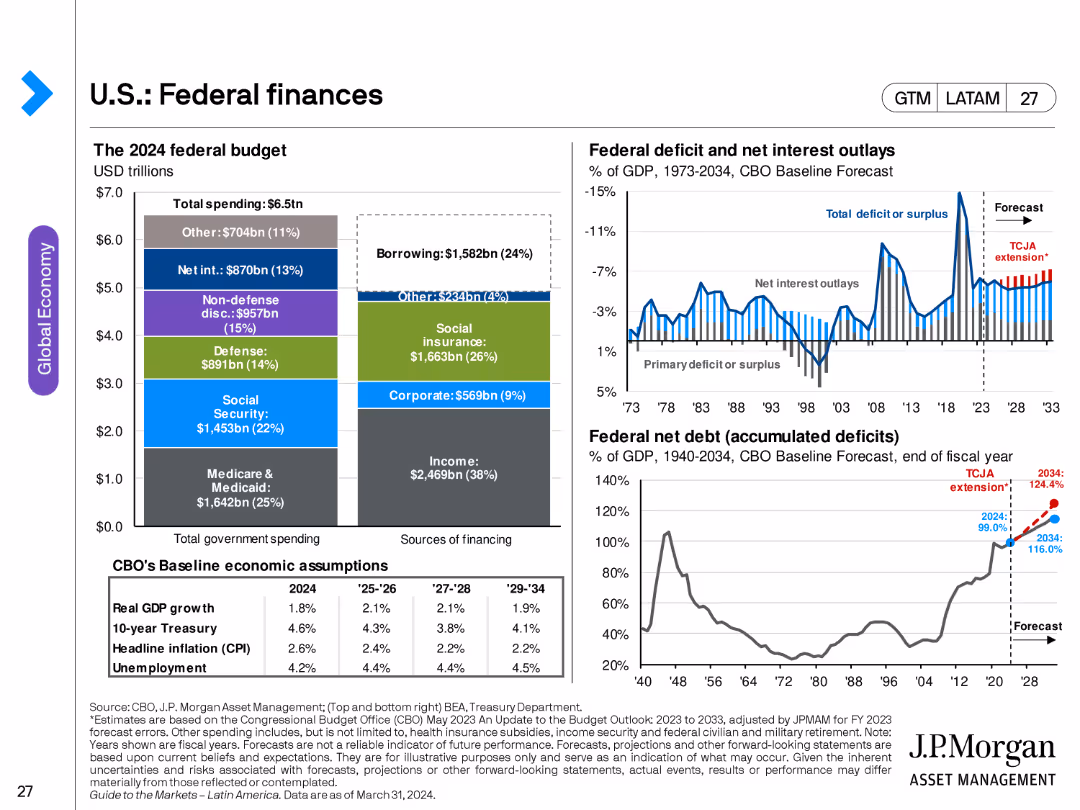
The slide features multiple charts: a pie chart showing the 2024 federal budget breakdown, a line chart for federal deficit and net interest outlays, and another line chart for federal net debt as a percentage of GDP.
Financial Performance
Government & Public Sector
This slide examines the U.S. federal finances, including budget allocation, deficit, and debt projections, providing insights into government spending and fiscal policy.
federal budget, deficit, debt, fiscal policy, government spending, U.S. finances
Multiple Chart
JP Morgan
Saved
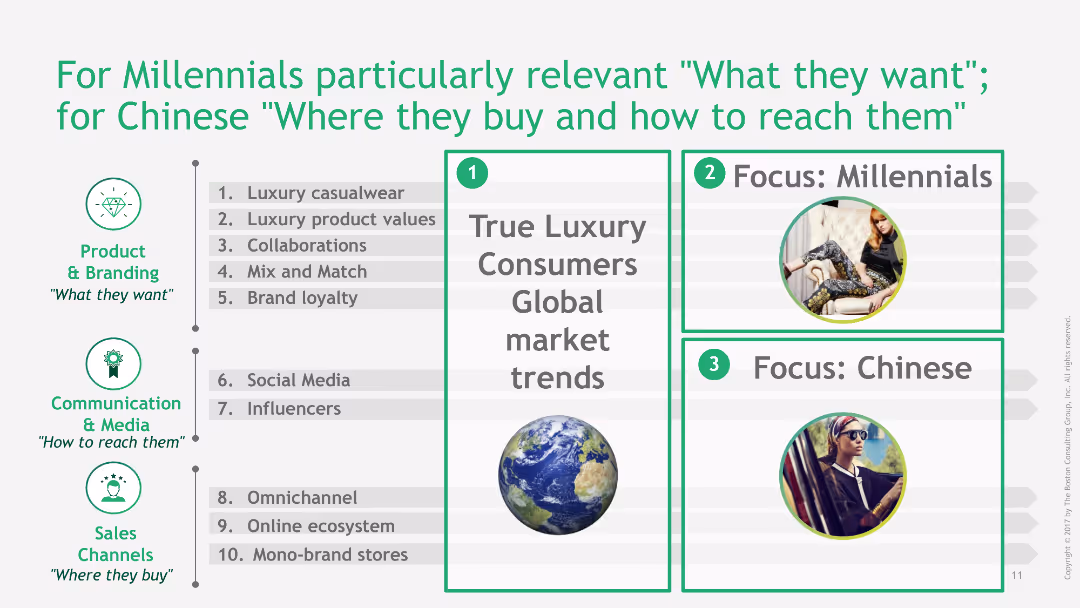
This slide is divided into three sections: global market trends, focus on Millennials, and focus on Chinese consumers. It uses text and images to emphasize key points.
Market Analysis and Trends
Consumer Goods
The slide focuses on the preferences and buying behaviors of Millennials and Chinese consumers, identifying specific trends and strategies to target these demographics effectively.
millennials, Chinese consumers, market trends, buying behavior, targeting strategy
Header Vertical
BCG
Saved
Various pie charts and maps showing the composition of survey respondents by jurisdiction, title/role, revenue, and industry sectors.
Market Analysis and Trends
Professional Services
This slide provides an overview of survey respondents' profiles, including their jurisdiction, revenue, roles, and industry sectors, offering insights into the survey's demographic.
Survey, respondents, jurisdiction, revenue, roles, industry, composition, demographics, analysis, profile
Multiple Chart
EY
Saved
The slide features a prominent image of a man writing, large text, and a two-tone circle graph. It uses high contrast and minimalistic design elements.
Operational Efficiency
Professional Services
The slide presents statistical data on the failure rate of organizational transformations, highlighting that 70% fail and only 30% reach their full potential. This slide could be used in strategic planning and change management meetings.
transformation, failure, statistics, organizations, change management, strategy, professional services, data presentation
Single Chart
McKinsey
Saved
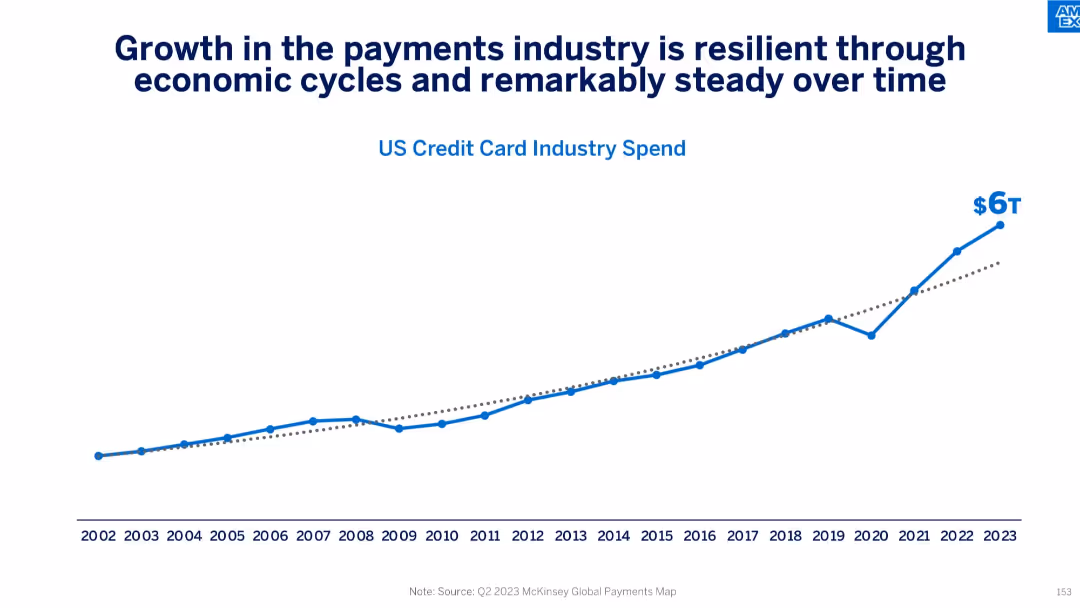
Line graph showing historical growth in US credit card industry spend from 2002 to 2023, reaching $6T in 2023.
Market Analysis and Trends
Financial Services
This slide emphasizes the resilience and consistent growth of the U.S. credit card industry despite economic cycles. With spend rising from under $1T in 2002 to $6T in 2023, it underlines the industry's long-term momentum and consumer reliance on credit-based transactions.
payments industry, growth trend, credit card spend, economic cycles, resilience, US market, long-term trends
Single Chart
McKinsey
Saved
The slide features two column charts comparing Booz Allen's total shareholder returns to core peers and broader indexes over one-, three-, and five-year periods. The bars are clearly labeled with percentages and time frames.
Investment Analysis
Financial Services
This slide highlights Booz Allen's market performance, illustrating total shareholder returns compared to core peers and broader indexes. It underscores the company's strong financial performance and effective capital management over different periods.
shareholder returns, market performance, investment, comparison
Multiple Chart
Booz Allen Hamilton
Saved
Previous
Next
If nothing, comes up, please save your slides first
Create a FREE account to continue browsing
Receive Instant Access to 1,000+ slides from companies like McKinsey, Google, and Goldman Sachs
First Name
Last Name
Email
Password
I agree to all
Terms & Privacy Policy
Thank you! Your submission has been received!
Oops! Something went wrong while submitting the form.
Have an account?
Sign in
Column Chart
Heatmap
Chevron
Org Chart
Infographic
Callouts
Timeline
List
Graphic
Picture
Process Flow
Diagram
Paragraph
Map
Table
Framework
Subtitle
Takeaway Box
Icon
Other Chart
Radar Chart
Waterfall Chart
Mekko Chart
Pie Chart
Scatter Plot
Line Chart
Bar chart
Bullet points