My Account
My Slides
Search by Category
Templates
Leave Feedback
Login
Logout
Get Started
Browse all Slides
Browse all Slides
Create a FREE Account
Instant access to 1,000+ real slides from top companies like McKinsey, BCG, Goldman Sachs, Google and many more!
First Name
Last Name
Email
Password
I agree to all
Terms & Privacy Policy
Thank you! Your submission has been received!
Oops! Something went wrong while submitting the form.
Have an account?
Sign in
Saved Slides
Moderate complexity with text blocks and icons representing government, schools, and EdTech solution providers. There's a balance between text information and visual elements.
Industry Overview
Education & Training
Slide details the efforts by the public and private sectors to create alternatives to face-to-face learning, featuring case studies from Singapore, Malaysia, and Indonesia.
F2F alternatives, government, schools, EdTech providers
Header Horizontal
Bain
Saved
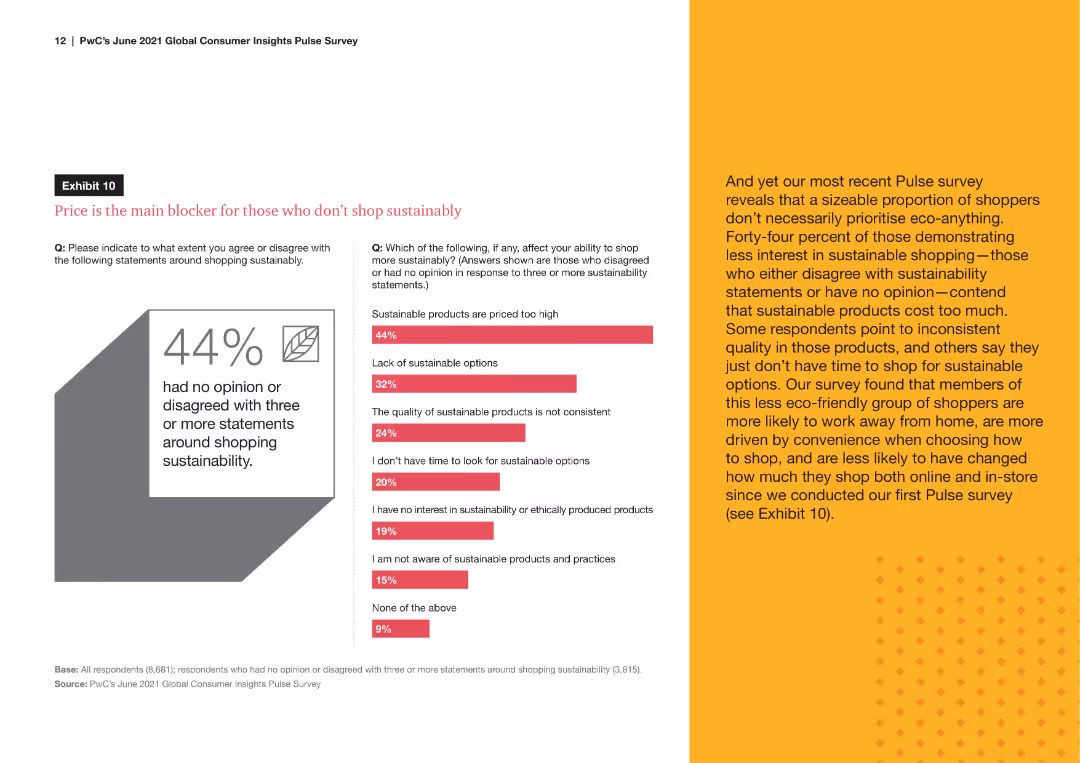
A line chart comparing the percentage of remote workers versus those working away from home who engage in sustainable shopping behaviors, such as buying eco-friendly products and checking for sustainability certifications.
Market Analysis and Trends
Consumer Goods
The slide analyzes the sustainable shopping behaviors of remote workers compared to those who work away from home, showing trends in eco-friendly purchasing and awareness of product sustainability.
sustainable behaviors, remote workers, eco-friendly, shopping habits, sustainability awareness
Mixed Chart
PwC/Strategy&
Saved
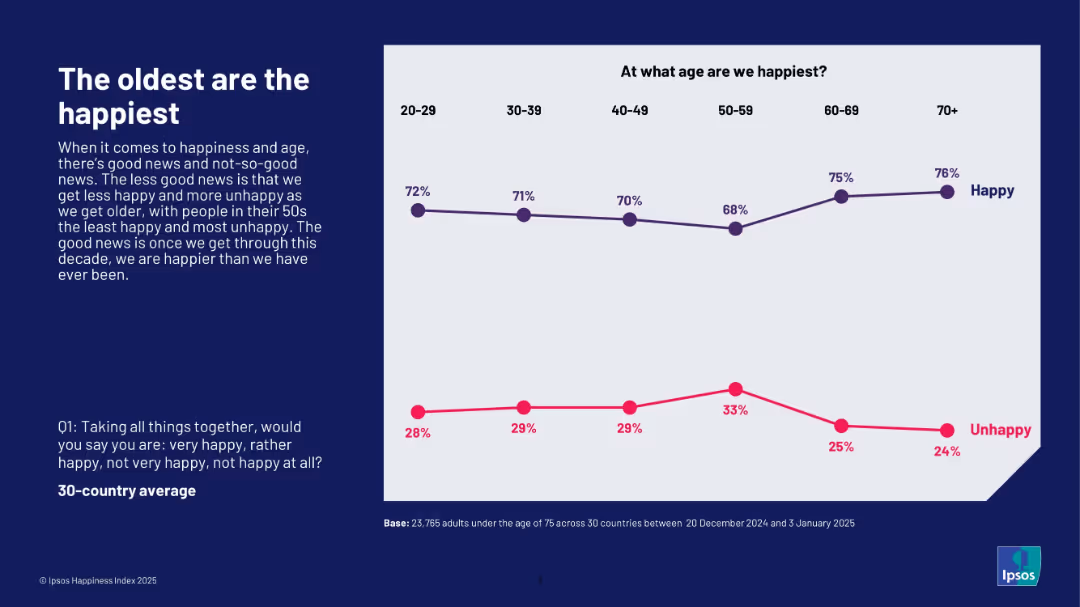
Line chart tracking happiness and unhappiness percentages across six age brackets; left-aligned explanation in dark blue box.
Market Analysis and Trends
Professional Services
This slide illustrates that people aged 70+ report the highest happiness, while those in their 50s are the least happy. Happiness decreases from age 20 to 50 but rises again in older age groups. It highlights the age-related trend in happiness perception based on the Ipsos Happiness Index 2025.
age, happiness trend, senior well-being, Ipsos, generational analysis, 2025, emotional health, survey
Mixed Chart
IPSOS
Saved
Half of the slide shows an image of hands exchanging a package, symbolizing supply chain activity. The other half lists six key steps with associated icons, designed to enhance supply chain security and efficiency.
Risk Assessment and Management
Transportation & Logistics
Offers recommendations on improving supply chain management, focusing on diversity, visibility, logistics optimization, ecosystem development, data monitoring, and ESG agenda. The slide is likely used in discussions about strengthening supply chain resilience in the face of increasing complexity and disruption.
Supply Chain, Security, Efficiency, Resilience, ESG
Boxed
Bain
Saved
A circular diagram in the center with icons around representing different stakeholders, text on left
Client Case Studies
Professional Services
Details the involvement of various stakeholders in EY, emphasizing internal and external communication
Stakeholders, engagement, EY, communication, plan
Diagram
EY
Saved
This slide uses column charts to illustrate past and projected shareholder distributions, emphasizing growth in dividends with a clean, professional layout.
Financial Performance
Financial Services
Illustrates Deutsche Bank's historical and future shareholder distribution plans, emphasizing increased dividends and buy-backs.
Shareholder, dividends, Deutsche Bank, distribution, growth, financial planning, buy-backs
Multiple Chart
Deutsche Bank
Saved
Contains a grid layout showing the maturity of loyalty programs across various industries with color-coded maturity levels.
Strategic Planning
Retail & E-commerce
Summarizes the state of loyalty programs in industries such as retail, CPG, and BFSI, suggesting potential for strategic improvements.
loyalty programs, industry comparison, strategic planning, maturity levels, grid
Table
BCG
Saved
Consists of pie charts and bar graphs, a table, and a key point section, all maintaining a professional blue, gray, and white color scheme.
Investment Analysis
Financial Services
Analyzes asset management investment distribution by sector and geography, offering insights for strategic investment decisions.
Asset, Management, Investment, Distribution, Sector, Geography, Analysis, Insights, Strategic, Decisions
Multiple Chart
Goldman Sachs
Saved
This title slide features a futuristic design with a photo of three people on a bridge, overlaid with transparent, wavy design elements. The presentation's title, "Total Enterprise Reinvention," is placed prominently in the foreground, along with the Accenture logo and event information, "WEF 2023."
Organizational Structure and Change
Technology & Software
As an introductory slide, it sets the theme for a discussion on comprehensive organizational change driven by digital innovation, apt for stakeholders and decision-makers considering transformative strategies for growth and performance improvement within their companies.
enterprise reinvention, Accenture, WEF 2023, digital transformation, innovation
Title
Accenture
Saved
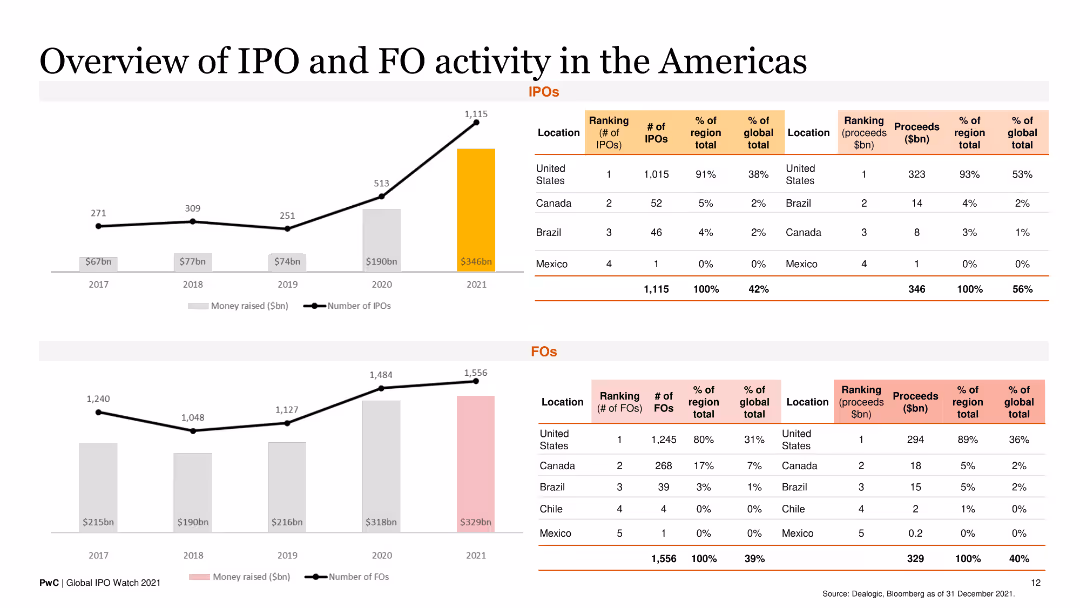
This slide has a combination of line charts and bar charts detailing the number and proceeds of IPOs and FOs in the Americas from 2017 to 2021, with a regional breakdown.
Market Analysis and Trends
Financial Services
It offers insights into the IPO and FO activities specific to the Americas, including regional rankings and proceeds, beneficial for market analysis.
IPOs, FOs, Americas, regional trends, financial analysis
Multiple Chart
PwC/Strategy&
Saved
This slide shows a combination of line and column charts tracking growth and returns over the years, specifically highlighting the receivables CAGR and RoTE. It uses a blue color theme that is consistent with the corporate branding, and the charts are well-organized to depict trends clearly.
Financial Performance
Financial Services
Reviews Barclays' historical financial performance, emphasizing growth in receivables and RoTE over time. It highlights the impact of external factors like COVID-19 and shows the company's resilience and capacity for recovery.
financial growth, RoTE, receivables, historical data, COVID-19
Single Chart
Barclays
Saved
A photo of Cologne Cathedral with a graph showing Germany's GDP growth and a detailed text explanation.
Market Analysis and Trends
Financial Services
This slide discusses Germany's economic conditions, highlighting GDP growth trends and the impact of COVID-19 on the economy.
Germany, GDP growth, economy, financial services, market analysis
Multiple Chart
Deloitte
Saved
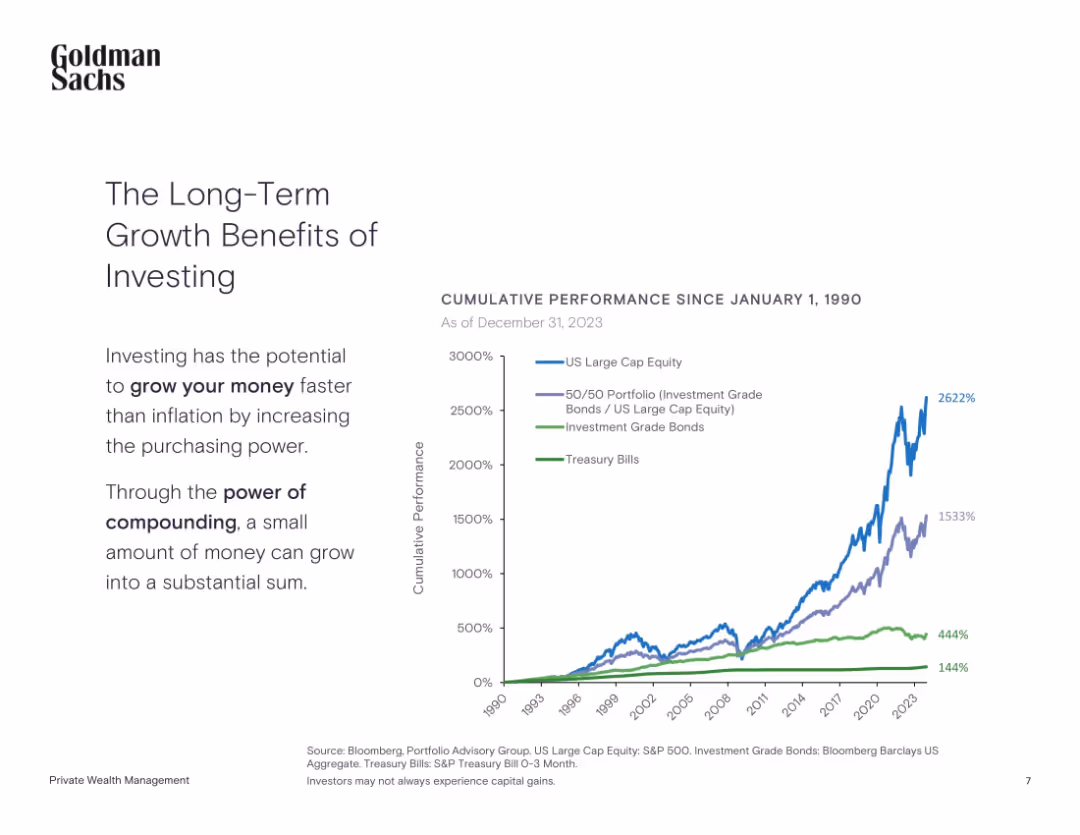
Left-aligned text with a line chart showing cumulative performance since 1990
Investment Analysis
Financial Services
The slide highlights the power of long-term investing by comparing cumulative returns from equities, bonds, and treasury bills since 1990.
Long-Term Investing, Compounding, Equities, Bonds, Treasury, Performance
Mixed Chart
Goldman Sachs
Saved
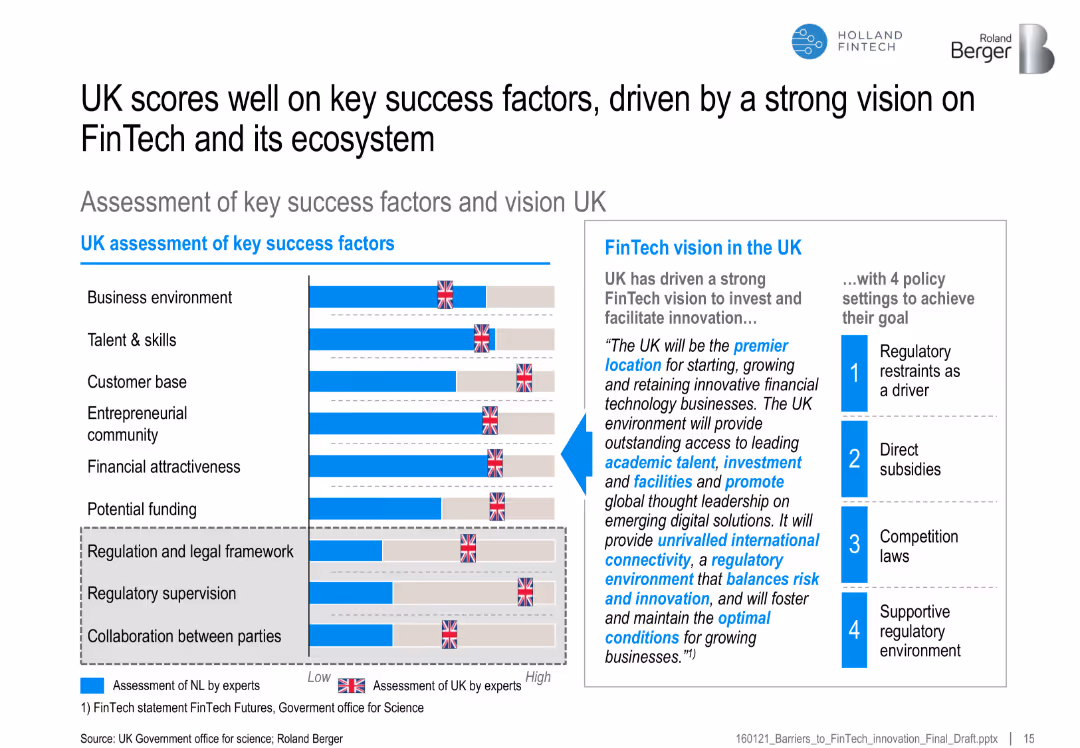
Bar chart of UK vs. benchmark on FinTech success factors, with a vision statement and four supporting policy actions
Strategic Planning
Financial Services
Highlights the UK’s strong performance across FinTech-enabling factors, backed by a clear vision and regulatory framework, promoting its position as a FinTech hub.
UK FinTech, ecosystem, regulatory vision, success factors, funding, policy, entrepreneurship, talent
Mixed Chart
Roland Berger
Saved
Bar chart showing percentages of cybersecurity breach experiences, with supporting text explanation.
Risk Assessment and Management
Financial Services
Details the cybersecurity threat experiences of APAC family offices, including the timeline and frequency of breaches.
cybersecurity, breaches, APAC, family offices, data security
Mixed Chart
EY
Saved
Column chart of profit distribution, infographic elements
Financial Performance
Financial Services
Santander's growth in customer focus and diversification
Growth, Diversification, Customer Focus, Banking, Profit
Mixed Chart
Morgan Stanley
Saved
Slide presents a combined column and line chart with annual data from 2015 to 2024. Gray columns represent total global E&M revenue, with an overlaid line chart depicting annual growth rates in orange for negative values and green for positive values. Key years and percentage changes are highlighted, enhancing clarity.
Market Analysis and Trends
Media & Entertainment
This slide discusses the fluctuating trends in global entertainment and media (E&M) revenue, highlighting a significant decline in 2020 followed by a recovery phase. It is designed to analyze economic impacts on the industry, suitable for strategic planning in financial forecasting and market response strategies within the E&M sector.
E&M, revenue, growth, decline, forecast
Single Chart
PwC/Strategy&
Saved
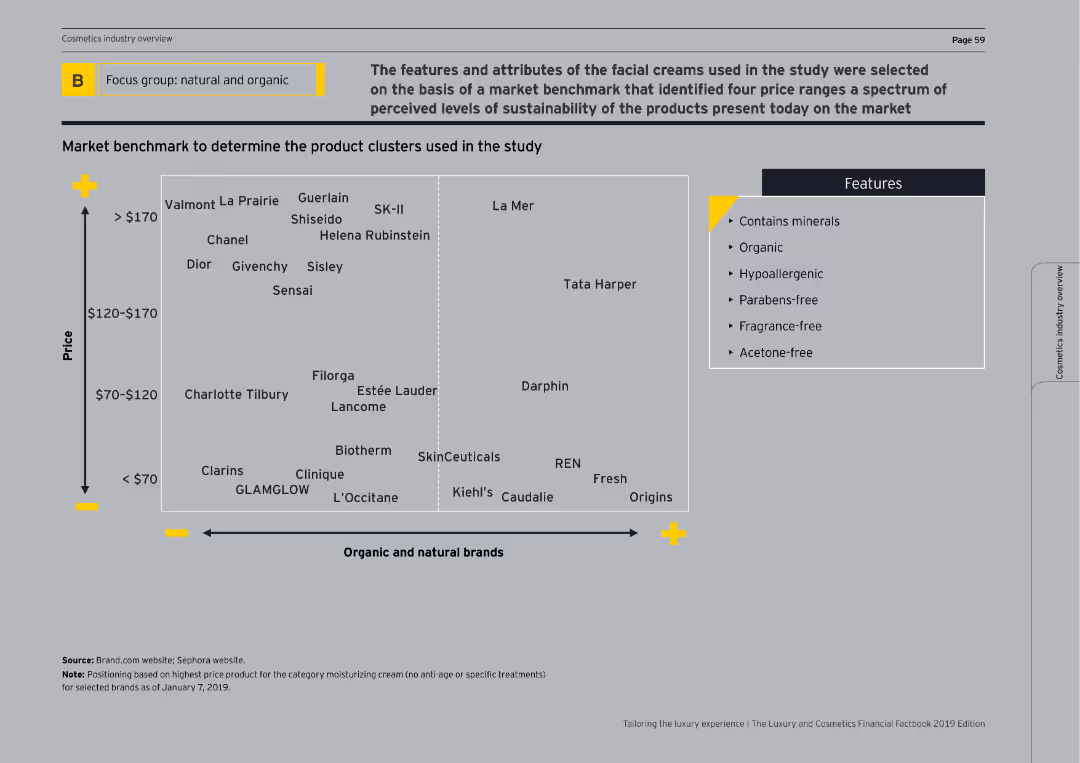
The slide shows a 2x2 matrix comparing the price and sustainability features of various beauty brands. It includes a legend for product features.
Competitive Landscape
Consumer Goods
This slide benchmarks facial creams based on price and sustainability features, positioning various brands on a matrix to illustrate market clusters.
benchmark, facial creams, price, sustainability, matrix
Mixed Chart
EY
Saved
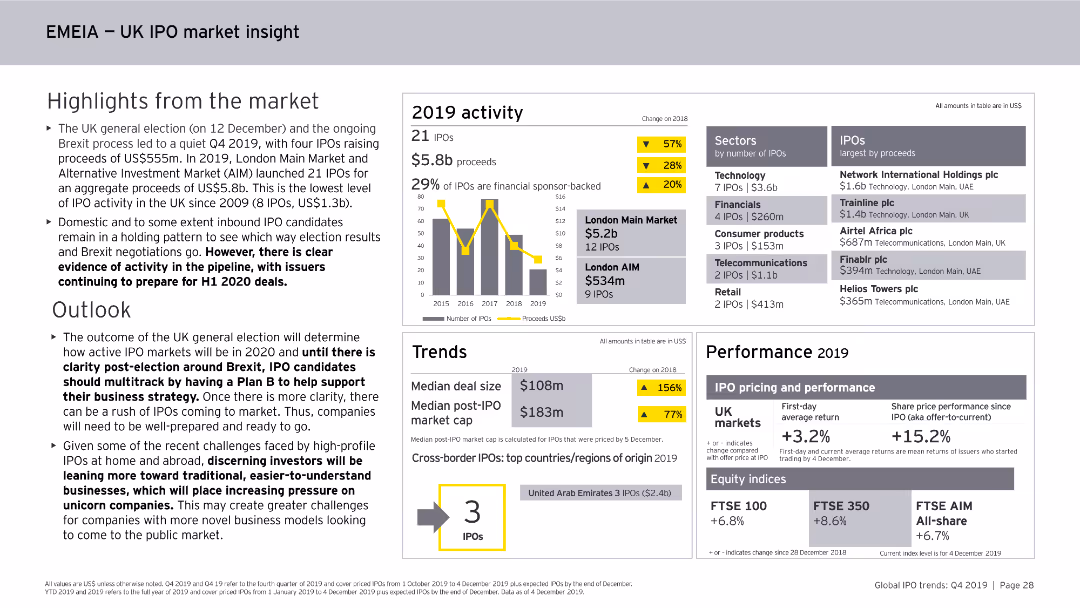
This slide features column charts, numerical data points, and textual highlights. It focuses on the UK IPO market within the EMEIA region, covering activity levels, sectors, and performance metrics for 2019.
Market Analysis and Trends
Financial Services
The slide summarizes the UK IPO market within the EMEIA region for 2019, noting the number of IPOs, proceeds, sector activity, performance metrics, and the outlook for 2020.
UK, IPO, EMEIA, Market Analysis, Financial Services, Trends, Activity, Sectors, 2019
Mixed Chart
EY
Saved
Two large column charts detailing population and spending, accompanied by a colored map of Indonesia showing school connectivity rates. Visual elements are clear and neatly organized, using blues and oranges to differentiate data points.
Strategic Planning
Education & Training
Explains the connectivity challenges faced by schools across various Indonesian islands, showing the correlation between population size, economic contributions, and school connectivity.
school connectivity, population data, economic analysis, Indonesia, mapping
Multiple Chart
BCG
Saved
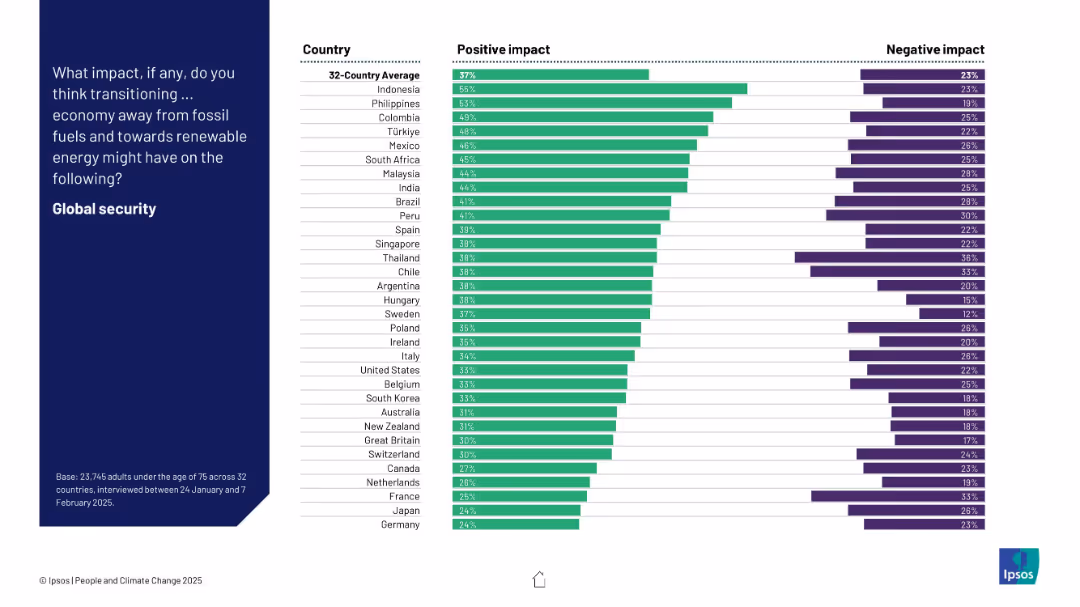
Bar chart comparing 32 countries’ responses; green bars for positive impact, purple bars for negative; left-aligned question prompt.
Market Analysis and Trends
Environmental Services & Sustainability
This slide shows public perception across 32 countries on the impact of transitioning from fossil fuels to renewable energy on global security. It visualizes both positive and negative perceptions.
global security, renewable energy, fossil fuels, climate transition, public opinion, Ipsos, global survey, sustainability, energy policy, bar chart
Mixed Chart
IPSOS
Saved
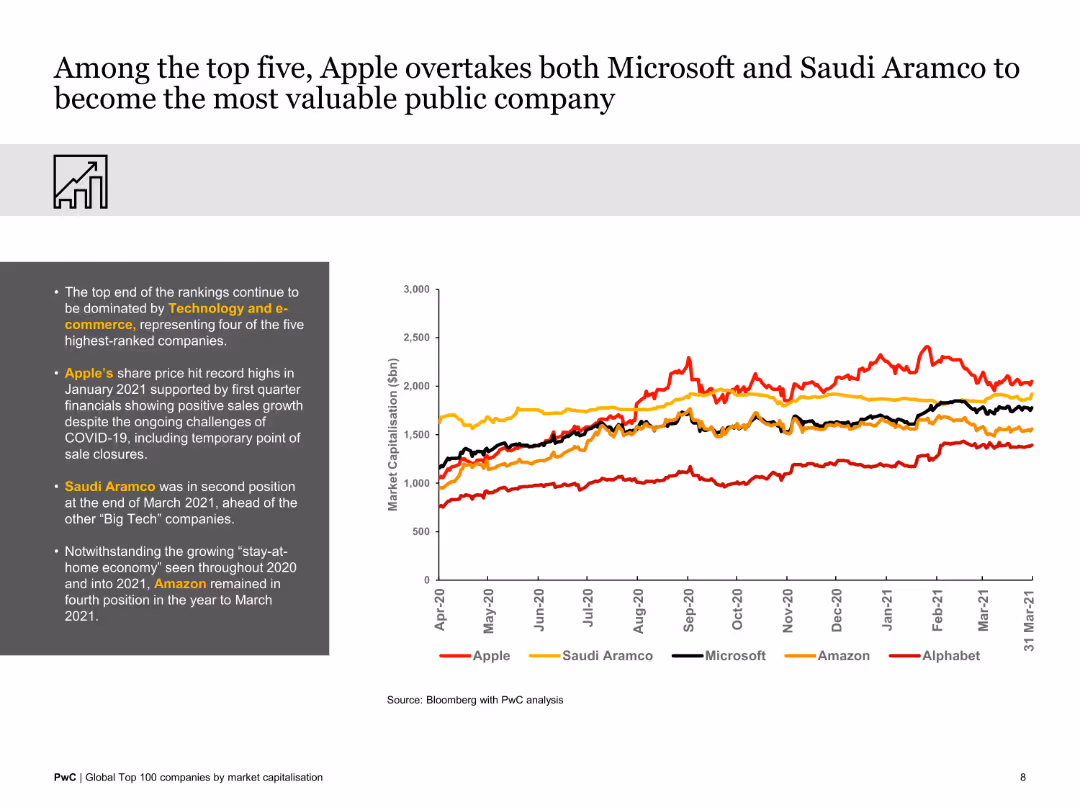
The slide features a line graph comparing the market capitalizations of top tech companies over a year. The visual is clean and focused on trends among the top five companies.
Market Analysis and Trends
Technology & Software
This slide illustrates how Apple surpassed Microsoft and Saudi Aramco to become the most valuable public company, highlighting trends from April 2020 to March 2021.
Apple, Microsoft, Saudi Aramco, market value, tech companies, 2020-2021, comparative analysis
Mixed Chart
PwC/Strategy&
Saved
A content slide featuring text on the left and a column chart on the right. The chart shows expected changes in FTE risk management professionals over the next five years.
Human Resources and Talent Management
Financial Services
The slide discusses the projected increase in risk management resources in banks' first and second lines of defense, highlighting expected headcount changes.
resources, FTE, risk management, first line, second line
Multiple Chart
EY
Saved
The slide showcases multiple column charts with financial metrics such as invested assets, deposits, loans, and revenues across different business units. It features clear numerical data and graphical elements.
Strategic Planning
Financial Services
It highlights the commercial momentum by presenting key financial metrics, emphasizing growth in invested assets, net new money, and other financial indicators.
commercial momentum, financial metrics, assets, deposits, loans
Multiple Chart
UBS
Saved
Diagrams and bullet points detail efficiency measures, capital efficiency, and revenue growth strategies.
Strategic Planning
Financial Services
Discusses strategic initiatives aimed at enhancing operational and capital efficiency, crucial for strategic management and investor relations.
strategy, efficiency, revenue growth, capital, management
Mixed Chart
Deutsche Bank
Saved
Previous
Next
If nothing, comes up, please save your slides first
Create a FREE account to continue browsing
Receive Instant Access to 1,000+ slides from companies like McKinsey, Google, and Goldman Sachs
First Name
Last Name
Email
Password
I agree to all
Terms & Privacy Policy
Thank you! Your submission has been received!
Oops! Something went wrong while submitting the form.
Have an account?
Sign in
Column Chart
Heatmap
Chevron
Org Chart
Infographic
Callouts
Timeline
List
Graphic
Picture
Process Flow
Diagram
Paragraph
Map
Table
Framework
Subtitle
Takeaway Box
Icon
Other Chart
Radar Chart
Waterfall Chart
Mekko Chart
Pie Chart
Scatter Plot
Line Chart
Bar chart
Bullet points