My Account
My Slides
Search by Category
Templates
Leave Feedback
Login
Logout
Get Started
Browse all Slides
Browse all Slides
Create a FREE Account
Instant access to 1,000+ real slides from top companies like McKinsey, BCG, Goldman Sachs, Google and many more!
First Name
Last Name
Email
Password
I agree to all
Terms & Privacy Policy
Thank you! Your submission has been received!
Oops! Something went wrong while submitting the form.
Have an account?
Sign in
Saved Slides
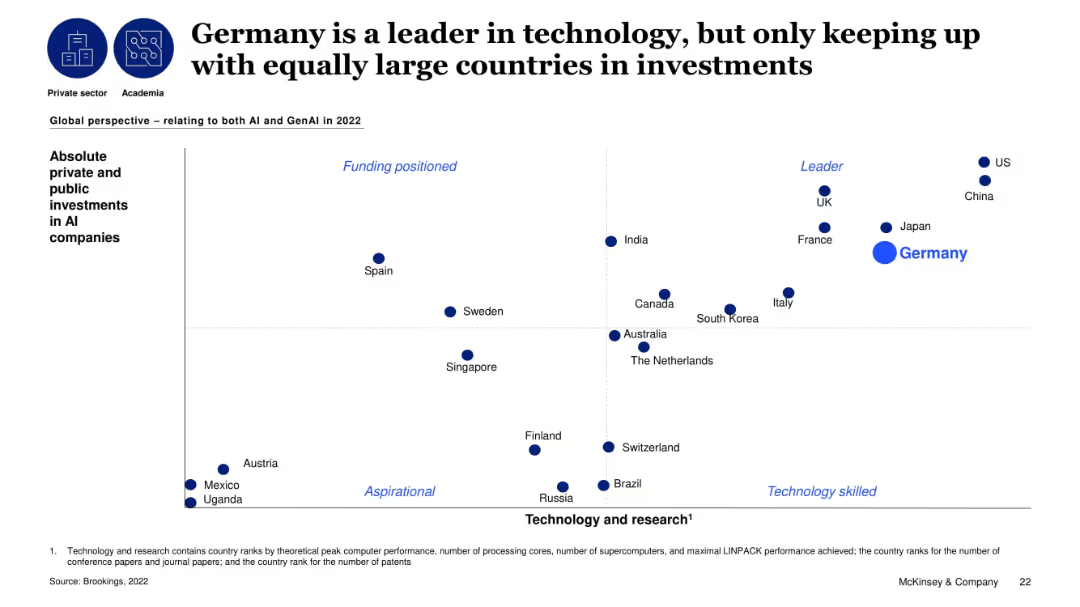
Global scatterplot comparing countries on AI investments vs. tech/research capabilities; Germany is large but middle-tier.
Investment Analysis
Artificial Intelligence
The slide maps countries based on their technology strength and AI investment levels. Germany appears as a tech leader but lags behind nations like the US and China in investment. The visual reinforces the point that Germany needs to increase AI investment to match its technical capability.
AI investment, Germany, global comparison, technology, research, funding, public-private
Single Chart
McKinsey
Saved
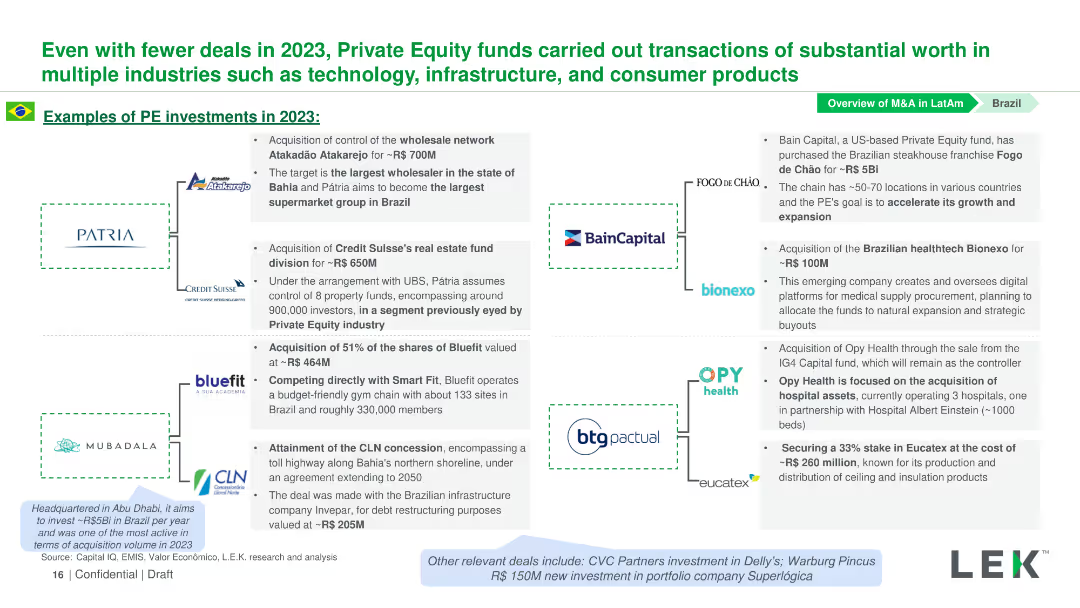
Contains logos of companies involved in PE investments in 2023, with text descriptions next to each logo detailing the investments.
Investment Analysis
Financial Services
This slide details notable PE investments in Brazil in 2023 across various industries, including technology, infrastructure, and consumer products.
Private Equity, Investments, Brazil, Technology, Infrastructure
Diagram
LEK
Saved
This slide presents column charts evaluating leadership confidence in understanding the risks of automating work and the effectiveness of communication on the impact of technology.
Market Analysis and Trends
Professional Services
Explores leaders' preparedness and strategic planning regarding the integration of technology and automation in the workforce. It suggests the need for better communication and risk assessment strategies to ensure a human-centric approach in technology adoption.
technology, automation risks, strategic planning, leadership, communication effectiveness
Multiple Chart
PwC/Strategy&
Saved
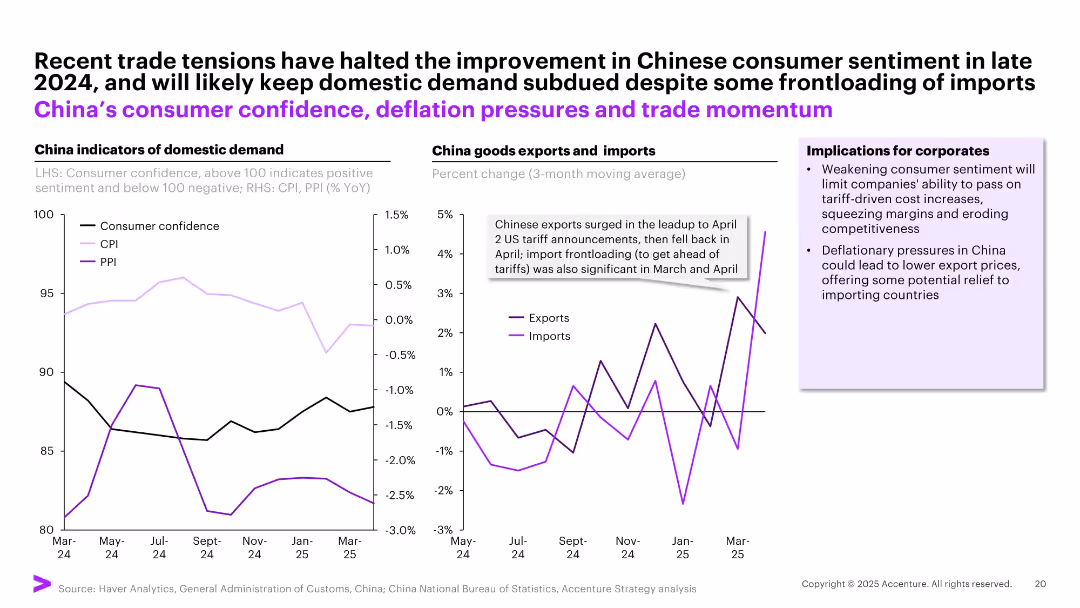
Dual line chart layout comparing domestic indicators (left) with trade flows (right); includes annotations and business implications in side box.
Market Analysis and Trends
Industrial & Manufacturing
The slide illustrates declining consumer confidence and persistent deflation in China, alongside trade fluctuations triggered by US tariffs. Corporates are advised to expect reduced pricing power in China and potential cost relief through lower export prices.
China economy, consumer sentiment, deflation, tariffs, trade, imports, exports
Multiple Chart
Accenture
Saved
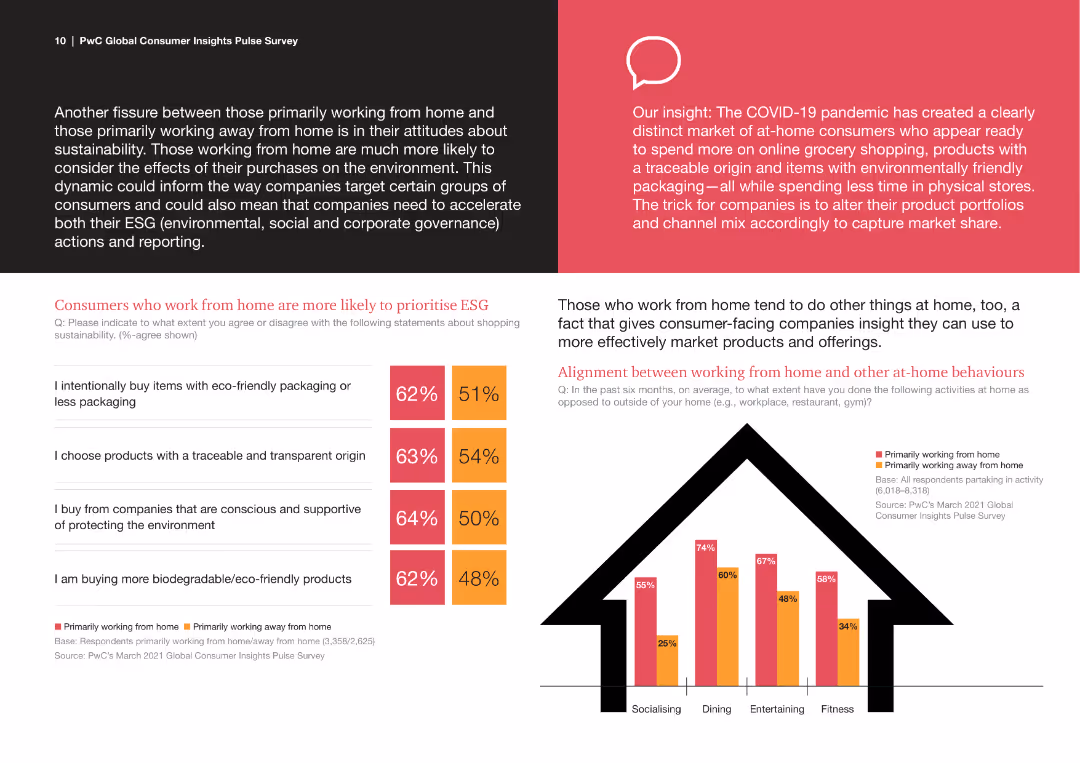
The slide features multiple elements, including text blocks, a column chart, and comparison statistics. The design uses a black background for text and bright colors for charts.
Market Analysis and Trends
Consumer Goods
The slide compares attitudes towards ESG among consumers who work from home vs. those who do not. It includes statistics on eco-friendly purchases and behaviors related to working from home.
ESG, Consumer Behavior, Remote Work, Sustainability, Market Trends
Mixed Chart
PwC/Strategy&
Saved
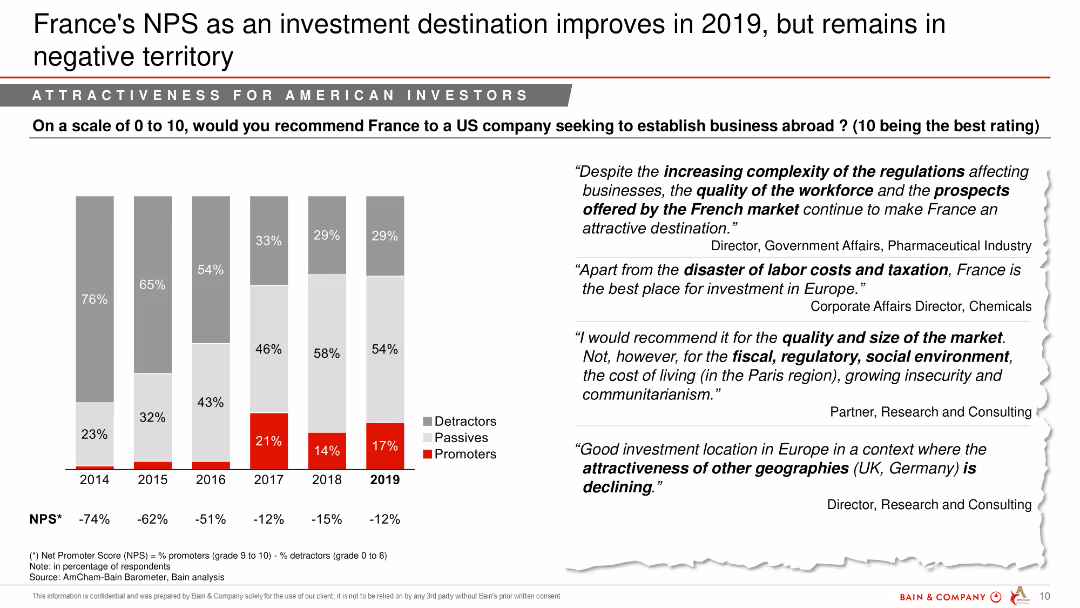
A column chart showing France's Net Promoter Score as an investment destination over several years, with text quotes from experts.
Market Analysis and Trends
Financial Services
This slide evaluates France's Net Promoter Score for investment attractiveness, highlighting opinions and trends over recent years.
NPS, investment destination, France, financial services, market analysis, yearly comparison, opinions
Mixed Chart
Bain
Saved
Contains column charts, world map visualization.
Market Analysis and Trends
Retail & E-commerce
Focus on ultra-high-net-worth individuals' spending.
UHNWI, luxury, Americas, APAC, 2019
Multiple Chart
Bain
Saved
Featuring multiple bar charts organized by employee size, revenue, and sector with a focus on marketing spend changes, the layout is dense with categorized data.
Market Analysis and Trends
Professional Services
This slide provides a detailed breakdown of marketing spending growth by company size, revenue, and economic sector, useful for market analysis and planning.
marketing, spending, growth, analysis, sector
Multiple Chart
Deloitte
Saved
The slide features two column charts. The left chart shows global online retail sales, and the right chart displays retail real estate per capita by region.
Market Analysis and Trends
Real Estate & Construction
It compares global online retail sales percentages and retail real estate space per capita across different regions, useful for market analysis.
real estate, retail, global, online sales, per capita, region, North America, Asia Pacific, Europe
Multiple Chart
JP Morgan
Saved
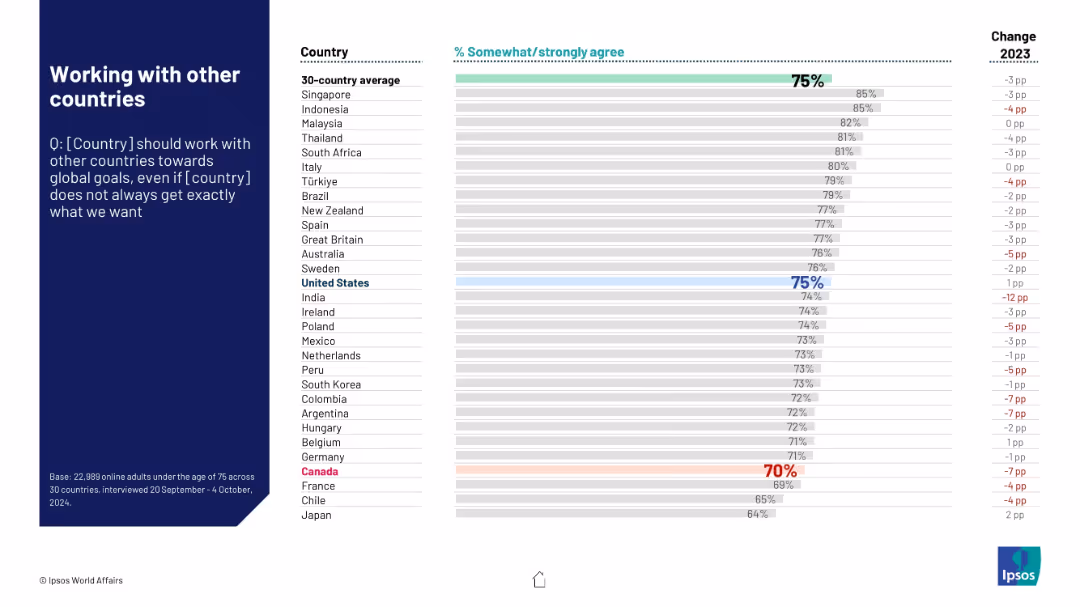
Similar layout. Assesses support for global cooperation even without perfect outcomes. Canada shown near bottom.
Strategic Planning
Government & Public Sector
Evaluates international attitudes toward cooperation with other nations on global issues. Despite some skepticism, most countries show strong support. Canada's support is relatively low at 70%.
global cooperation, diplomacy, international policy, strategic alignment, Ipsos research
Mixed Chart
IPSOS
Saved
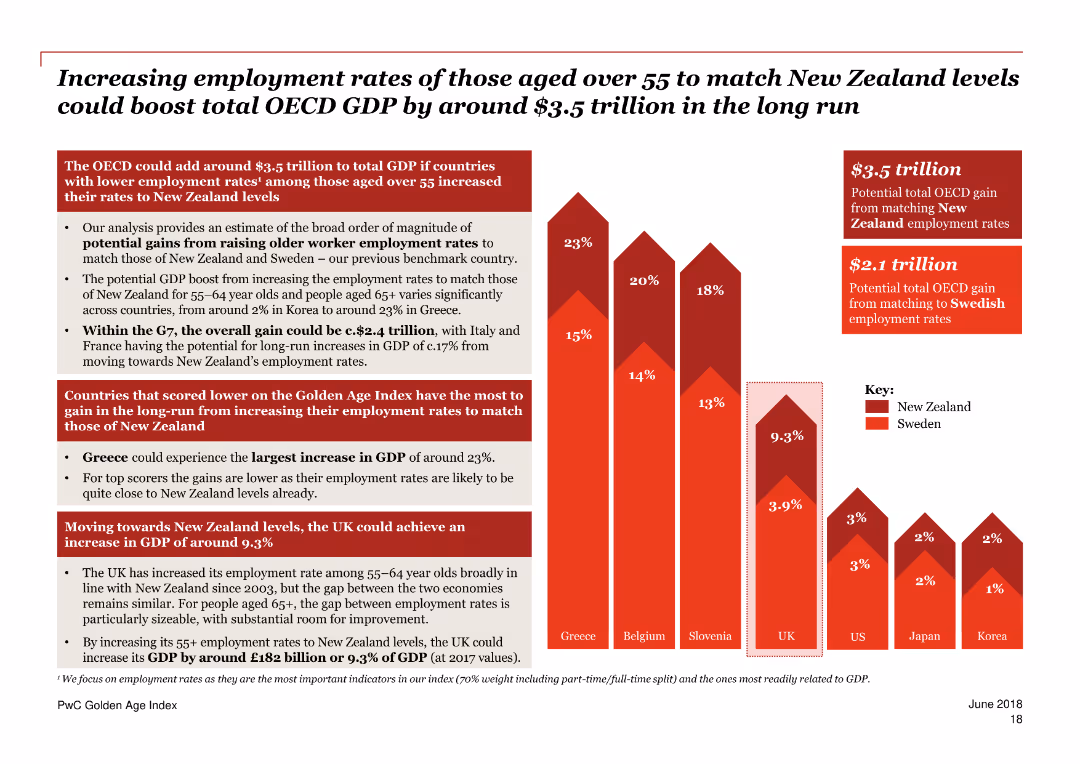
A column chart with varying shades of red, showing potential GDP boost percentages for different countries.
Market Analysis and Trends
Government & Public Sector
Highlights countries scoring lower on the Golden Age Index that have the most to gain from boosting employment rates for older workers to New Zealand levels.
GDP boost, Golden Age Index, employment, older workers, New Zealand, countries, comparison, trends, analysis, potential gains
Mixed Chart
PwC/Strategy&
Saved
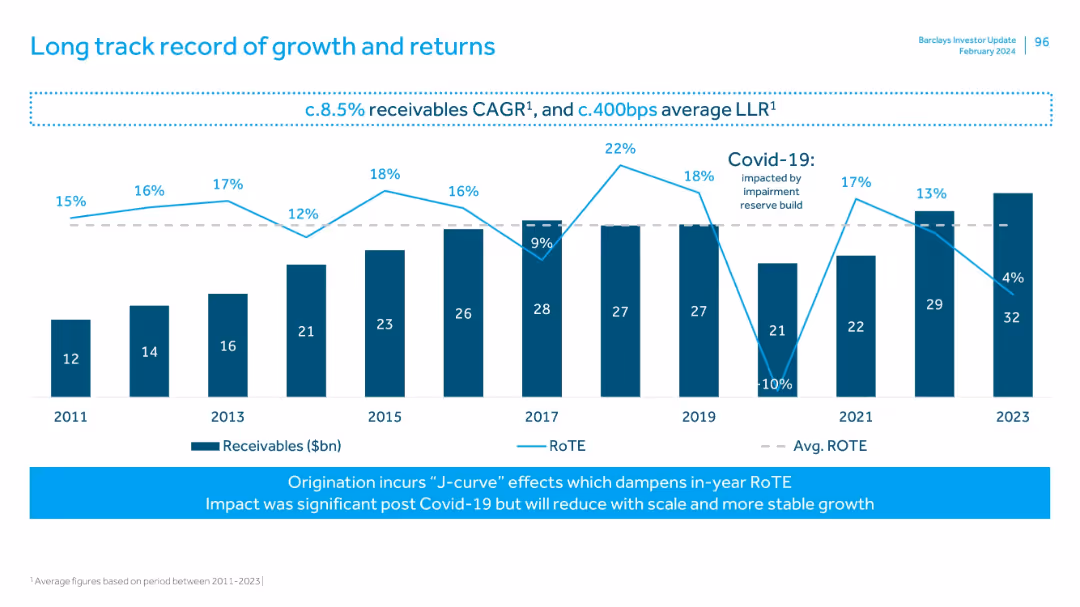
Bar and line chart combination showing Receivables and RoTE over time (2011–2023), with commentary on J-curve effects and COVID-19 impact.
Performance Metrics and KPIs
Financial Services
Tracks Barclays' receivables and return metrics over 12 years, showing consistent growth with fluctuations in RoTE, particularly around the COVID-19 period. Highlights average performance and structural dynamics like the J-curve effect in origination.
long-term growth, RoTE, receivables, CAGR, COVID-19, impairment, financial history, J-curve
Mixed Chart
Barclays
Saved
Horizontal bar chart showing predicted likelihood across countries. Visual format consistent with prior slides.
Regulatory and Compliance
Education & Training
This slide illustrates public sentiment toward banning smartphones in schools by 2025. The Netherlands and Belgium have the highest perceived likelihood, while countries like Japan and Singapore show strong skepticism. The slide reflects varying cultural attitudes toward tech in education.
education, smartphone ban, schools, regulation, public sentiment
Mixed Chart
IPSOS
Saved
The slide features a column chart displaying satisfaction levels (percentage very/somewhat satisfied) with various technologies like identity solutions, DCRs, CMPs, etc.
Technology and Digital Transformation
Technology & Software
The slide compares user satisfaction across different privacy-preserving technologies, indicating that satisfaction with DCRs is comparable to more established solutions.
satisfaction, DCRs, privacy technologies, comparison
Mixed Chart
IPSOS
Saved
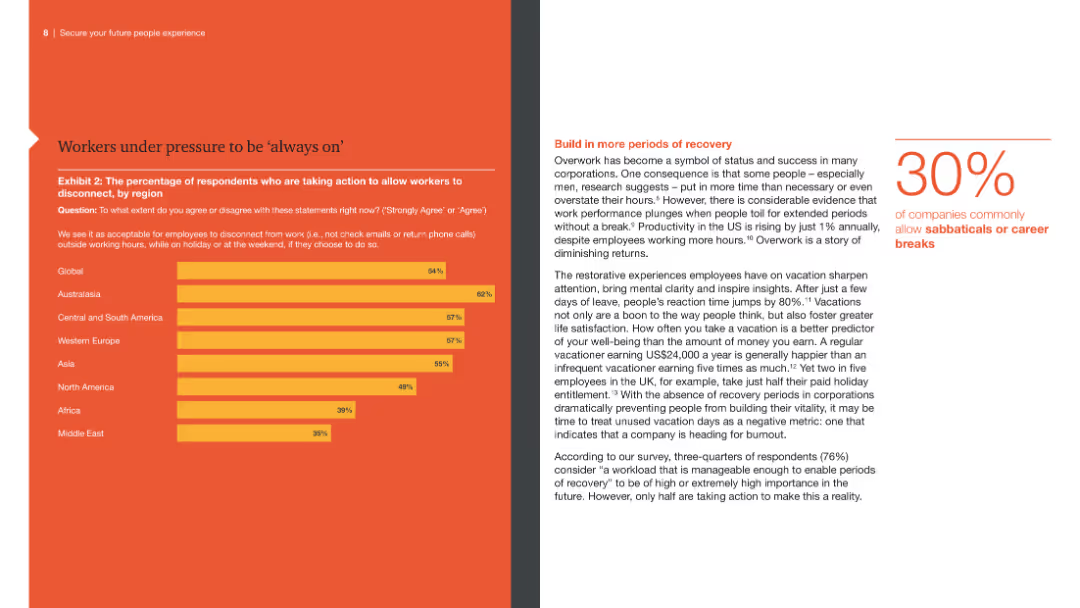
The slide features a left panel with text analysis and a right panel with a horizontal bar chart showing the percentage of respondents taking action to allow workers to disconnect, by region.
Human Resources and Talent Management
Professional Services
This slide addresses the issue of employees being expected to be 'always on,' highlighting regional differences in efforts to allow workers to disconnect and reduce burnout.
Always on, employee pressure, disconnection, regional differences, burnout
Mixed Chart
PwC/Strategy&
Saved
This slide features horizontal bar charts comparing the importance of companies paying the correct amount of tax versus reducing environmental harm. The bars are color-coded for clarity, accompanied by text highlighting the key findings.
Market Analysis and Trends
Environmental Services & Sustainability
The slide shows that a higher percentage of respondents prioritize companies reducing environmental harm over paying the correct amount of tax. This can be used to discuss corporate social responsibility, public expectations from companies, and the prioritization of environmental issues over traditional financial concerns.
corporate responsibility, environmental harm, tax compliance, public opinion, sustainability
Multiple Chart
IPSOS
Saved
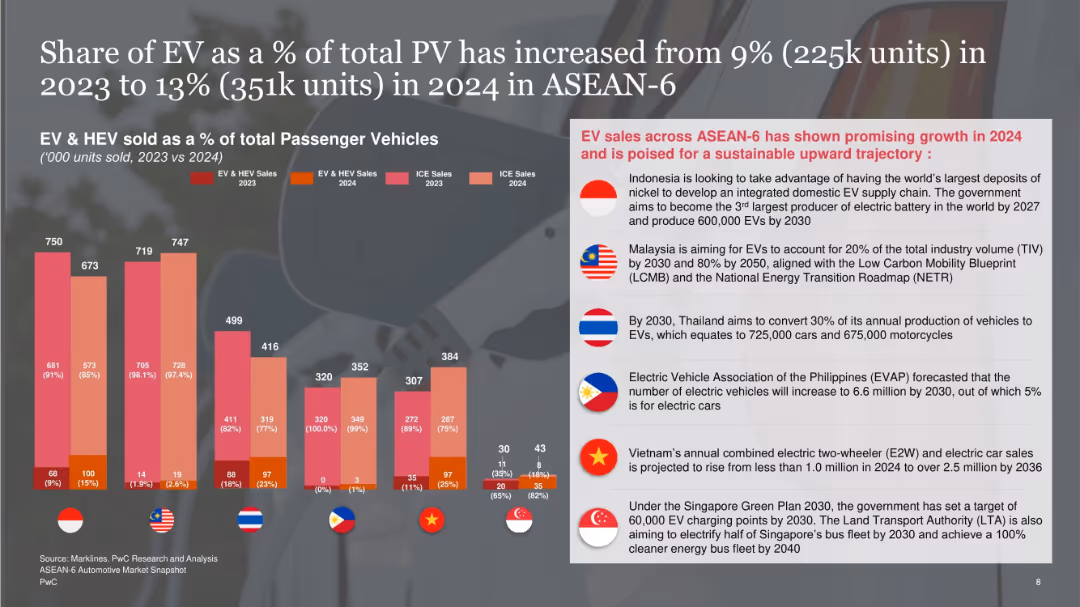
Vertical stacked bar charts of EV/HEV vs ICE vehicles by country on the left; right side has country-wise future targets and government initiatives on a shaded overlay.
Technology and Digital Transformation
Industrial & Manufacturing
Highlights EV and HEV penetration growth in ASEAN-6 from 2023 to 2024, rising to 13%. Presents government targets for EV adoption in each country, with emphasis on infrastructure development and regulatory support.
EV growth, ASEAN-6, government policy, electric vehicles, infrastructure, targets
Mixed Chart
PwC/Strategy&
Saved
The slide is structured into three main sections with a focus on innovative solutions for addressing employee needs. It features flat design icons and graphics depicting various workplace scenarios, complemented by succinct bullet points. The design utilizes a green and blue color scheme that is both eye-catching and easy to follow, facilitating a clear understanding of the strategies discussed.
Human Resources and Talent Management
Professional Services
This slide details approaches to developing nuanced, holistic solutions for employee
DEI, market expansion, business strategy, inclusive practices, new opportunities, competitive advantage
Pillar
BCG
Saved
Circular and bar charts showing importance and extent of monitoring nonfinancial metrics, with explanatory text.
Performance Metrics and KPIs
Financial Services
Highlights the belief in monitoring nonfinancial metrics to drive long-term value among APAC family offices.
long-term value, metrics, APAC, family offices, nonfinancial performance
Multiple Chart
EY
Saved
Slide combines text, checklists, and an upward arrow graphic to depict growth. It uses blue tones and icons to represent different strategic areas.
Market Analysis and Trends
Financial Services
Discusses the expansion of services to deliver more client value and the strategic areas of focus for the business to unlock higher margins.
Service expansion, client value, strategic focus, embedded finance, SaaS, AI/ML, payments innovation, margin expansion
Table
JP Morgan
Saved
Features column charts comparing HR leaders' concerns over employees leaving due to weak benefits and the percentage of employees who would stay for the right financial package, emphasizing year-over-year increases.
Human Resources and Talent Management
Financial Services
Addresses the connection between financial benefits and employee retention, highlighting HR leaders' worries and employee preferences, valuable for retention strategy discussions.
Employee Retention, Financial Benefits, HR Concerns, Bar Graphs, Year-over-Year
Multiple Chart
Goldman Sachs
Saved
Features a three-part diagram in shades of purple, each part highlighting a different social impact goal (access to finance, save money, reduce debt).
Operational Efficiency
Financial Services
This slide presents Experian's mission to leverage its platform to provide social benefits, detailing goals to improve financial access, save money for consumers, and reduce debt among US consumers.
social good, financial access, consumer savings, debt reduction, Experian
Pillar
Barclays
Saved
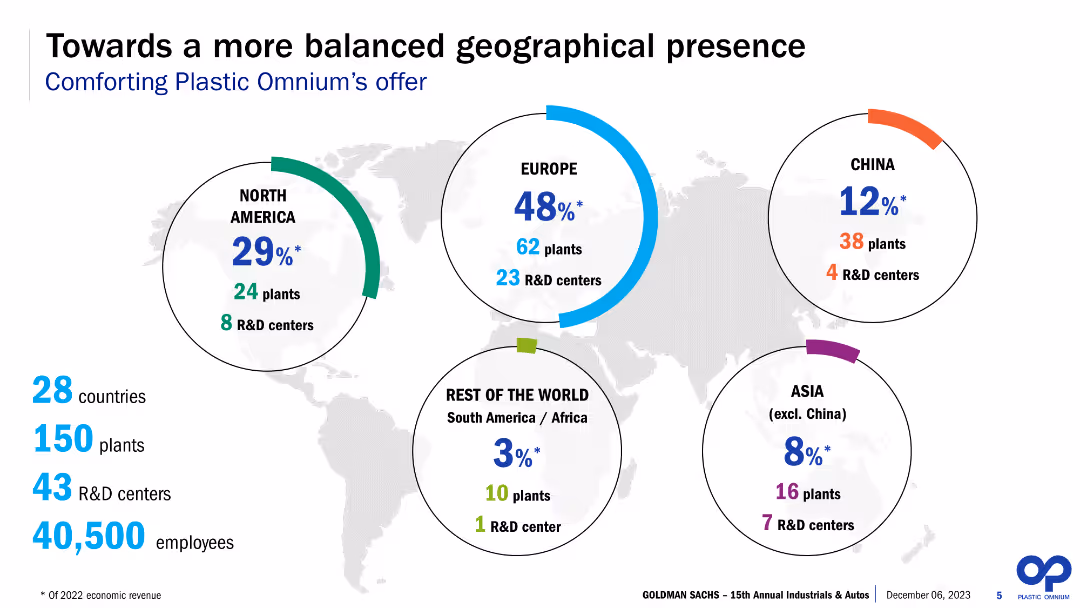
The slide features a world map with circular infographics representing various regions. It includes percentages, numbers of plants, and R&D centers across North America, Europe, China, Asia (excluding China), and the rest of the world. Text and numerical data are prominently displayed.
Strategic Planning
Industrial & Manufacturing
The slide presents Plastic Omnium’s geographical presence with detailed breakdowns of plants and R&D centers across different regions. It highlights the percentage of economic revenue each region represents, aiming to demonstrate the company’s balanced global footprint.
Global presence, plants, R&D centers, revenue, geographical distribution, Plastic Omnium, strategic planning, manufacturing, regional analysis, balanced presence
Multiple Chart
Goldman Sachs
Saved
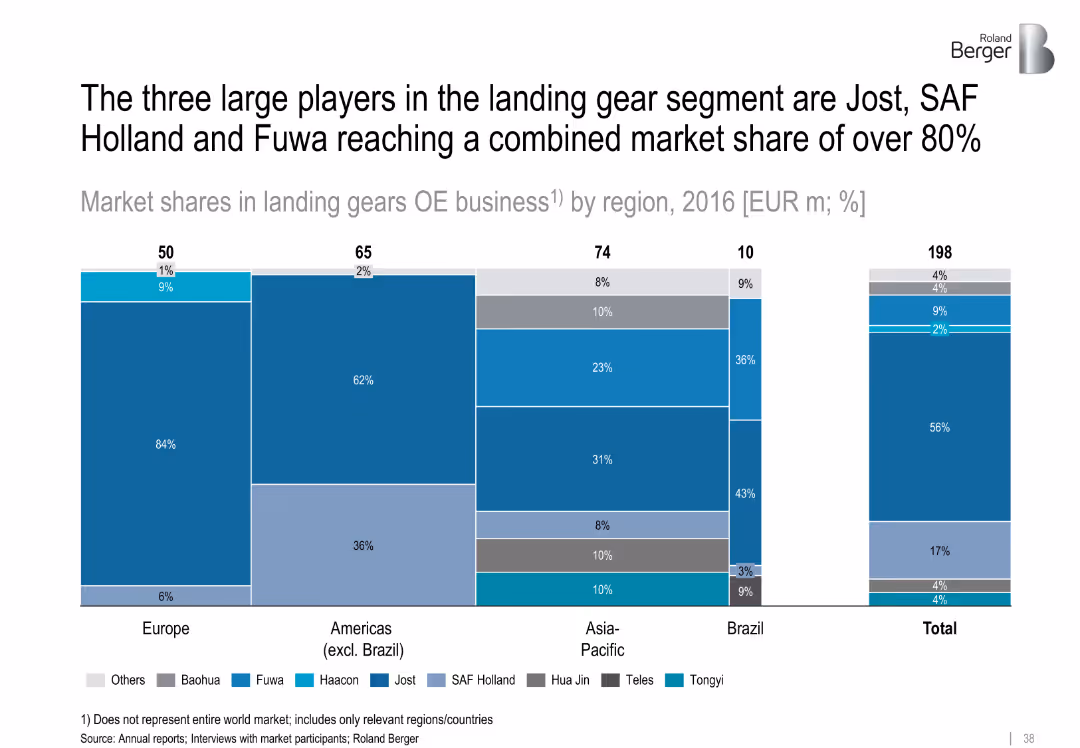
Bar chart showing 2016 landing gear market shares by region and company; color-coded segments
Competitive Landscape
Transportation & Logistics
Jost, SAF Holland, and Fuwa dominate the landing gear market with over 80% combined share. Regional charts illustrate varying dominance by player. Asia-Pacific and Brazil show more diversity among manufacturers.
landing gears, Jost, SAF Holland, Fuwa, market share, OE business, regional competition
Single Chart
Roland Berger
Saved
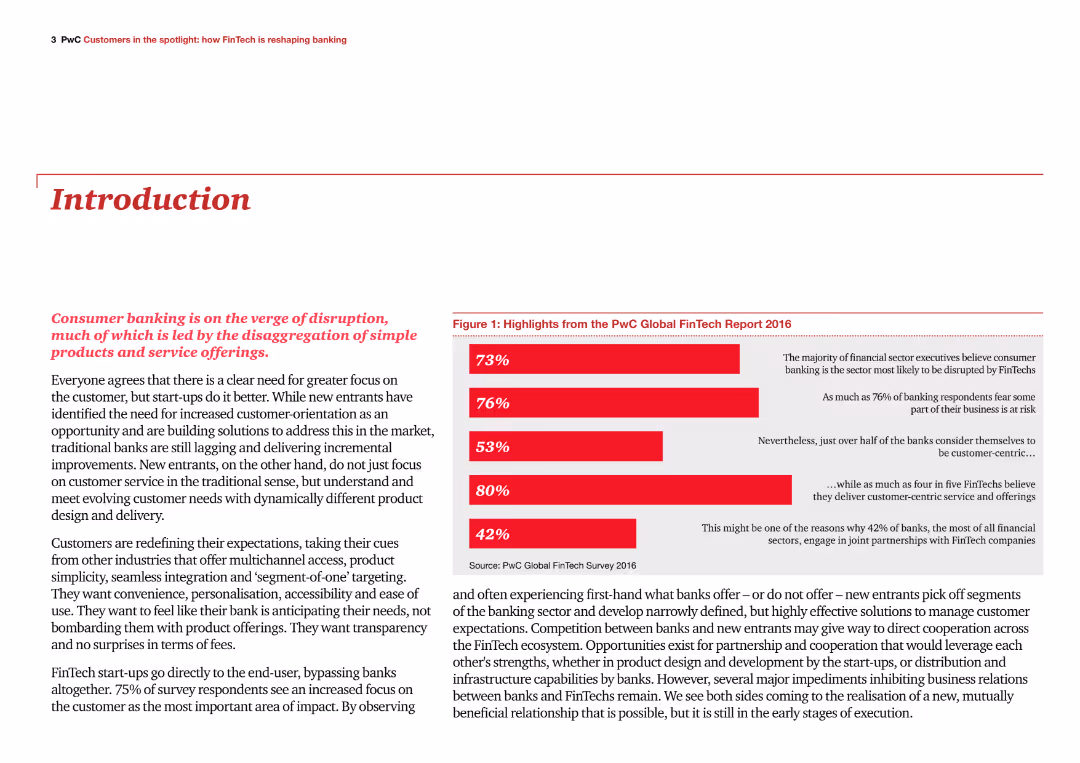
The slide has a title at the top, a paragraph of text, and a column chart on the right summarizing key highlights from the PwC Global FinTech Report 2016. The chart bars are in red, indicating different percentages.
Industry Overview
Financial Services
The slide introduces the report on how FinTech is reshaping banking, highlighting the disruptive impact on consumer banking and the importance of customer-centric approaches in the industry.
FinTech, banking, disruption, customer-centric, highlights
Mixed Chart
PwC/Strategy&
Saved
Previous
Next
If nothing, comes up, please save your slides first
Create a FREE account to continue browsing
Receive Instant Access to 1,000+ slides from companies like McKinsey, Google, and Goldman Sachs
First Name
Last Name
Email
Password
I agree to all
Terms & Privacy Policy
Thank you! Your submission has been received!
Oops! Something went wrong while submitting the form.
Have an account?
Sign in
Column Chart
Heatmap
Chevron
Org Chart
Infographic
Callouts
Timeline
List
Graphic
Picture
Process Flow
Diagram
Paragraph
Map
Table
Framework
Subtitle
Takeaway Box
Icon
Other Chart
Radar Chart
Waterfall Chart
Mekko Chart
Pie Chart
Scatter Plot
Line Chart
Bar chart
Bullet points


![Smartphones will be banned from schools in [COUNTRY]](https://cdn.prod.website-files.com/654e70fb59937215cac87b19/6899b947de546b616c79f81e_B5FdFdV9XNzxrCUowEueurmdCkn2sE3KYX0y-yduI74.avif)