My Account
My Slides
Search by Category
Templates
Leave Feedback
Login
Logout
Get Started
Browse all Slides
Browse all Slides
Create a FREE Account
Instant access to 1,000+ real slides from top companies like McKinsey, BCG, Goldman Sachs, Google and many more!
First Name
Last Name
Email
Password
I agree to all
Terms & Privacy Policy
Thank you! Your submission has been received!
Oops! Something went wrong while submitting the form.
Have an account?
Sign in
Saved Slides
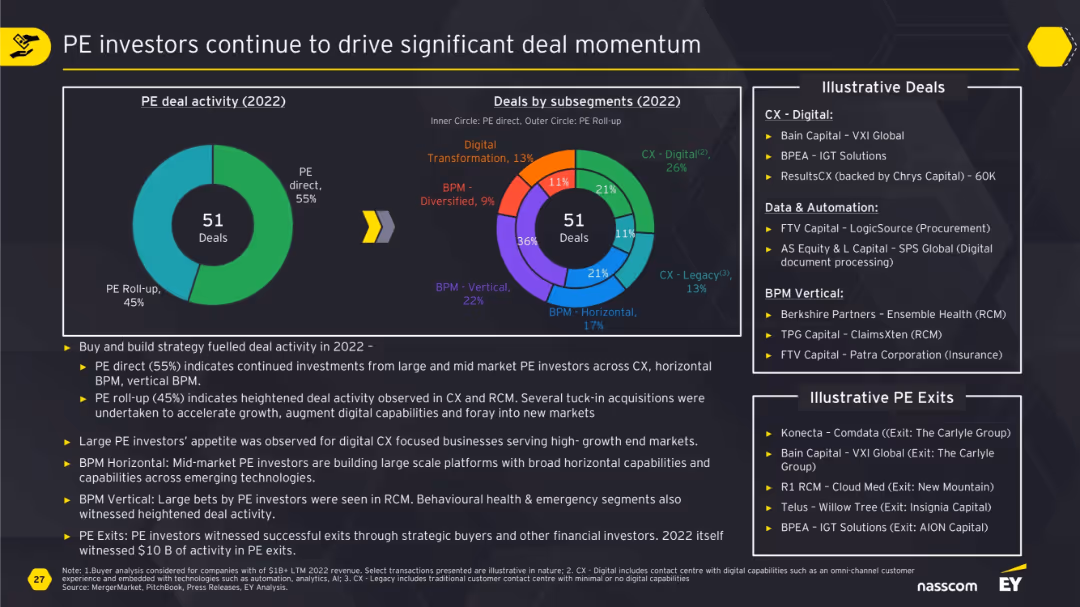
Large doughnut charts split PE direct vs roll-up and subsegment distribution; supported by summary of drivers and illustrative deals/exits.
Investment Analysis
Financial Services
This slide illustrates how private equity continues to drive deal activity, especially in CX and BPM verticals. It differentiates between direct investments and roll-ups, details illustrative transactions, and highlights the strong interest in scalable, digital, and automated capabilities across industries.
PE, investment, CX, BPM, roll-up, digital, deal momentum, exits, RCM
Multiple Chart
EY
Saved
The slide features a bar chart comparing different data signals for delivering ROI, showing that contextual data is less effective than purchase-based data.
Market Analysis and Trends
Professional Services
This slide argues that contextual data alone is insufficient for delivering high ROI. It suggests combining contextual and behavioral data for better marketing performance.
contextual data, ROI, marketing performance, data signals, purchase-based data
Mixed Chart
Nielsen
Saved
A compilation of headlines and dates detailing partnerships between banks and Fintech companies over recent years.
Mergers and Acquisitions
Financial Services
Focuses on the acceleration of bank and Fintech partnerships, detailing various collaborative efforts.
Bank Partnerships, Fintech, Collaboration, Acceleration, Strategic Alliances
Boxed
Citigroup
Saved
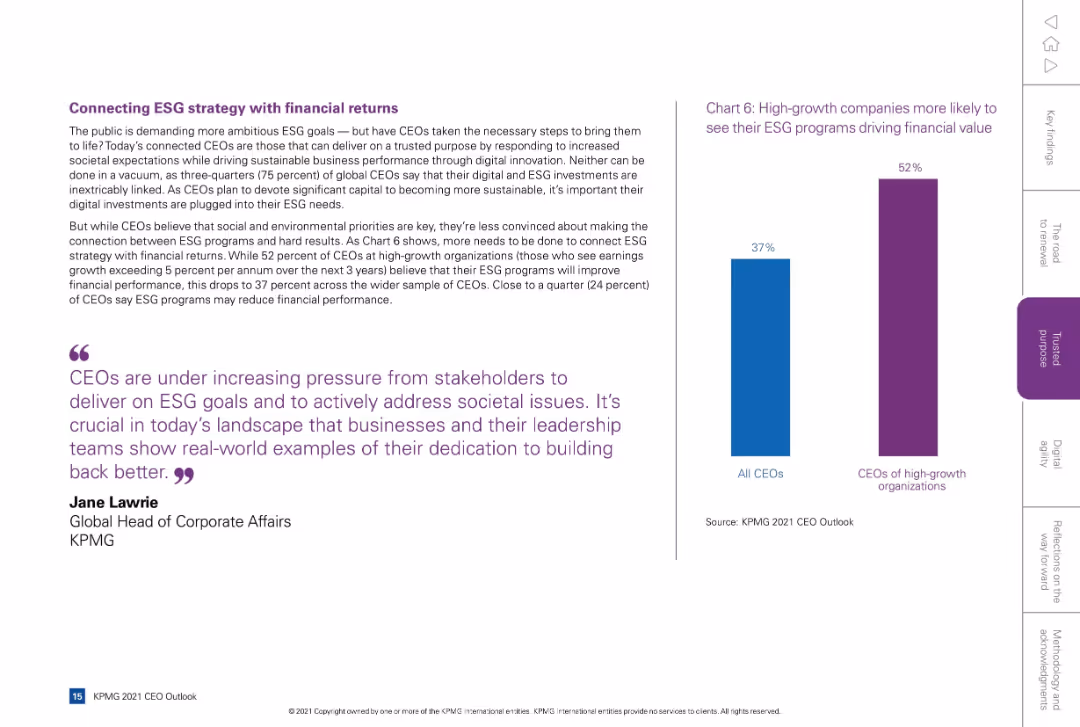
Left column contains narrative and a quote, right side features a comparative bar chart showing perceptions of ESG's financial impact by CEO type.
Financial Performance
Environmental Services & Sustainability
Explores whether CEOs see ESG goals as delivering financial value. 52% of high-growth company CEOs believe ESG improves performance versus 37% of general CEOs. Stresses the need to integrate ESG with digital strategies and stakeholder expectations.
ESG strategy, ROI, high-growth, stakeholder pressure, sustainability
Mixed Chart
KPMG
Saved
Includes a column chart with a 1.0 and 1.4 ratio, surrounded by a circular arrow diagram, and includes key performance ranks.
Performance Metrics and KPIs
Financial Services
Emphasizes the franchise collaboration model's success and its impact on generating additional revenue from clients.
Client Experience, Collaboration, Revenue Growth, IB Corporate Clients, Multiplier Effect
Single Chart
JP Morgan
Saved
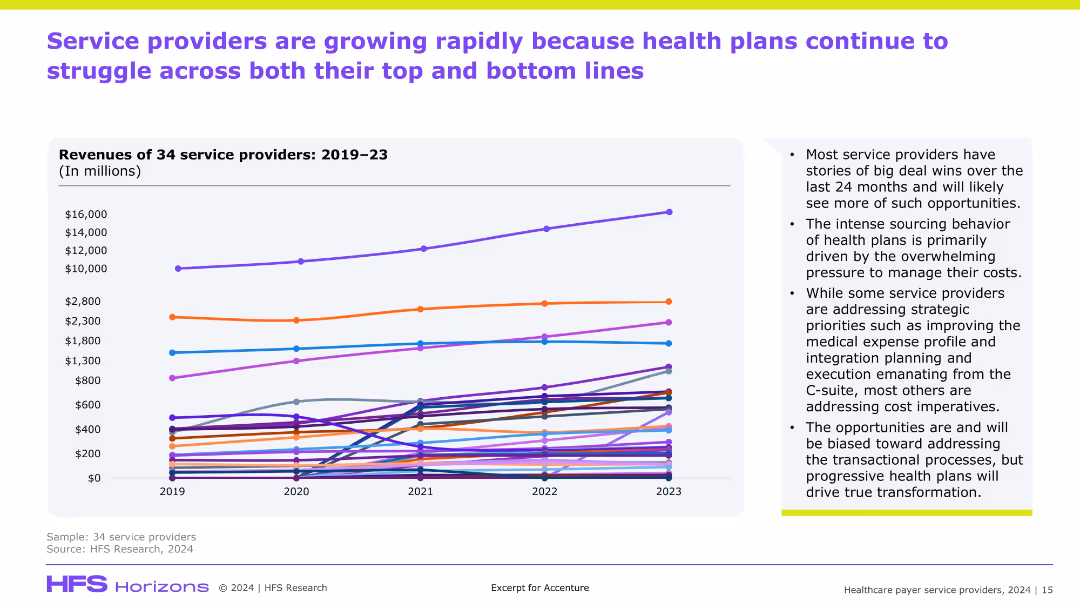
Line graph showing revenue trends for 34 providers (2019–2023); right sidebar summarizes insights; purple header and green footer accents.
Financial Performance
Healthcare & Pharmaceuticals
Highlights the growing revenue of service providers despite the operational challenges faced by health plans. Indicates rising strategic sourcing and cost pressures as key drivers. Emphasizes opportunity areas for transformation in a competitive healthcare service landscape.
healthcare services, provider revenue, cost pressure, transformation
Mixed Chart
Accenture
Saved
The slide displays a diamond-shaped diagram in the center, showing four business areas, flanked by text blocks on each side. It is in a blue and white color scheme with the page number at the bottom right.
Organizational Structure and Change
Financial Services
This slide provides an overview of the presenter's corporate structure, highlighting the integration of services and the focus on client-centricity. It outlines the growth in client coverage and improved relationships as a result of this approach. Ideal for discussions on corporate strategy, organizational change, and client relationship management, it illustrates the company's strategy for unified services and growth in client engagement.
Corporate Strategy, Client Centricity, Business Development, Organizational Structure, Integration
Framework
Goldman Sachs
Saved
Two sets of complex visual data represented by column and line graphs are displayed side by side for 'Branded Cards' and 'Retail Services'. The graphs detail normalized NCL rates, 90+ DPD rates, NCL, ACLL Balance, and ACLL/EOP Loans, providing a comprehensive overview of credit trends over time.
Financial Performance
Financial Services
The slide compares the credit performance and trends for branded cards with retail services, highlighting key financial indicators such as past due rates and credit losses. Intended for financial analysis and risk assessment, it is crucial for professionals in the financial services industry.
Credit Trends, Branded Cards, Retail Services, Financial Analysis, Risk Management, NCL Rate, Past Due, ACLL, EOP Loans, Financial Services
Multiple Chart
Citigroup
Saved
A content slide featuring text on the left with two column charts on the right. The columns compare various ESG growth opportunities and tracking methods.
Risk Assessment and Management
Financial Services
The slide discusses banks' progress in sustainable finance and ESG, highlighting opportunities in ESG products and banks' early stages in tracking environment-related products.
ESG, sustainable finance, opportunities, risks, tracking
Multiple Chart
EY
Saved
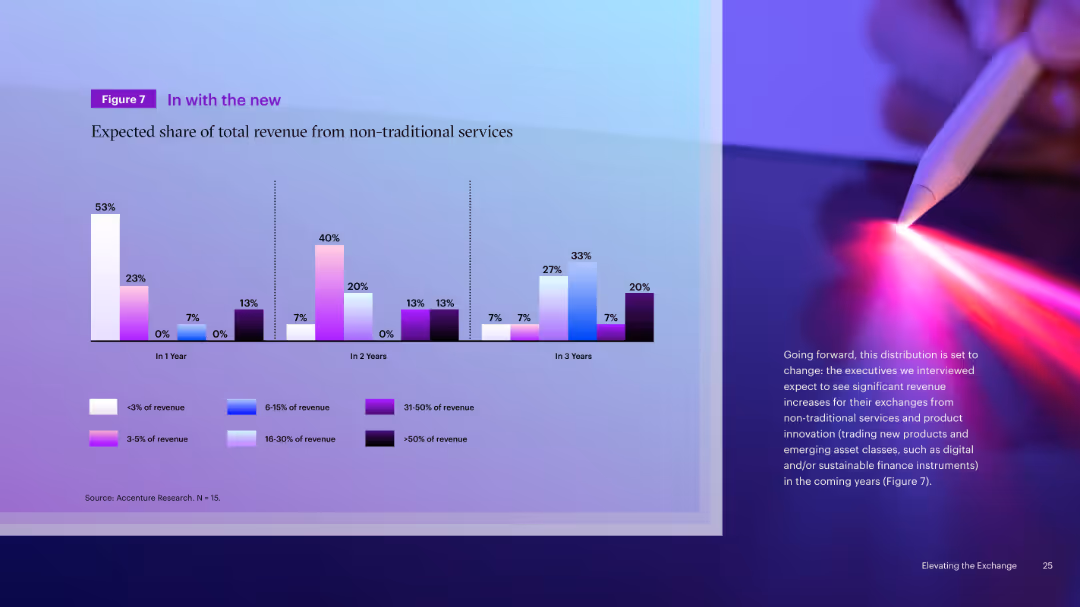
Clustered bar chart showing expected revenue shares from non-traditional services over 1, 2, and 3 years. Color-coded by revenue share range. Right image.
Strategic Planning
Financial Services
This slide forecasts increasing reliance on non-traditional services by exchanges. Executives expect significant growth in revenue from these sources, including innovations like digital asset trading and sustainable finance instruments over a 3-year horizon.
Forecast, Revenue Growth, Innovation, Non-Traditional, Exchanges, Future, Strategic Planning, Financial
Mixed Chart
Accenture
Saved
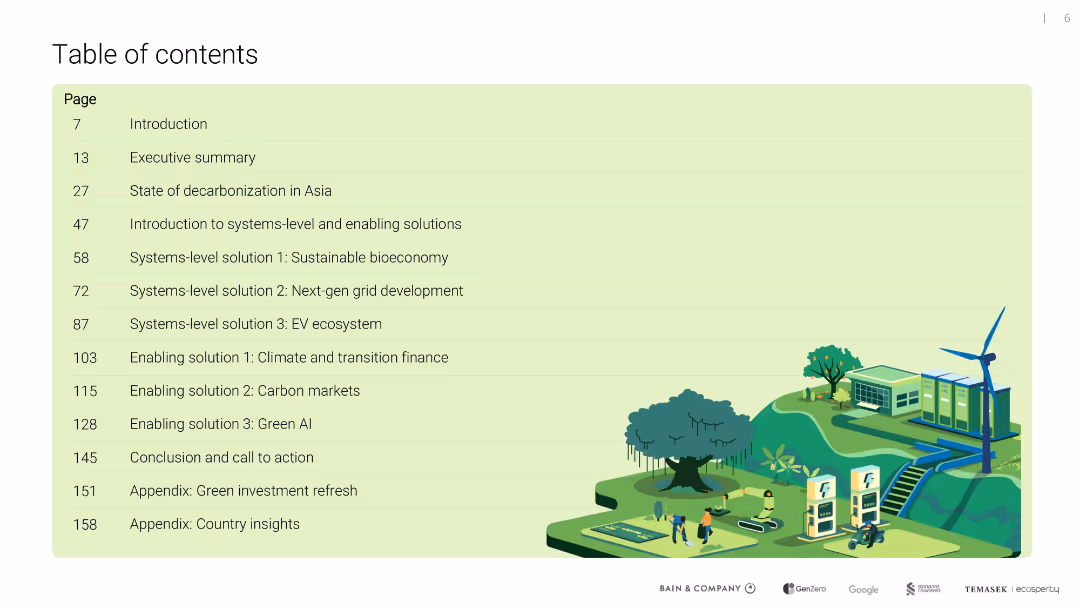
Full-page green-tinted slide with a clean tabular list of page numbers and section titles; illustrated bottom area with eco-themed imagery (windmill, EV, solar panel)
Strategic Planning
Environmental Services & Sustainability
Provides a structured overview of the report’s sections, covering decarbonization strategies, enabling technologies, climate finance, and regional green investment insights in Asia.
table of contents, decarbonization, systems-level solutions, finance, green AI
Agenda
Bain
Saved
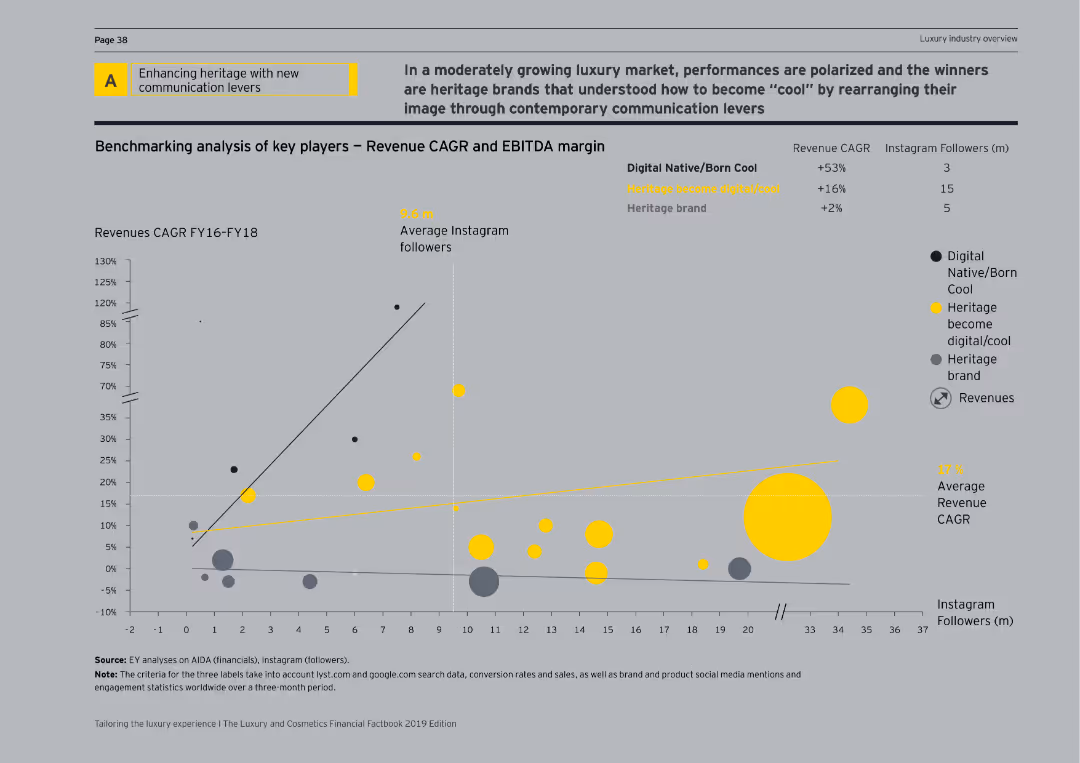
Contains a scatter plot showing revenue CAGR and EBITDA margin, along with Instagram followers for digital native, heritage, and hybrid brands.
Strategic Planning
Media & Entertainment
Analyzes key players in the luxury market, comparing their revenue growth, EBITDA margins, and social media influence to drive strategic planning.
benchmarking, revenue CAGR, EBITDA margin, Instagram followers, digital native, heritage brand, hybrid brand, scatter plot, strategic planning
Single Chart
EY
Saved
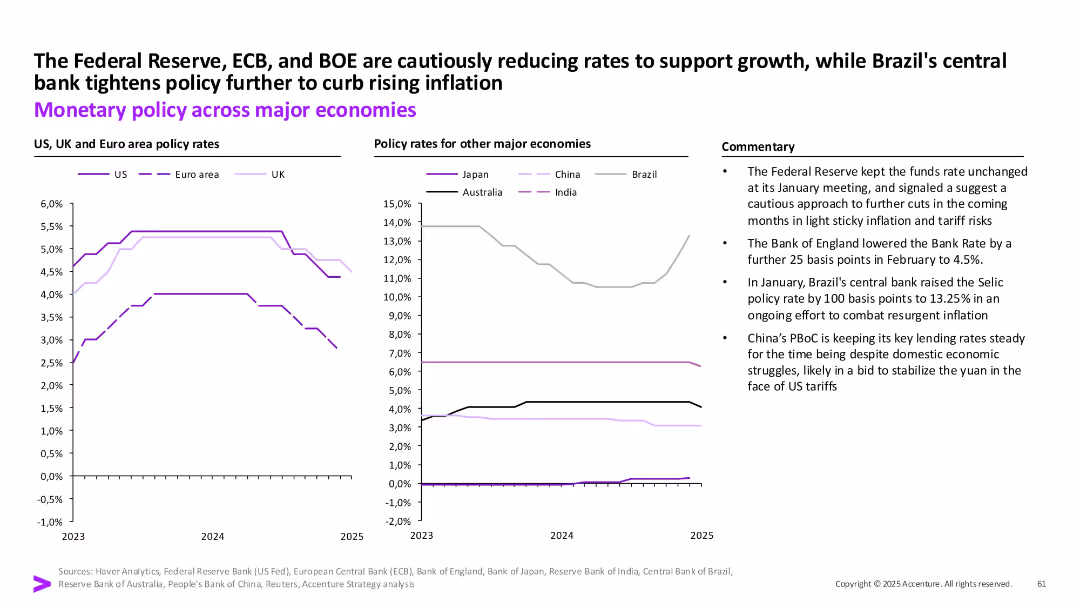
Two comparative line charts by region on policy rates with textual commentary.
Strategic Planning
Financial Services
The slide contrasts monetary policy decisions across major economies in response to inflation and growth concerns. The Fed, ECB, and BOE show rate reductions, while Brazil tightens and China remains steady.
Interest rates, inflation, central banks, Fed, ECB, BOE, Brazil, China, monetary policy
Multiple Chart
Accenture
Saved
A slide with two sections: a map highlighting global reach and a side panel outlining execution priorities. It includes numerical data and textual information in bullet points.
Market Analysis and Trends
Financial Services
The slide provides an overview of the firm's global network, including revenues, offices, employees, and prioritizes strategic growth areas such as advisory services and corporate footprint.
Global Network, Client Relationships, Revenues, Execution Priorities
Table
Goldman Sachs
Saved
The slide includes a left text block and two column charts on the right, contrasting CEO priorities between different countries.
Strategic Planning
Professional Services
Discusses the nuanced global views of CEOs regarding trade conflicts and their impact on market growth, highlighting shifting priorities towards various economies using column charts.
global markets, CEO survey, trade conflict, economy, growth
Multiple Chart
PwC/Strategy&
Saved
Percentage data addressing managers' future in their roles and their views on the pros and cons of management.
Organizational Structure and Change
Professional Services
Discusses the sustainability of traditional management roles and the shifting aspirations of managers and employees, pertinent for strategic organizational planning and HR policies.
management sustainability, future roles, organizational change, employee aspirations, career planning, professional services, HR strategies
Header Horizontal
BCG
Saved
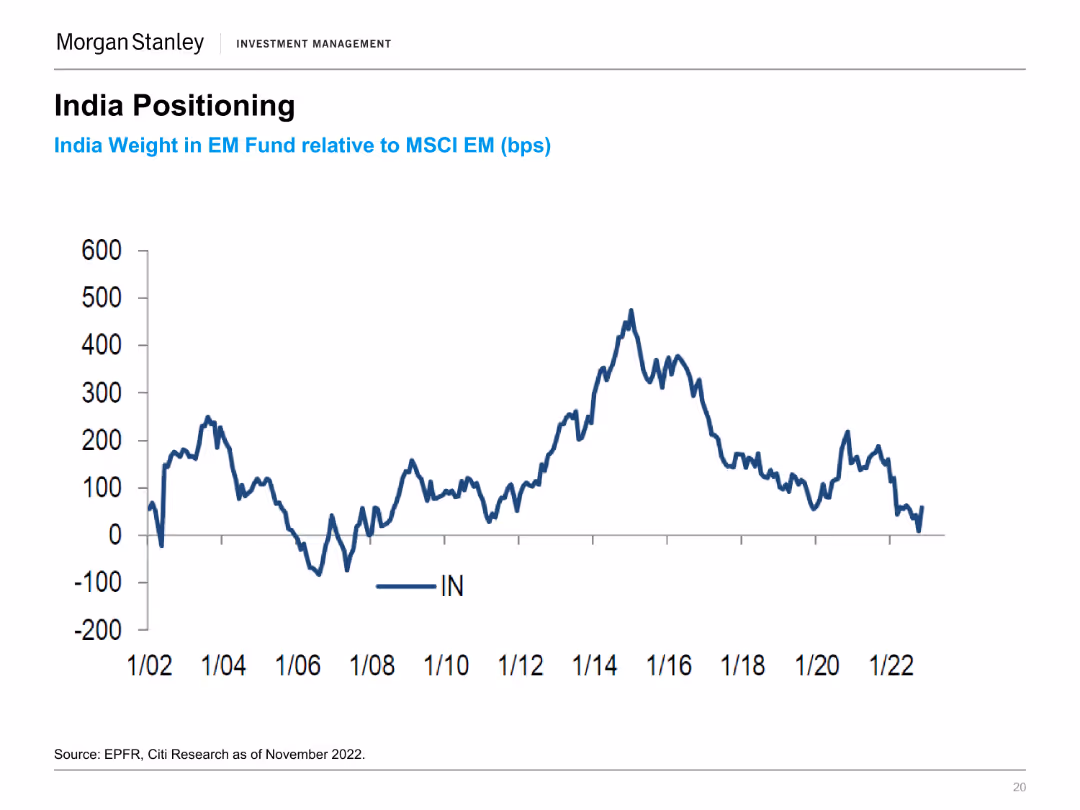
A line chart showing India's weight in EM Fund relative to MSCI EM (bps) from 1/02 to 1/22. The chart shows fluctuations in India's position within the EM Fund.
Market Analysis and Trends
Financial Services
The slide shows the positioning of India in the Emerging Market Fund relative to MSCI EM over time, highlighting its trends and fluctuations.
India, EM Fund, MSCI, Weight, Positioning
Single Chart
Morgan Stanley
Saved
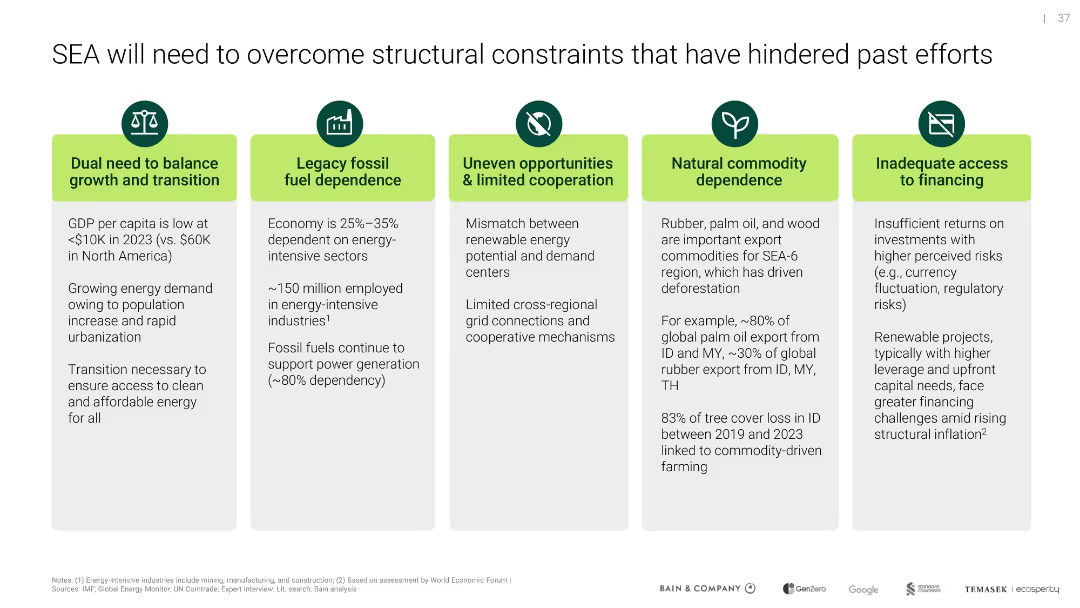
Five-column layout with icons atop text boxes; each represents a structural challenge hindering decarbonization
Operational Efficiency
Environmental Services & Sustainability
Outlines five structural barriers in SEA—low GDP per capita, fossil dependency, lack of cooperation, commodity reliance, and poor financing access—that must be addressed to enable effective climate action and transition.
structural barriers, fossil fuels, SEA, cooperation, financing
Pillar
Bain
Saved
Horizontal bar chart with country-wise comparison of importance of language proficiency; 2-color segmentation
Customer and Market Segmentation
Government & Public Sector
This slide evaluates public opinion on whether speaking the national language is essential to being a true citizen. Over 85% of respondents globally agree, with highest importance in countries like Indonesia and France, and relatively lower importance in India and the U.S.
language, citizenship, integration, communication, national identity, Ipsos, survey analysis, belonging
Mixed Chart
IPSOS
Saved
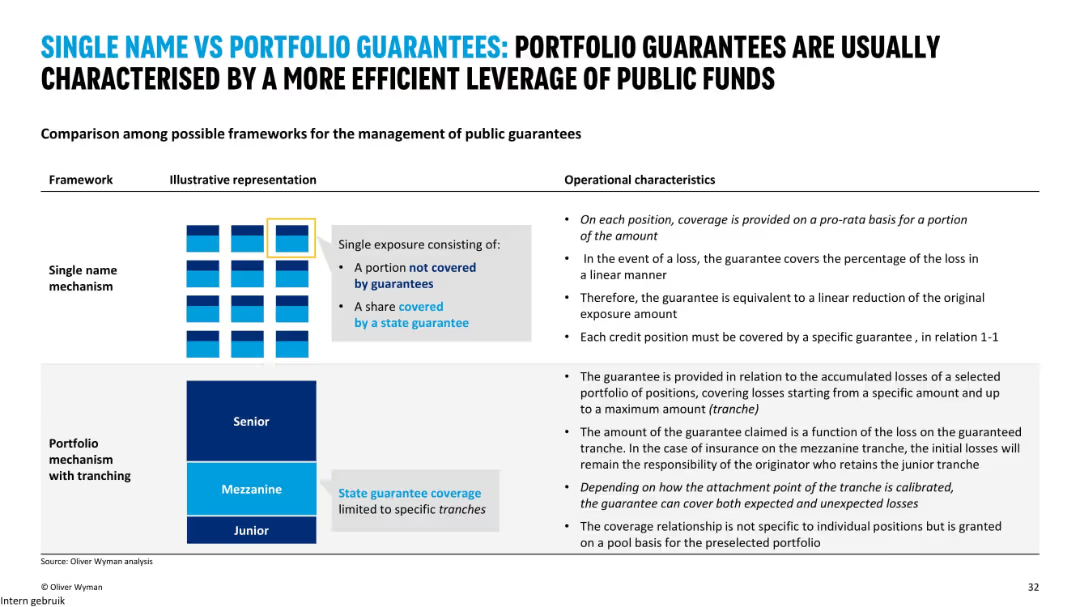
Two illustrated models (single name vs. portfolio guarantees) with operational characteristics explained side-by-side; uses charts and text.
Regulatory and Compliance
Financial Services
This slide compares two types of guarantee mechanisms for SME lending: single name and portfolio with tranching. Portfolio guarantees are shown to offer more efficient use of public funds and better coverage for both expected and unexpected losses.
guarantees, portfolio, single name, tranching, public funds, SME lending
Mixed Chart
Oliver Wyman
Saved
Vertical column chart showing loan exposure by sector, alongside a descriptive table.
Risk Assessment and Management
Financial Services
Summarizes corporate loan exposure and impairment risks by sector, highlighting synthetic protection levels.
loans, corporate, risk assessment, sectors, protection
Mixed Chart
Barclays
Saved
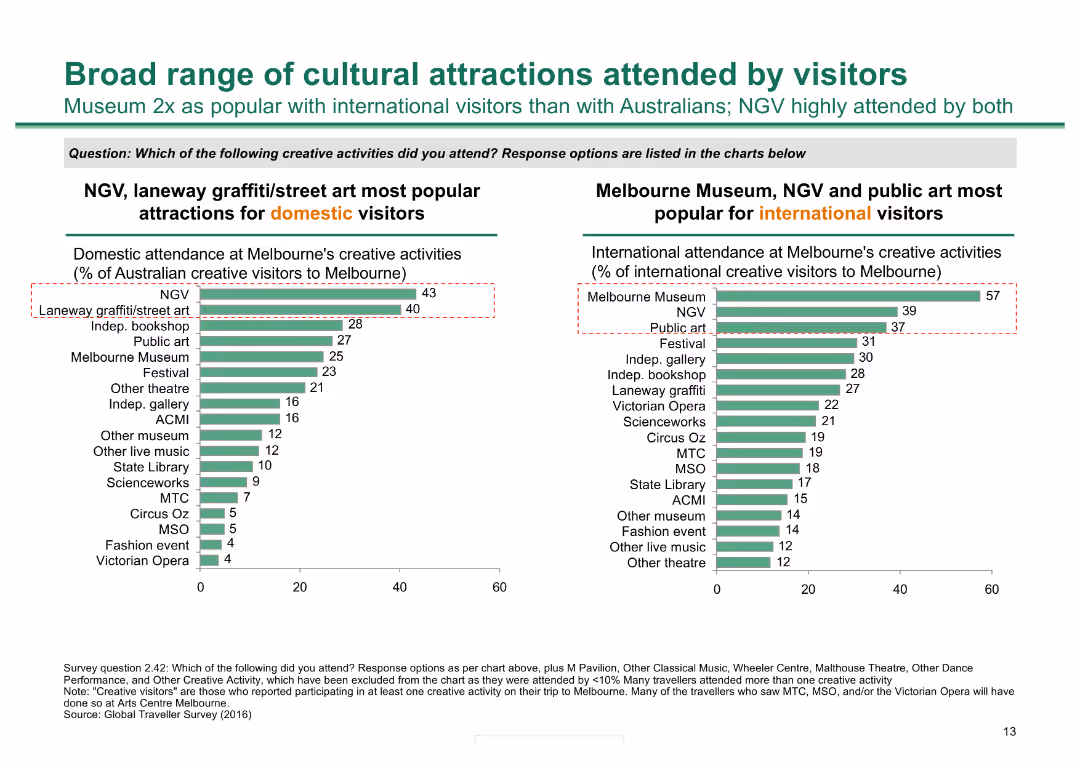
Two column charts: one showing the popularity of creative activities among domestic visitors and the other among international visitors, highlighting key cultural attractions.
Market Analysis and Trends
Hospitality & Tourism
The slide details the attendance at various creative activities in Melbourne, comparing the preferences of domestic and international visitors to identify popular cultural attractions.
cultural attractions, Melbourne, creative activities, domestic visitors, international visitors, popularity, tourism, trends
Multiple Chart
BCG
Saved
The slide includes a pie chart detailing a breakdown by property type and a line chart showing the net charge-off rate over time, comparing commercial banking to peer average. It also features text sections with bullet points.
Risk Assessment and Management
Financial Services
Analysis of credit risk management, with focus on performance, asset class strength, and exposure.
Risk, credit, performance, exposure, CRE, asset, lending, quality, portfolio, discipline
Multiple Chart
JP Morgan
Saved
Combines multiple elements: bar charts on population and purchasing power, column charts detailing coffee consumption and e-commerce sales, and a pie chart comparing premium vs. affordable market sales.
Strategic Planning
Consumer Goods
Discusses multiple drivers for future growth in emerging markets, including demographic trends, consumer behavior, and digital transformation. This slide supports strategic planning by highlighting key areas for investment and development.
growth drivers, emerging markets, strategic planning, digital transformation, consumer trends
Multiple Chart
Deutsche Bank
Saved
A column chart and text combine to provide a visual breakdown of expenses and investment themes. Blue bars represent quantitative data while a sidebar lists investment themes with associated icons. The layout is structured to facilitate comparison and trend analysis.
Operational Efficiency
Financial Services
This slide compares quarter-on-quarter and year-on-year expenses for Citigroup, with an emphasis on how investments and strategic initiatives have contributed to these financial figures. It is useful for illustrating financial prudence and investment impact on the company's operations.
Citigroup, QoQ, YoY, Expenses, Investment Themes, Operational Efficiency, Platform Simplification, Security, Client Experience
Mixed Chart
Citigroup
Saved
Previous
Next
If nothing, comes up, please save your slides first
Create a FREE account to continue browsing
Receive Instant Access to 1,000+ slides from companies like McKinsey, Google, and Goldman Sachs
First Name
Last Name
Email
Password
I agree to all
Terms & Privacy Policy
Thank you! Your submission has been received!
Oops! Something went wrong while submitting the form.
Have an account?
Sign in
Column Chart
Heatmap
Chevron
Org Chart
Infographic
Callouts
Timeline
List
Graphic
Picture
Process Flow
Diagram
Paragraph
Map
Table
Framework
Subtitle
Takeaway Box
Icon
Other Chart
Radar Chart
Waterfall Chart
Mekko Chart
Pie Chart
Scatter Plot
Line Chart
Bar chart
Bullet points


![To be able to speak [LANGUAGE OF SURVEY]](https://cdn.prod.website-files.com/654e70fb59937215cac87b19/6899bb25ab40f0a37d1e3bf4_72pjbRjZOgM-1jEZbXLwIGbQRbvsN3sOVvBNQ5wW2yI.avif)