My Account
My Slides
Search by Category
Templates
Leave Feedback
Login
Logout
Get Started
Browse all Slides
Browse all Slides
Create a FREE Account
Instant access to 1,000+ real slides from top companies like McKinsey, BCG, Goldman Sachs, Google and many more!
First Name
Last Name
Email
Password
I agree to all
Terms & Privacy Policy
Thank you! Your submission has been received!
Oops! Something went wrong while submitting the form.
Have an account?
Sign in
Saved Slides
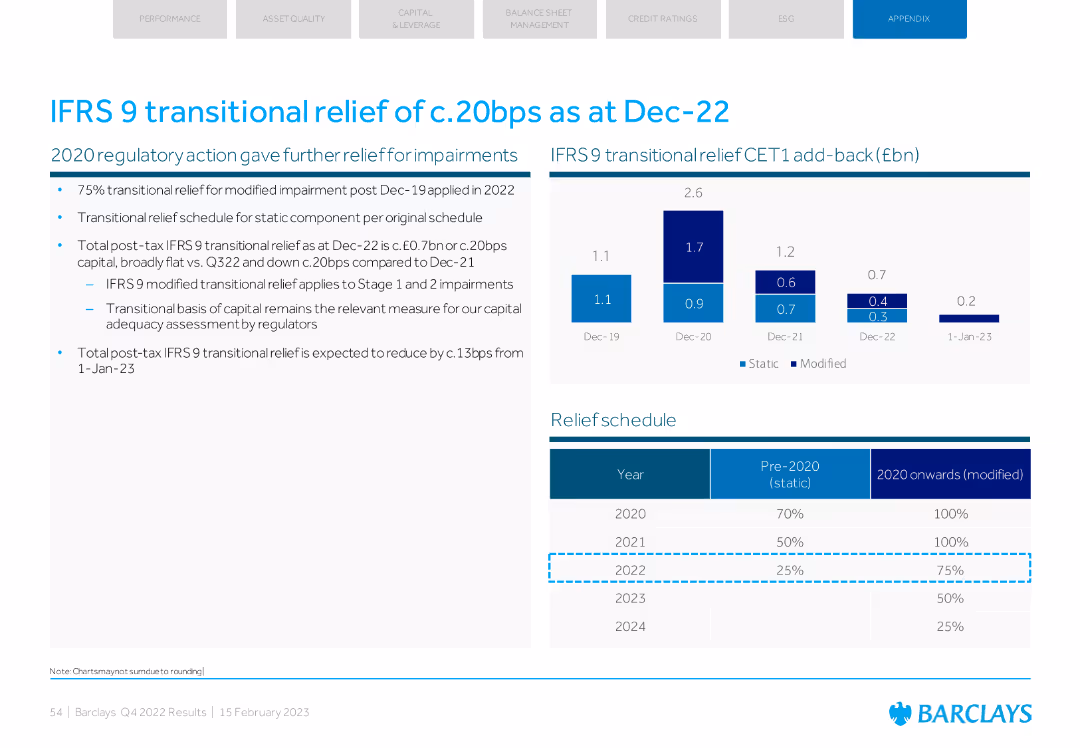
Column charts showing transitional relief impact and a table with the relief schedule.
Regulatory and Compliance
Financial Services
Details the impact of IFRS 9 transitional relief on Barclays' CET1 capital and outlines the expected schedule for reducing this relief in future years.
IFRS 9, transitional relief, CET1, schedule, capital
Mixed Chart
Barclays
Saved
The slide includes a column chart depicting expense trends from 2021 to 2023, with text explaining transformation investments, business-led investments, volume-related, and structural expenses.
Financial Performance
Financial Services
The slide outlines Citi's expense trends, detailing areas of investment and expense growth, aligned with strategic goals and operational efficiency improvements.
Expense Trend, Citi, Financial Performance, 2021-2023, Investment Areas, Column Chart, Strategic Goals, Operational Efficiency
Mixed Chart
Citigroup
Saved
Uses a world map and pie charts to present global sales distribution, product categories, and company resources.
Industry Overview
Consumer Goods
Summarizes the global sales footprint of a consumer goods company, showing regional sales distribution and product diversification.
global, sales, consumer goods, distribution, products, company, diversification, markets
Multiple Chart
Deutsche Bank
Saved
This slide displays stacked bar charts showing the percentage of revenue share by region in the semiconductor design sector for different design types. Each bar uses a distinct color to represent a different region (e.g., US, Europe, China) and labels indicating specific percentages for clarity in comparison.
Market Analysis and Trends
Technology & Software
The slide analyzes the global semiconductor design market, highlighting the US's leading role and comparing it with other regions like Europe and China. It provides insights into the distribution of market share across different semiconductor types, emphasizing the R&D intensity and value-add of the industry. Useful for market analysts and professionals in strategic planning or market analysis roles.
semiconductor, market share, global leader, R&D, US, Europe, China
Single Chart
BCG
Saved
Mix of tables, column charts, and a summary section, along with textual annotations and headings for each section.
Investment Analysis
Financial Services
Slide analyzes alternative investment assets, fees, and balance sheet allocations. Appropriate for discussions on investment strategy or financial planning.
Alternative Investments, Fees, Asset Allocation
Multiple Chart
Goldman Sachs
Saved
Features several bar graphs to compare spending habits of HVUs vs non-HVUs in Malaysia, along with demographic compositions. It has a clear blue and gray color scheme.
Customer and Market Segmentation
Technology & Software
Highlights spending discrepancies between HVUs (high-value users) and non-HVUs in Malaysia, with insights into their demographic distribution and projected spend change.
Malaysia, HVUs, Spending, Demographics, Online Spend, Gaming, Travel, E-commerce, Market Segmentation, Spending Habits
Multiple Chart
Bain
Saved
Composed of multiple vertical bar graphs, this slide indicates the factors investors consider when making investment decisions. It uses a teal color scheme with variations in bar height to represent percentages, making it data-rich and informative.
Investment Analysis
Financial Services
The slide conveys investors' focus on various company-specific factors for investment consideration, such as long-term growth and valuation, suitable for analyzing investment criteria.
Investment Factors, Market Share, Valuation, Cash Flow, Balance Sheet, Organic Growth, Capital Improvement, Long-term Outlook, Strategic Investment, Company Evaluation
Mixed Chart
BCG
Saved
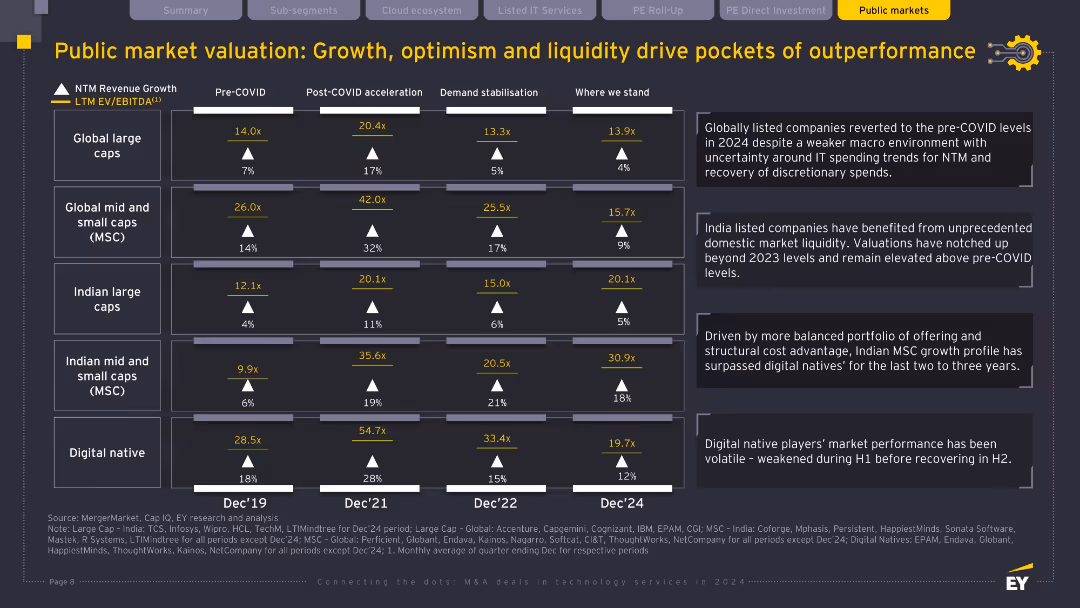
Table with valuation metrics (EV/EBITDA and revenue growth), historical comparisons across five company types; contextual text on the right side explains trends.
Financial Performance
Financial Services
The slide tracks valuation trends across global and Indian large/mid caps and digital-native firms from pre-COVID to 2024. It shows valuation multipliers stabilizing post-COVID acceleration and notes India’s strong domestic liquidity and structural advantages in mid and small caps. Digital natives show volatility but recovery. The slide contextualizes how market maturity and investor confidence shape current valuations.
Valuation, public markets, digital native, small caps, growth, liquidity, EV/EBITDA
Table
EY
Saved
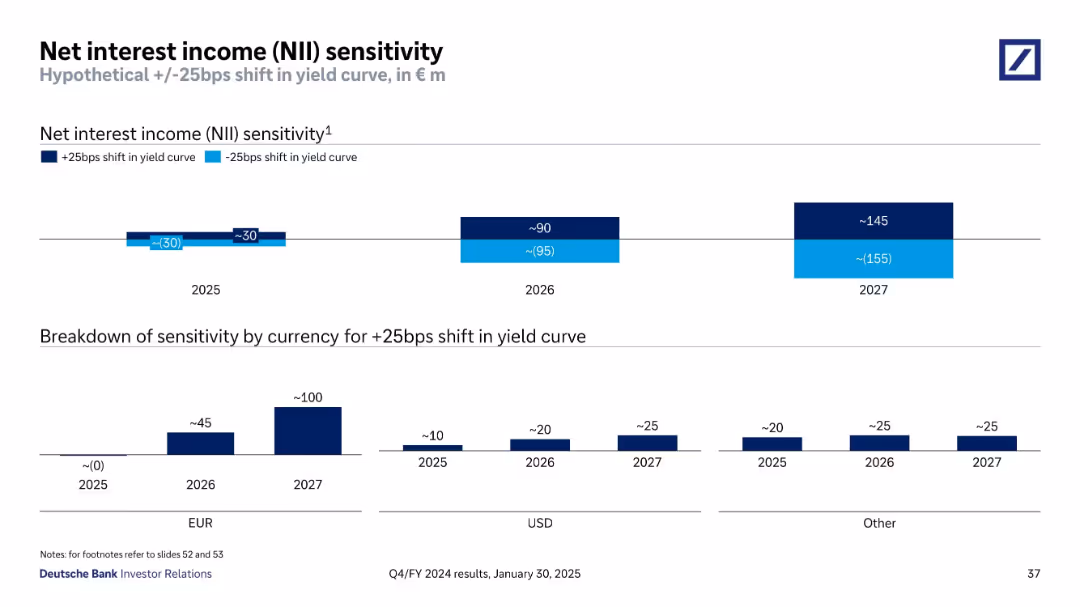
Bar chart projections showing sensitivity to +/-25bps shift in yield curve over 2025–2027
Risk Assessment and Management
Financial Services
Displays Deutsche Bank’s estimated NII sensitivity to yield curve shifts through 2027. The breakdown indicates impact by year and by currency, showing increasing NII benefit in future years under a rising rate scenario.
NII, Interest Rates, Yield Curve, Sensitivity, EUR, USD, Forecast
Multiple Chart
Deutsche Bank
Saved
The slide has a title at the top, text in the middle, and a column chart at the bottom illustrating COVID-19 impact on respondents.
Risk Assessment and Management
Healthcare & Pharmaceuticals
Presents data on COVID-19 impact, showing that 33% of respondents had COVID-19 or knew someone who had. Data is categorized by relationships such as family members and friends.
COVID-19, Impact, Survey, Health, Data
Single Chart
IPSOS
Saved
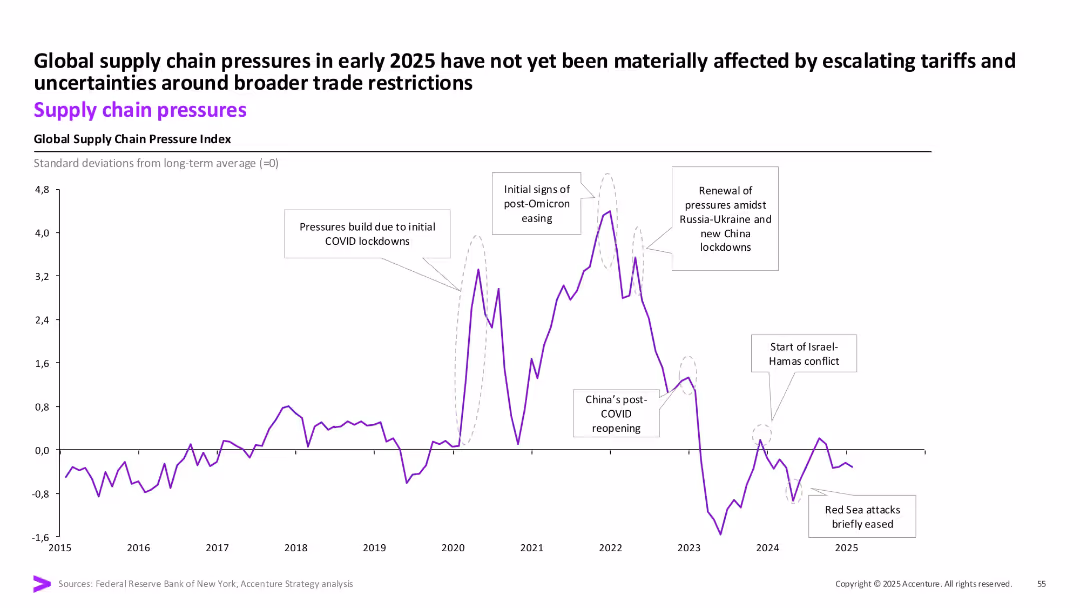
Line graph with annotations showing trends from 2015–2025, labeled inflection points, simple layout, purple theme.
Market Analysis and Trends
Professional Services
This slide analyzes global supply chain pressure trends over the past decade, highlighting key geopolitical and pandemic-related events that have influenced pressure points. It indicates that early 2025 pressures are relatively unaffected.
Supply chain, global index, COVID-19, Russia-Ukraine, trade restrictions, inflation
Single Chart
Accenture
Saved
Slide features line and column charts, with a prominent image of a mosque.
Market Analysis and Trends
Financial Services
Details Turkey's GDP growth, loan growth, and net interest margin compared to peers.
Turkey, GDP, loans, growth
Multiple Chart
Morgan Stanley
Saved
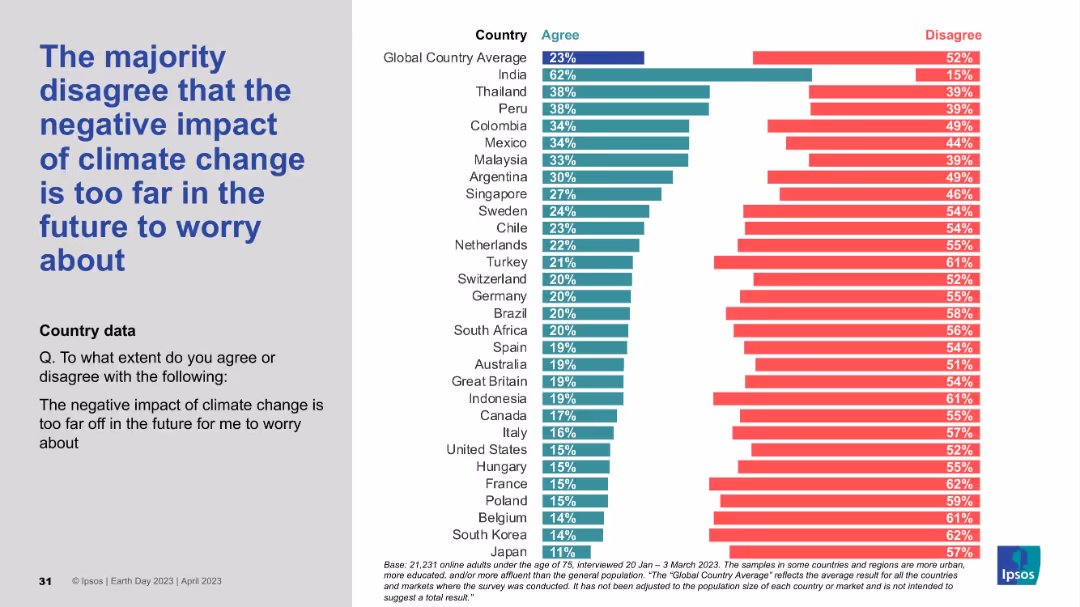
Split layout with bold blue text on the left and a horizontal bar chart on the right comparing country-level opinions.
Market Analysis and Trends
Environmental Services & Sustainability
This slide presents survey results showing that a global majority disagrees with the idea that climate change's negative effects are too distant to be concerned about. It compares agreement/disagreement percentages across countries, with India having the highest agreement and Japan the lowest.
climate change, public opinion, global survey, perception, country comparison, Ipsos, sustainability, environment, concern, urgency
Mixed Chart
IPSOS
Saved
Contains six column charts showing 3-5 year earnings growth, trailing 12 month P/E, return on equity, market cap, beta, and dividend yield for S&P 500. Bars are vertical with varying data points in each category.
Financial Performance
Financial Services
Analyzes the one-month return of the S&P 500 index through various financial metrics. Useful for understanding recent performance trends in the index and comparing it with different financial indicators.
S&P 500, earnings growth, P/E ratio, return on equity, market cap, beta, dividend yield
Multiple Chart
Morgan Stanley
Saved
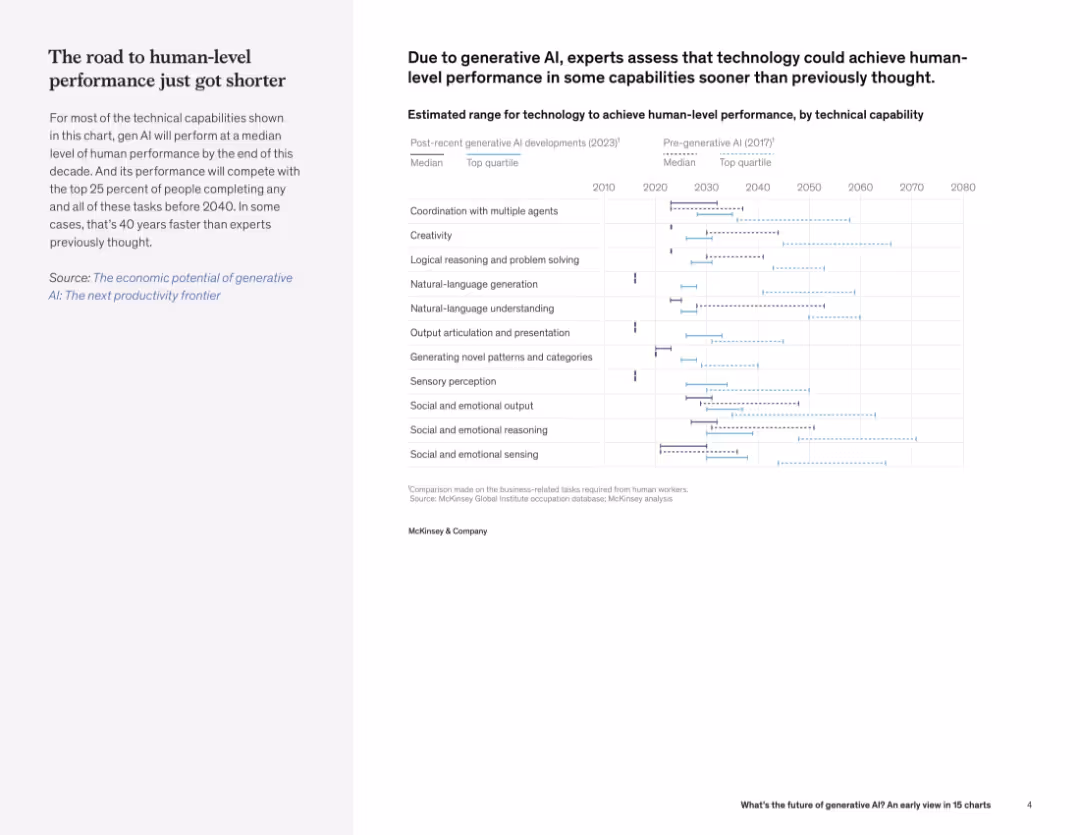
Horizontal timeline chart showing median and top quartile estimates for various AI capabilities pre- and post-2023; left panel interprets results.
Technology and Digital Transformation
Artificial Intelligence
This slide compares projections from 2017 and 2023 regarding when AI will achieve human-level performance in multiple capabilities. It highlights an accelerated timeline due to generative AI advancements.
generative AI, human-level performance, prediction, technical capability, productivity
Mixed Chart
McKinsey
Saved
This slide has a white background with red and black text. It includes a title and two sections titled 'Family law backlog' and 'Cost to finalisation comparison'. There are two column charts and a bar chart, displaying data from 2012-2017 with comparisons between the FCC and the FCoA. The layout is balanced with a mix of text and visuals.
Industry Overview
Government & Public Sector
The slide presents an executive summary focusing on the backlog of family law cases and the cost differences in case finalization between the FCC and FCoA. It uses statistical data to highlight trends and inefficiencies, likely used for regulatory review or public sector analysis.
Family law, backlog, court, cost, FCoA, FCC, finalization, expenditure, litigation, comparison
Multiple Chart
PwC/Strategy&
Saved
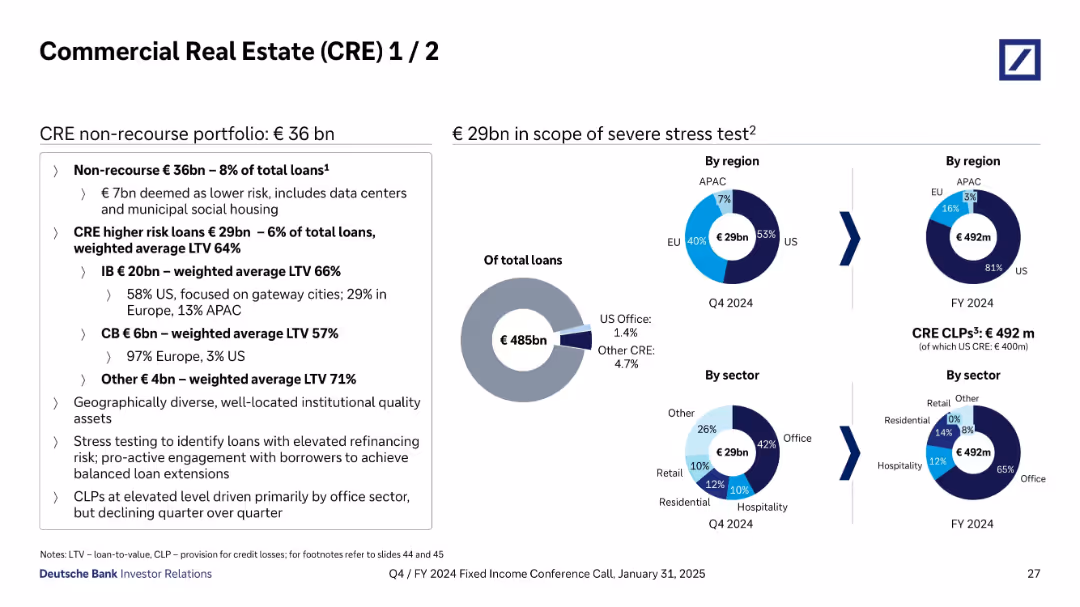
Split into two sections: left text box summarizing CRE portfolio composition; right side includes pie charts by region and sector and loan scope under stress test.
Risk Assessment and Management
Financial Services
Breaks down Deutsche Bank’s €36bn non-recourse CRE portfolio, highlighting €29bn in higher-risk loans and their geographic and sectoral distribution. Provides stress test scope and Credit Loss Provision data, notably focused on US office exposure.
CRE, stress test, LTV, CLPs, office loans, US exposure, EU, APAC, sectors
Mixed Chart
Deutsche Bank
Saved
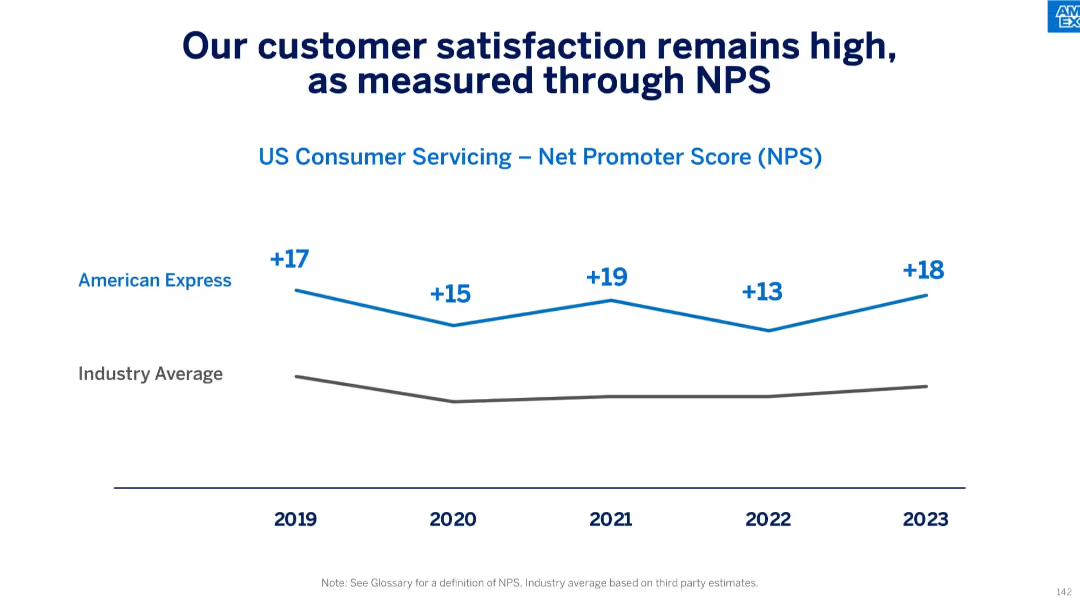
Line graph comparing Net Promoter Score (NPS) of American Express vs industry average from 2019–2023.
Performance Metrics and KPIs
Financial Services
This slide communicates strong customer satisfaction in U.S. consumer servicing, as reflected in American Express’ consistently high NPS, which remained above industry averages from 2019 through 2023, peaking at +19 in 2021 and rebounding to +18 in 2023.
NPS, customer satisfaction, consumer servicing, benchmark, Net Promoter Score, industry average, loyalty, performance
Single Chart
McKinsey
Saved
This slide presents line graphs detailing economic recovery under a scenario of virus recurrence with muted recovery, highlighting GDP changes and recovery timelines.
Financial Performance
Financial Services
Evaluates the potential economic outcomes of a recurring COVID-19 scenario, focusing on delayed or subdued economic recovery across key global markets.
GDP, economic downturn, COVID-19, muted recovery, markets
Single Chart
McKinsey
Saved
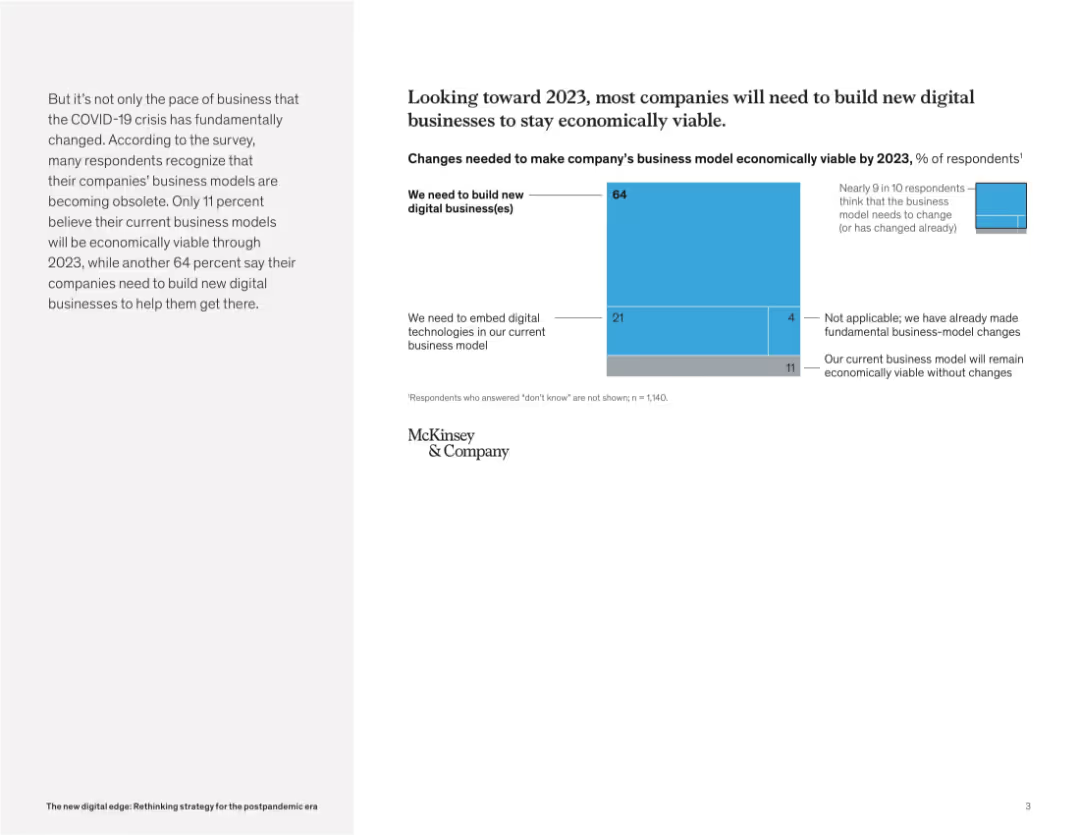
Simple layout with a stacked bar chart showing response breakdown. Left-aligned narrative block highlights survey insights.
Strategic Planning
Technology & Software
This slide shows that 64% of companies expect to build new digital businesses by 2023 to remain viable. Only 11% believe their current model is sustainable. It emphasizes the urgency for innovation and digital reinvention.
business viability, digital transformation, strategic change, digital model, innovation need, post-COVID recovery, McKinsey insights
Mixed Chart
McKinsey
Saved
Multiple line charts display sovereign and corporate EMD spreads, along with local EMD yields. Each chart is color-coded for clarity.
Market Analysis and Trends
Financial Services
The slide provides an update on the emerging markets bond market, analyzing sovereign, corporate spreads, and local yields, presenting recent trends and averages.
Emerging Markets, Bond Market, EMD Spreads, Local Yields, Trends
Multiple Chart
Morgan Stanley
Saved
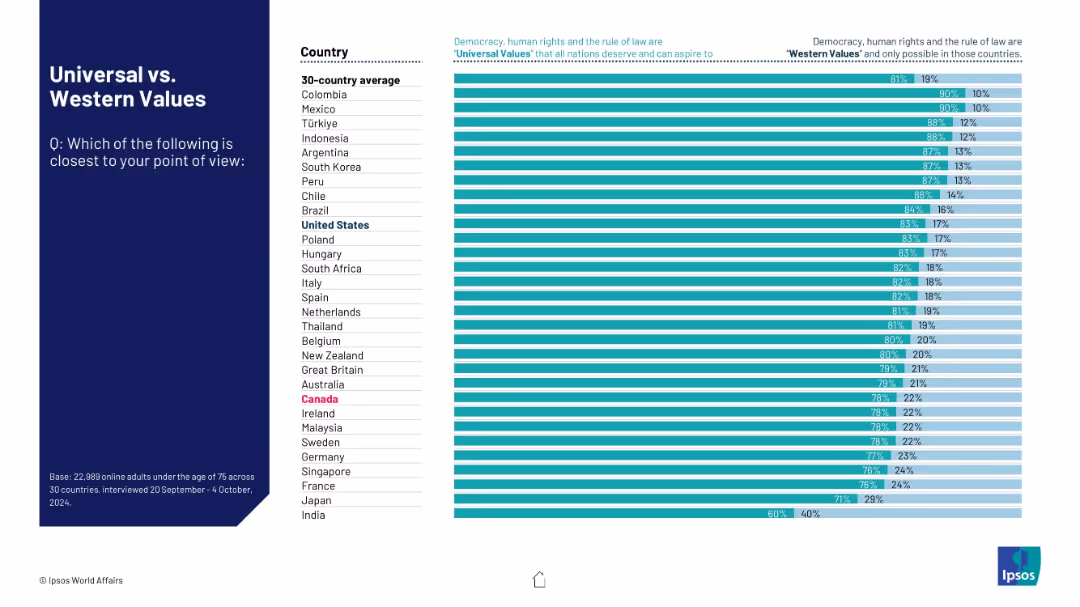
Two-column bar chart comparing country-level opinions on whether democracy, human rights, and rule of law are universal or Western values.
Market Analysis and Trends
Government & Public Sector
This slide presents survey results from 30 countries on public perceptions of democracy and human rights as either universal or Western values. The majority in every country view these as universal. The visual compares percentages with blue and teal bars for each option.
democracy, human rights, rule of law, global values, cultural perception
Mixed Chart
IPSOS
Saved
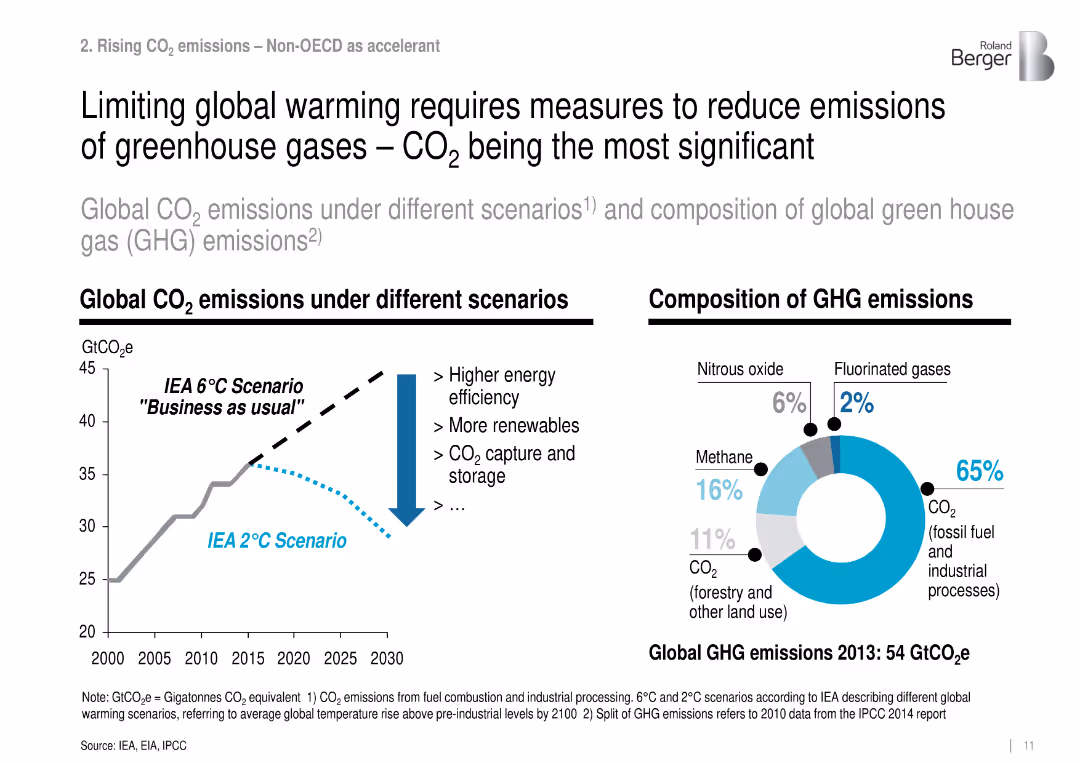
Dual-panel layout: line chart of CO₂ scenarios and donut chart of 2013 GHG composition.
Regulatory and Compliance
Environmental Services & Sustainability
Illustrates the need to reduce global CO₂ emissions by comparing a 2°C vs. 6°C scenario and shows GHG breakdown, with fossil CO₂ making up 65% of emissions.
CO₂ emissions, climate scenarios, GHG, mitigation, fossil fuel
Multiple Chart
Roland Berger
Saved
This slide contains a complex column chart with annotations.
Investment Analysis
Financial Services
This slide visualizes factors that investors prioritize in making investment decisions, highlighting growth, FCF generation, and business strategy as top factors.
investment, growth, strategy, FCF, business
Multiple Chart
BCG
Saved
A structured layout with four numbered sections, each comprising bold headings and subtext. The sections are neatly arranged and use contrasting colors for readability. No charts or images are present.
Market Analysis and Trends
Technology & Software
Provides a glimpse into the future of digital commerce, detailing the norms of digital merchants. This slide is informative for discussions on the evolution of e-commerce and business strategies.
Digital Merchant, 2030, SEA, Online, Digital Payment, BNPL, Digital Tools, Operational Efficiency
Linear Flow
Bain
Saved
Previous
Next
If nothing, comes up, please save your slides first
Create a FREE account to continue browsing
Receive Instant Access to 1,000+ slides from companies like McKinsey, Google, and Goldman Sachs
First Name
Last Name
Email
Password
I agree to all
Terms & Privacy Policy
Thank you! Your submission has been received!
Oops! Something went wrong while submitting the form.
Have an account?
Sign in
Column Chart
Heatmap
Chevron
Org Chart
Infographic
Callouts
Timeline
List
Graphic
Picture
Process Flow
Diagram
Paragraph
Map
Table
Framework
Subtitle
Takeaway Box
Icon
Other Chart
Radar Chart
Waterfall Chart
Mekko Chart
Pie Chart
Scatter Plot
Line Chart
Bar chart
Bullet points