My Account
My Slides
Search by Category
Templates
Leave Feedback
Login
Logout
Get Started
Browse all Slides
Browse all Slides
Create a FREE Account
Instant access to 1,000+ real slides from top companies like McKinsey, BCG, Goldman Sachs, Google and many more!
First Name
Last Name
Email
Password
I agree to all
Terms & Privacy Policy
Thank you! Your submission has been received!
Oops! Something went wrong while submitting the form.
Have an account?
Sign in
Saved Slides
This slide showcases a close-up image of a wet umbrella, with annotations highlighting potential business challenges like Earnings miss, Liquidity crunch, etc.
Strategic Planning
Professional Services
Focuses on defining strategic goals for business resilience, enumerating critical challenges that businesses might face under stress.
Resiliency, Business challenges, Strategic planning, Liquidity, Bankruptcy
Linear Flow
Bain
Saved
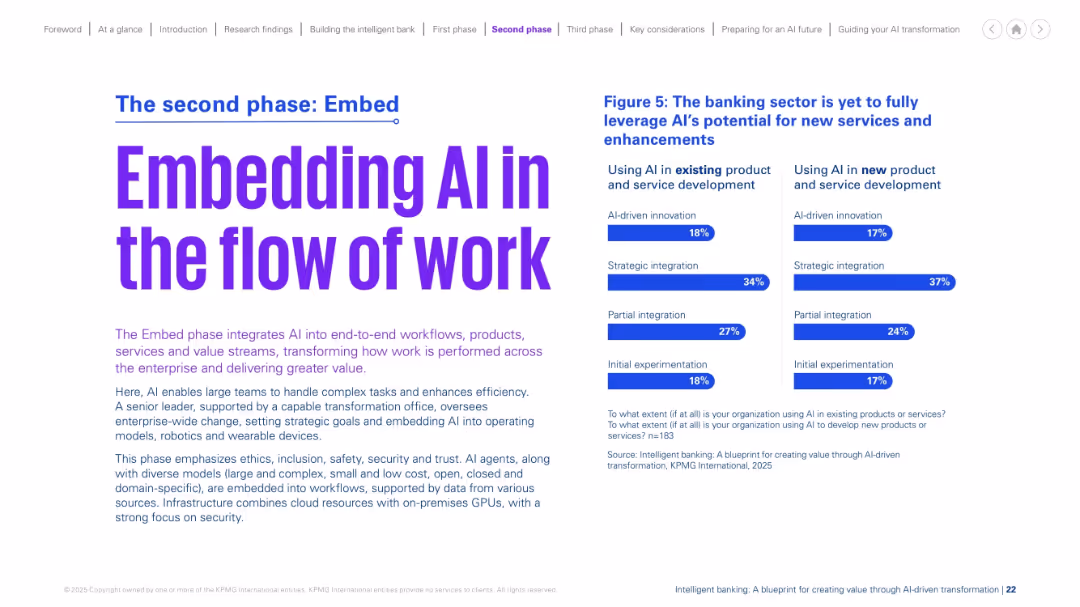
Bold purple headline on left, detailed explanation below. Bar charts on the right show AI adoption in existing vs. new products. Light and clean layout, evenly spaced sections.
Technology and Digital Transformation
Financial Services
This slide introduces the "Embed" phase of AI adoption, which integrates AI into workflows and value streams. It discusses AI's limited current use in product innovation, highlighting gaps in strategic integration. The layout contrasts usage in existing versus new services, reflecting untapped AI potential within banking.
embed, AI workflows, adoption, innovation, product development, banking
Mixed Chart
KPMG
Saved
Displays column charts and maps illustrating the old-age dependency ratio and median age by region for 2020 and 2050.
Market Analysis and Trends
Government & Public Sector
Focuses on the increasing old-age dependency ratio worldwide, particularly in developed regions, and discusses the challenges and policy implications for healthcare, pensions, and labor markets.
aging, dependency ratio, policy, healthcare, demographics
Multiple Chart
Roland Berger
Saved
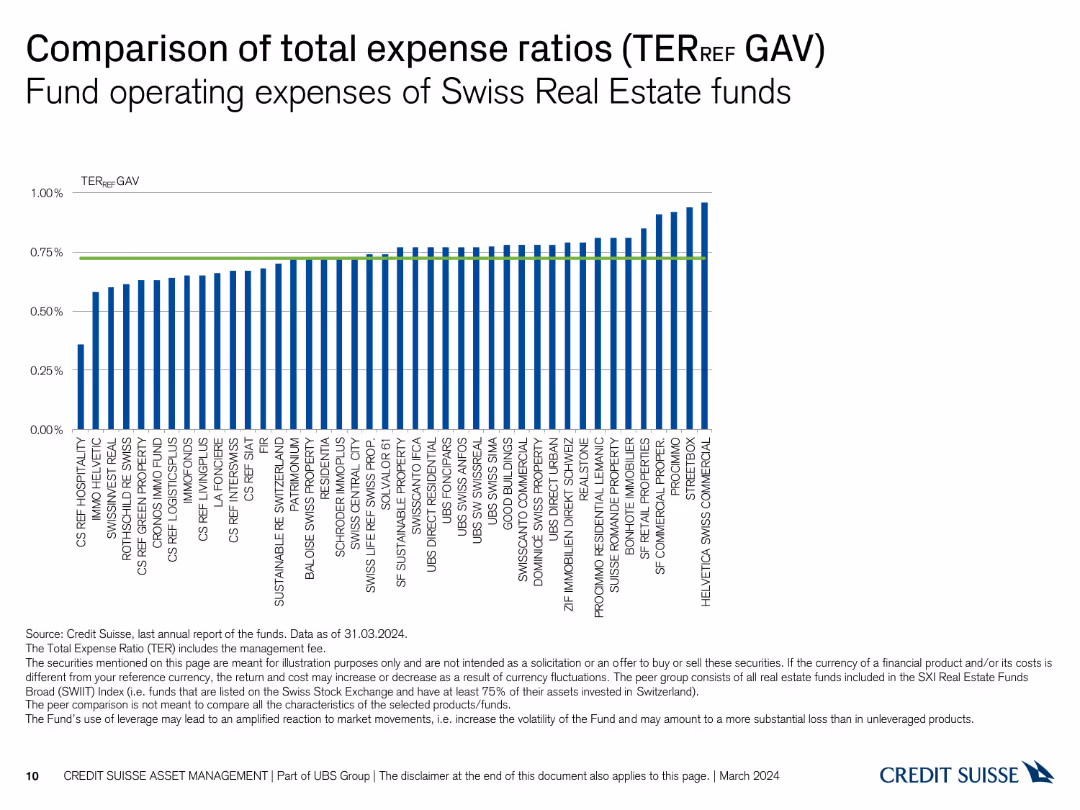
The slide displays a column chart comparing the total expense ratios (TER) of various Swiss Real Estate funds, with a green line indicating the average TER across all funds.
Financial Performance
Real Estate & Construction
This slide compares the total expense ratios (TER) of Swiss Real Estate funds, highlighting differences in operating expenses relative to gross asset value (GAV).
expense ratio, TER, real estate, funds, comparison
Single Chart
Credit Suisse
Saved
A more detailed slide featuring three main content sections, each with a distinct icon and bullet points, discussing broad uncertainties affecting Web3 adoption. The design uses a combination of blue, white, and grey.
Risk Assessment and Management
Technology & Software
This slide examines broader uncertainties affecting Web3 adoption, such as evolving regulation, user experience challenges, and ecosystem infrastructure maturity. It's meant to present a critical perspective on Web3's potential impact across various sectors.
Regulation, User Experience, Ecosystem Infrastructure, Web3
Boxed
McKinsey
Saved
A three-part comparative layout discussing major M&A highlights across industries, including energy, financial services, and consumer sectors.
Market Analysis and Trends
Financial Services
Highlights key M&A activities in 2020, focusing on industries like energy and financial services, including major deals and industry impacts.
M&A, 2020, Philippines, energy, financial services, consumer, industry focus
Pillar
Deloitte
Saved
A column chart showing regular and supplemental dividend history from Q2'20 to Q4'23, with corresponding dividend yields.
Financial Performance
Financial Services
This slide illustrates the dividend history of the company over several quarters, indicating the consistency and growth of dividend payouts and their yields.
Dividends, Column Chart, Financial History, Yields, Q2'20-Q4'23
Mixed Chart
Morgan Stanley
Saved
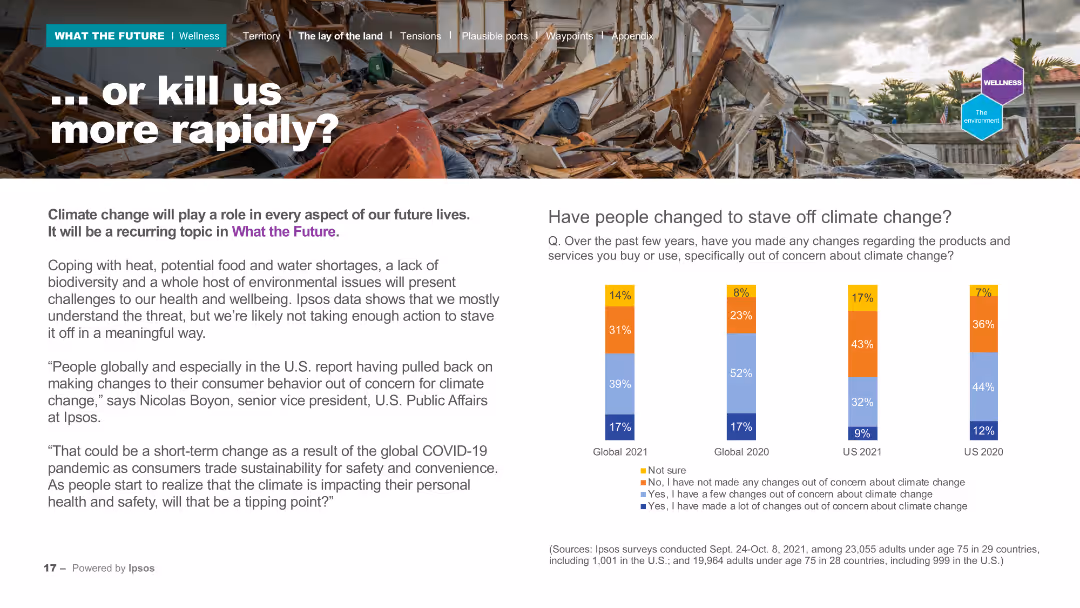
The slide contains a header, a background image of a destroyed house, and two main sections: a text block on the left and a column chart on the right. The column chart presents data on people's changes in behavior to address climate change across different years, using multiple colors for comparison.
Risk Assessment and Management
Environmental Services & Sustainability
Examines the role of climate change in future lives and the lack of significant action despite understanding the threat. The column chart compares behavioral changes regarding climate change between 2020 and 2021, showing the trends in public actions to mitigate environmental impact.
Climate change, behavior, future, survey, environment
Mixed Chart
IPSOS
Saved
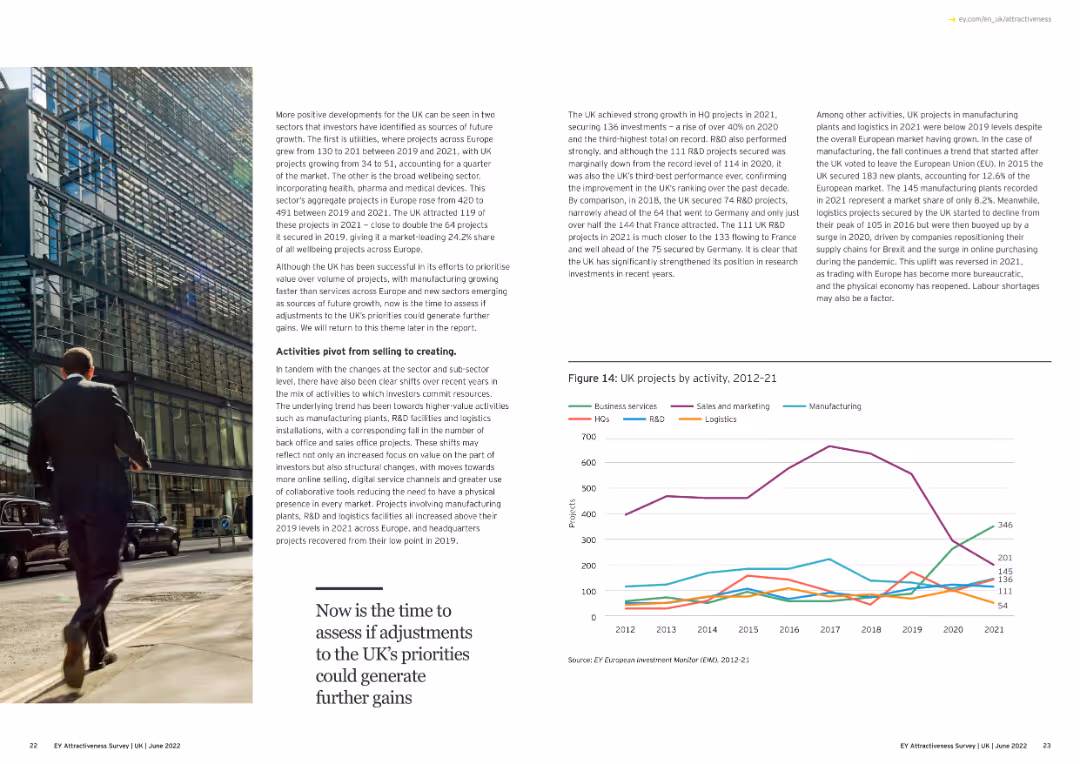
The slide features a line chart showing the leading sectors for investment in the UK from 2012 to 2021, with lines representing different sectors.
Market Analysis and Trends
Financial Services
This slide highlights the top sectors attracting investment in the UK over the years, providing insight into economic focus areas.
investment, sectors, UK, trends, 2012-21
Mixed Chart
EY
Saved
It includes a large column chart with data points in blue, visual representations of percentages, and a series of bullet points on a white and blue background.
Financial Performance
Financial Services
This slide shows the financial outcomes of personal banking and wealth management, including net interest income, revenues, and net income, accompanied by key performance indicators. Suitable for assessing the health and trends of personal banking and wealth management services.
wealth management, personal banking, net interest, revenue, credit costs
Mixed Chart
Citigroup
Saved
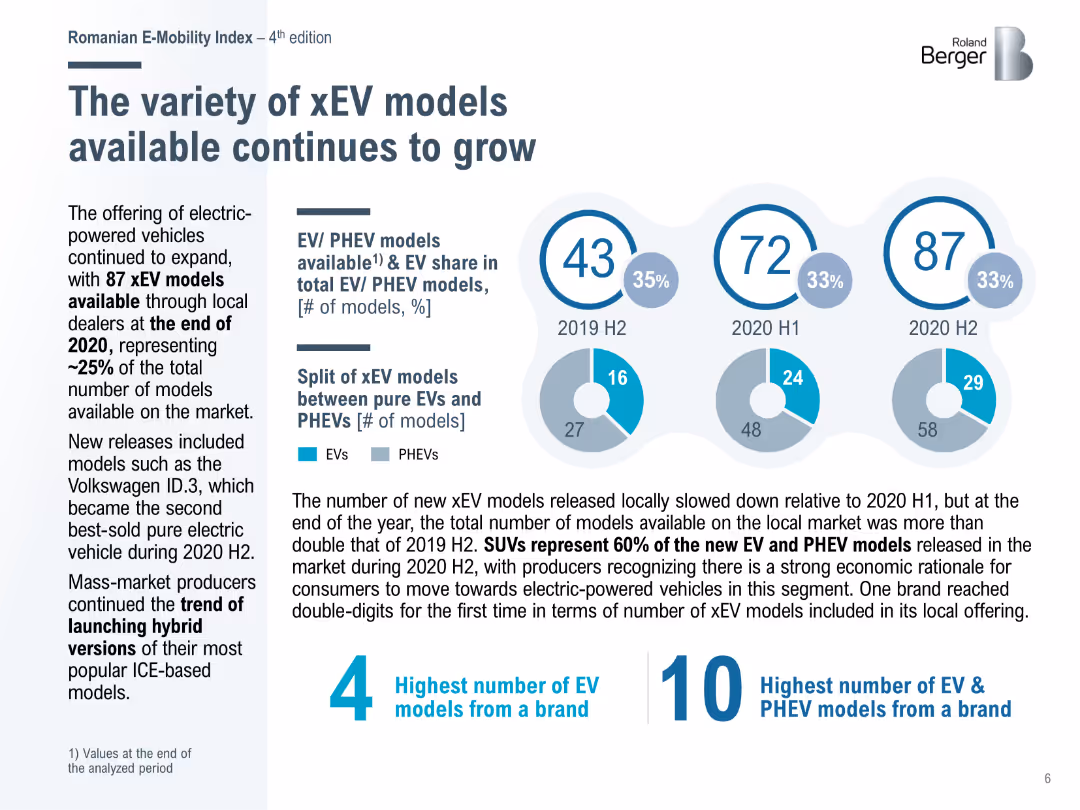
Pie charts showing the growth in the number of EV and PHEV models available in Romania from 2019 to 2020, with a focus on the increasing variety of electric vehicles.
Product and Service Analysis
Transportation & Logistics
Discusses the expanding variety of xEV models available in the Romanian market, emphasizing the growth in model offerings and the increasing consumer choice for electric vehicles.
xEV models, EV variety, Romania, market growth, 2020
Mixed Chart
Roland Berger
Saved
A column chart showing the share of total time viewed on Netflix for its top 10 shows over various weeks. The bars are segmented into categories like Movies, Acquired, and Originals, with a legend for reference.
Competitive Landscape
Media & Entertainment
This slide illustrates the weekly share of total viewing time on Netflix for its top 10 shows, categorized by type (Movies, Acquired, Originals), highlighting the platform's content performance from October to December.
Netflix, viewing time, top 10 shows, content performance, weekly data
Single Chart
Nielsen
Saved
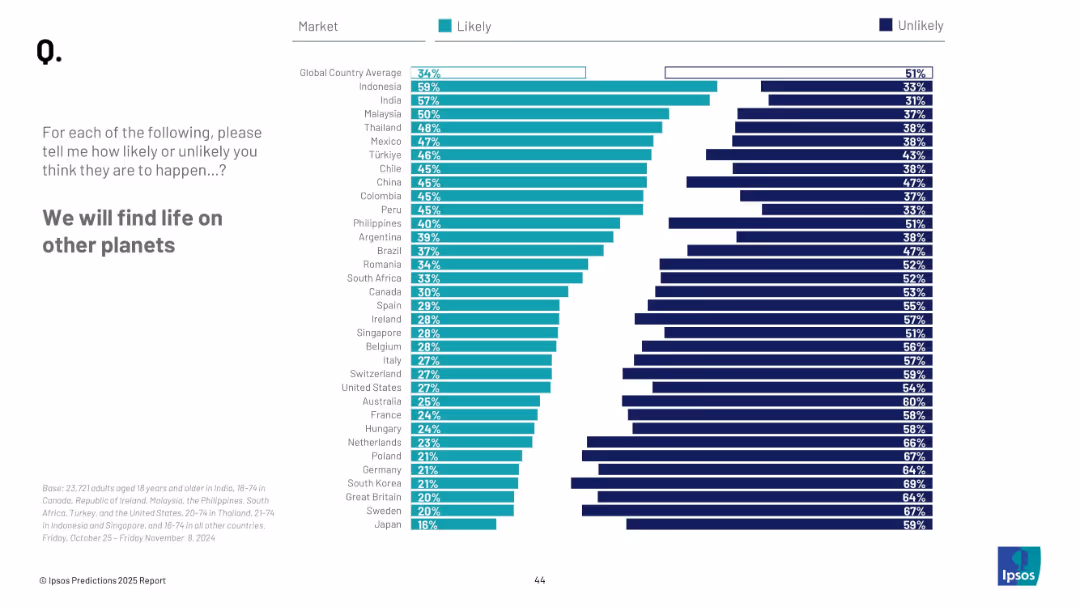
Horizontal bar chart with ranked countries; “Likely” vs “Unlikely” columns in teal/navy
Strategic Planning
Government & Public Sector
This slide gauges belief in discovering extraterrestrial life. Countries like Indonesia and India show higher optimism; global average is 34% likely.
space, extraterrestrial, discovery, science, global opinion, life on planets, belief, Ipsos survey
Mixed Chart
IPSOS
Saved
Line charts illustrating AAA muni-to-treasury yield ratios and credit quality spreads vs. AAA over time.
Market Analysis and Trends
Financial Services
Provides updates on municipal bond market, focusing on yield ratios and credit quality spreads for different time frames.
Municipal Bonds, Yield Ratios, Credit Quality, Market Update, Financial Analysis
Multiple Chart
Morgan Stanley
Saved
Incorporates multiple bubble charts showing the value at stake by digital initiatives in the automotive industry. Uses color coding to differentiate between types of value and initiatives.
Market Analysis and Trends
Transportation & Logistics
Details the $2 trillion potential from digital initiatives in the automotive sector, emphasizing multimodal integration and digital enterprise.
Automotive, Digital Transformation, Industry Value, Societal Impact, Efficiency
Mixed Chart
Accenture
Saved
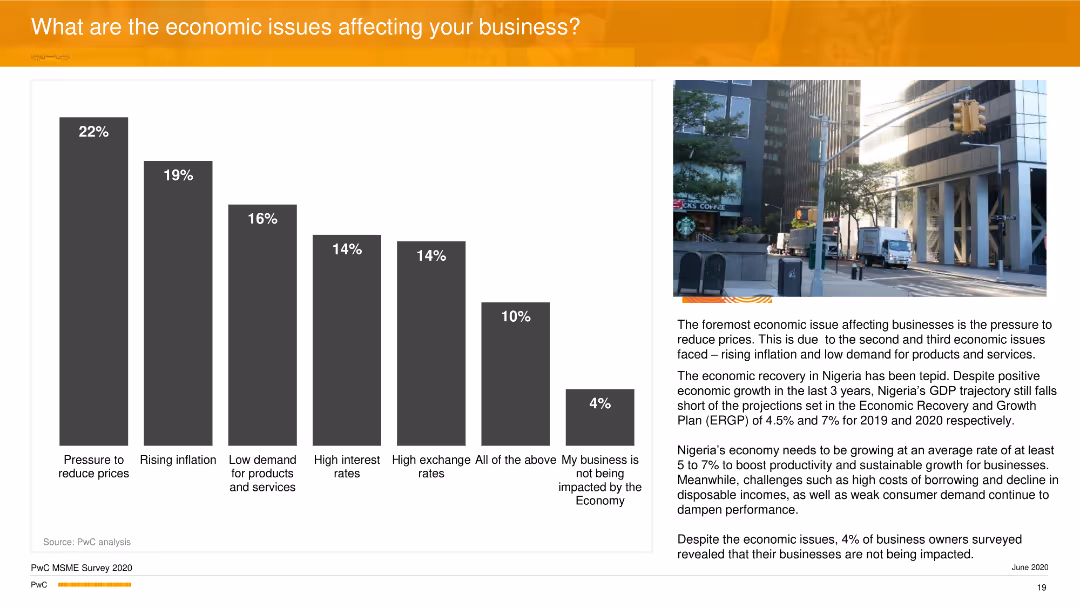
This slide includes a vertical column chart detailing economic issues such as price reduction pressures and inflation. A cityscape image is placed on the right.
Risk Assessment and Management
Financial Services
The slide details economic challenges affecting businesses, with pressure to reduce prices and rising inflation being the most significant. It discusses the overall impact on Nigeria's GDP and business performance.
Economic Issues, Inflation, Business, GDP, PwC
Mixed Chart
PwC/Strategy&
Saved
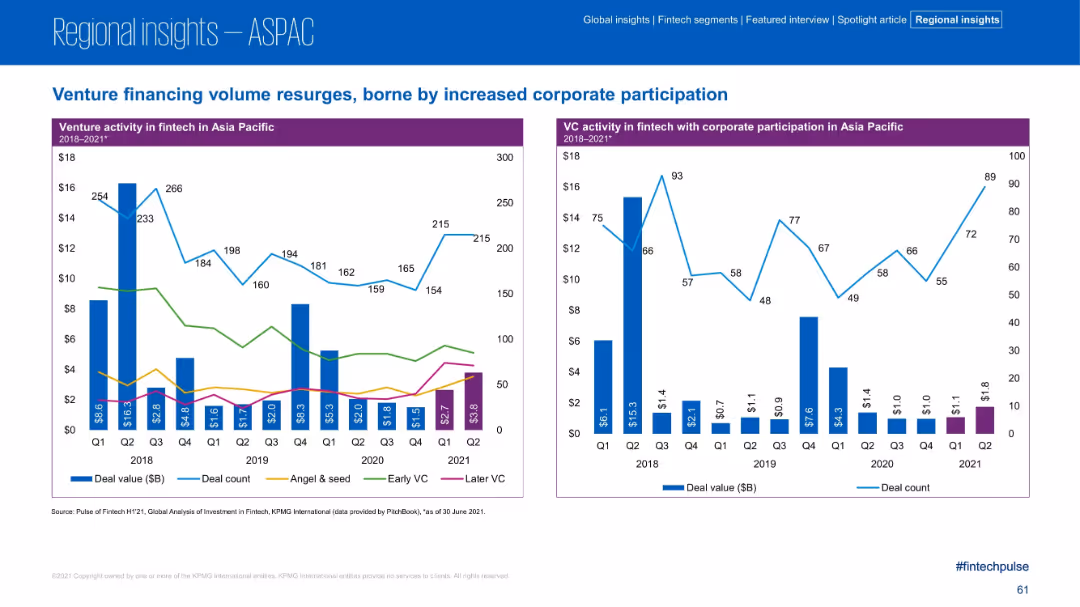
Dual charts showing deal value trends by financing stage and corporate participation.
Strategic Planning
Financial Services
The left chart disaggregates venture financing by stage, while the right shows corporate participation trends in VC deals. The slide highlights resurgence in corporate-backed VC deals after a decline, signaling renewed strategic interest.
VC, Corporate Participation, Financing Stages, Early VC, Later VC
Multiple Chart
KPMG
Saved
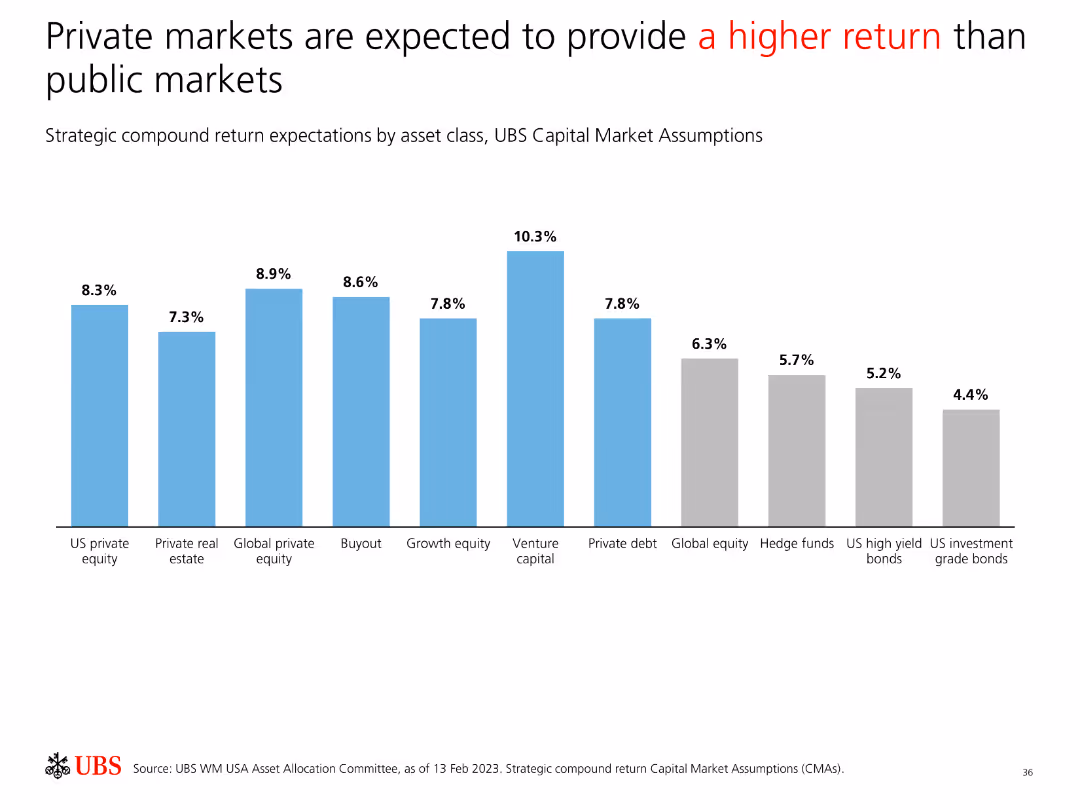
Features a bar chart comparing strategic compound return expectations by asset class, indicating higher returns for private markets compared to public markets.
Investment Analysis
Financial Services
Compares strategic compound return expectations, demonstrating that private markets are projected to offer higher returns than public markets across various asset classes.
Private Markets, Public Markets, Return Expectations, Asset Classes, Investment, Analysis, Comparison, Strategy, Performance
Single Chart
UBS
Saved
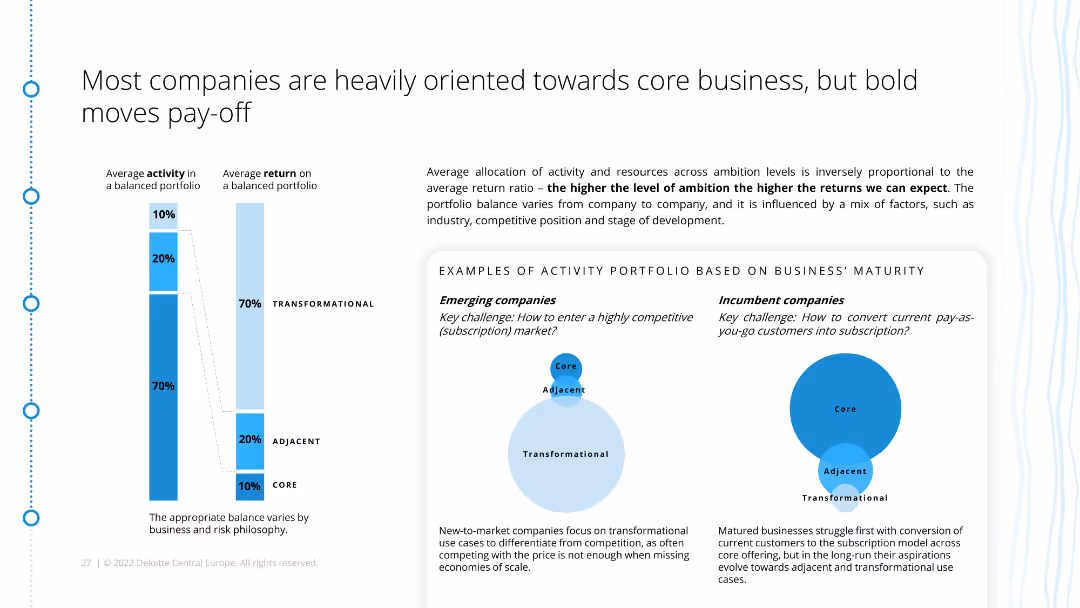
The slide features a diagram comparing the activity portfolios of emerging and incumbent companies, showing different approaches to subscription models. It includes explanatory text and examples.
Strategic Planning
Consumer Goods
This slide contrasts the subscription strategies of emerging and mature companies, emphasizing the balance between core, adjacent, and transformational activities for optimal returns.
business maturity, activity portfolio, subscription models, strategic planning, emerging companies, incumbents, ecommerce, retail
Mixed Chart
Deloitte
Saved
Slide contains charts and visual elements that illustrate the enhancement of digital services.
Technology and Digital Transformation
Financial Services
Discusses the role of digital transformation in enhancing service delivery, focusing on customer experience and operational efficiency.
Digital, Services, Enhancement, Technology
Single Chart
Barclays
Saved
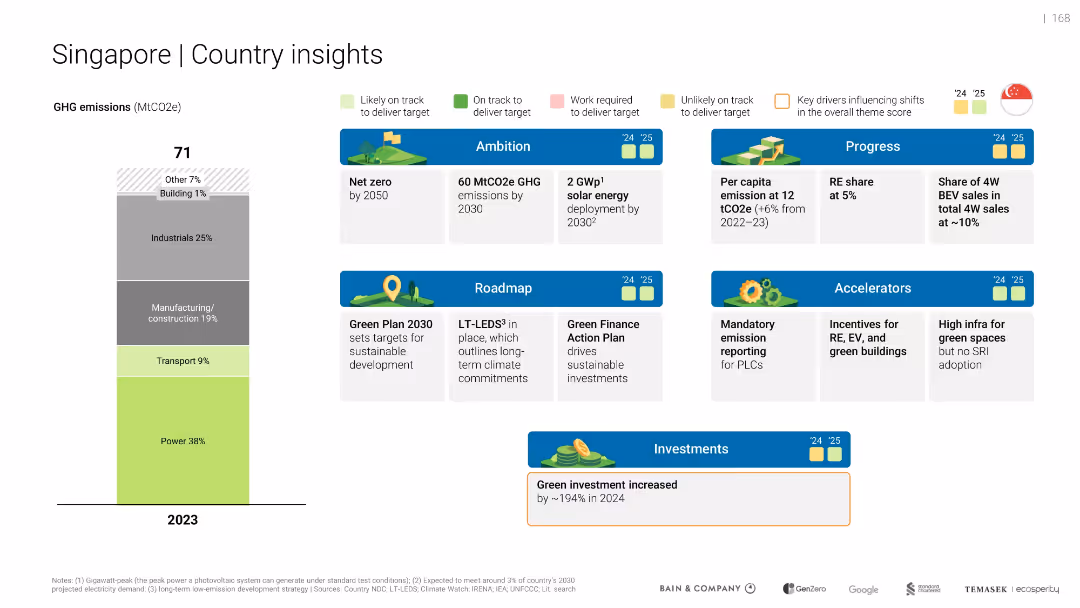
Vertical emissions breakdown bar and multiple colored status cards arranged in grid. Color-coded icons for tracking performance and roadmaps.
Strategic Planning
Government & Public Sector
Presents Singapore’s GHG emissions by sector (2023) and outlines goals, progress, and policy measures for decarbonization and green investment. Includes visual indicators for performance against targets.
Singapore, emissions, targets, solar energy, RE share, green finance
Mixed Chart
Bain
Saved
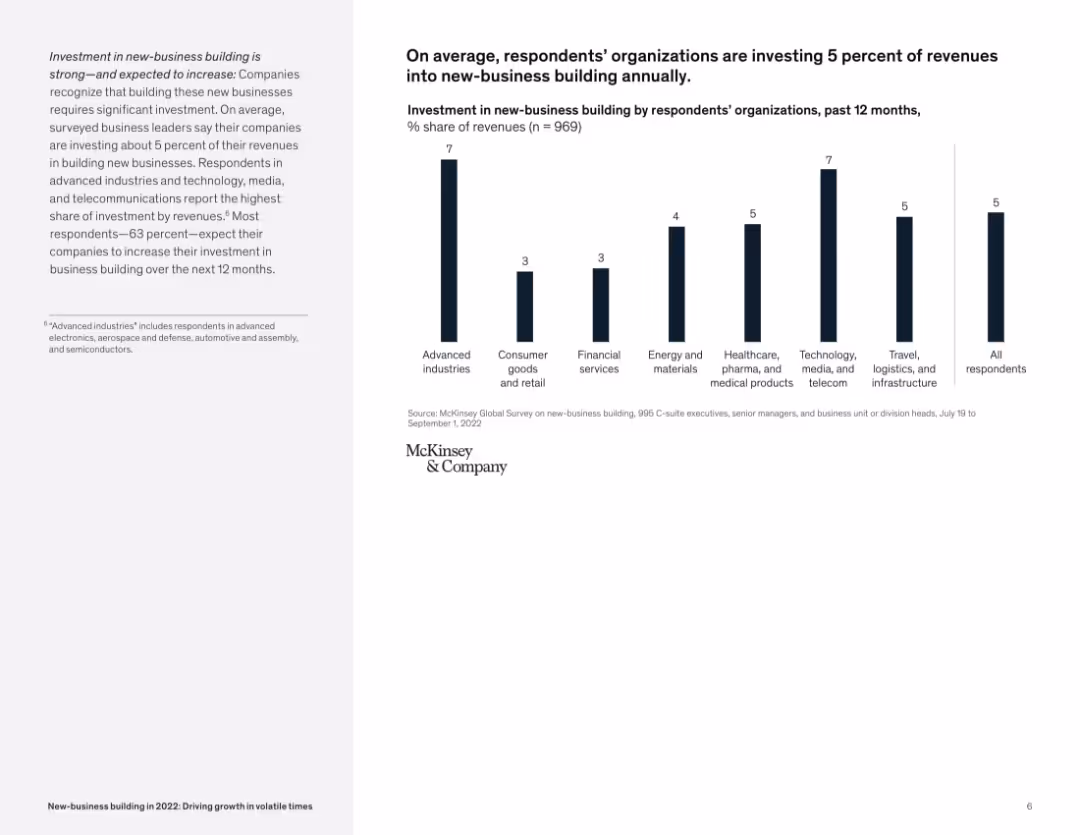
Clean bar chart showing % of revenue invested by industry; left-side summary text contextualizes findings.
Investment Analysis
Professional Services
The slide summarizes survey findings that companies are investing 5% of their revenues into new-business building, with advanced industries and technology sectors investing the most. Most companies also expect to increase investments.
investment, new-business, revenue allocation, survey, industry trends, business building
Mixed Chart
McKinsey
Saved
This slide features two column charts comparing firmwide management fees and AUS across several years. It is informative with additional key figures and growth opportunities listed, emphasizing on the increasing trend in a visually distinct manner with the use of color and size.
Financial Performance
Financial Services
Analyzes growth in management fees and AUS, showcasing the firm's growing financial stature and market opportunities, suitable for financial planning and forecasting discussions.
Growth, management fees, AUS, financial analysis
Mixed Chart
Goldman Sachs
Saved
An informative slide with numerical data displayed in a tabular form on the left and a large blue textbox on the right. The slide is visually balanced, contrasting the factual data with a persuasive textual message.
Market Analysis and Trends
Retail & E-commerce
Focuses on the factors that inspire consumer interest in new online stores, specifically the allure of unique products and good deals, as demonstrated by customer response data in various Southeast Asian countries.
online stores, consumer interest, unique products, good deals, market trends, Southeast Asia, customer data, new brands
Boxed
Bain
Saved
Slide shows a large donut chart with segments for different advertising formats by revenue share in FY 2020, and a bar chart comparing 2019 vs 2020 revenue. Red and black theme.
Market Analysis and Trends
Media & Entertainment
The slide analyzes advertising revenue by format for FY 2020, highlighting growth in Digital Video and overall market share. It contrasts these with previous year figures, showing the evolution and shifts in the market.
advertising, revenue, digital video, FY 2020, growth, market share, comparison, formats
Multiple Chart
PwC/Strategy&
Saved
Previous
Next
If nothing, comes up, please save your slides first
Create a FREE account to continue browsing
Receive Instant Access to 1,000+ slides from companies like McKinsey, Google, and Goldman Sachs
First Name
Last Name
Email
Password
I agree to all
Terms & Privacy Policy
Thank you! Your submission has been received!
Oops! Something went wrong while submitting the form.
Have an account?
Sign in
Column Chart
Heatmap
Chevron
Org Chart
Infographic
Callouts
Timeline
List
Graphic
Picture
Process Flow
Diagram
Paragraph
Map
Table
Framework
Subtitle
Takeaway Box
Icon
Other Chart
Radar Chart
Waterfall Chart
Mekko Chart
Pie Chart
Scatter Plot
Line Chart
Bar chart
Bullet points