My Account
My Slides
Search by Category
Templates
Leave Feedback
Login
Logout
Get Started
Browse all Slides
Browse all Slides
Create a FREE Account
Instant access to 1,000+ real slides from top companies like McKinsey, BCG, Goldman Sachs, Google and many more!
First Name
Last Name
Email
Password
I agree to all
Terms & Privacy Policy
Thank you! Your submission has been received!
Oops! Something went wrong while submitting the form.
Have an account?
Sign in
Saved Slides
Features a column chart showing the growth of the online luxury goods market from 2015 to 2025F.
Market Analysis and Trends
Retail & E-commerce
Highlights the explosive growth of the online luxury goods market, predicting continued expansion and digital influence through 2025.
online, luxury, market, growth, 2025
Multiple Chart
Bain
Saved
Features column chart and a checklist of key highlights. The charts depict the strategic asset growth in bank entities over several years, showing a trend of increasing asset percentages. The slide uses a clear, simple layout for the display of quantitative growth data.
Strategic Planning
Financial Services
This slide illustrates the strategic growth of assets within bank entities over time, highlighting the firm's objectives such as diversifying business and optimizing capital position. This slide is typically used in strategic planning sessions to discuss growth objectives and performance against benchmarks.
Asset Growth, Strategic Planning, Bank Entities, Performance, Capital Optimization
Mixed Chart
Goldman Sachs
Saved
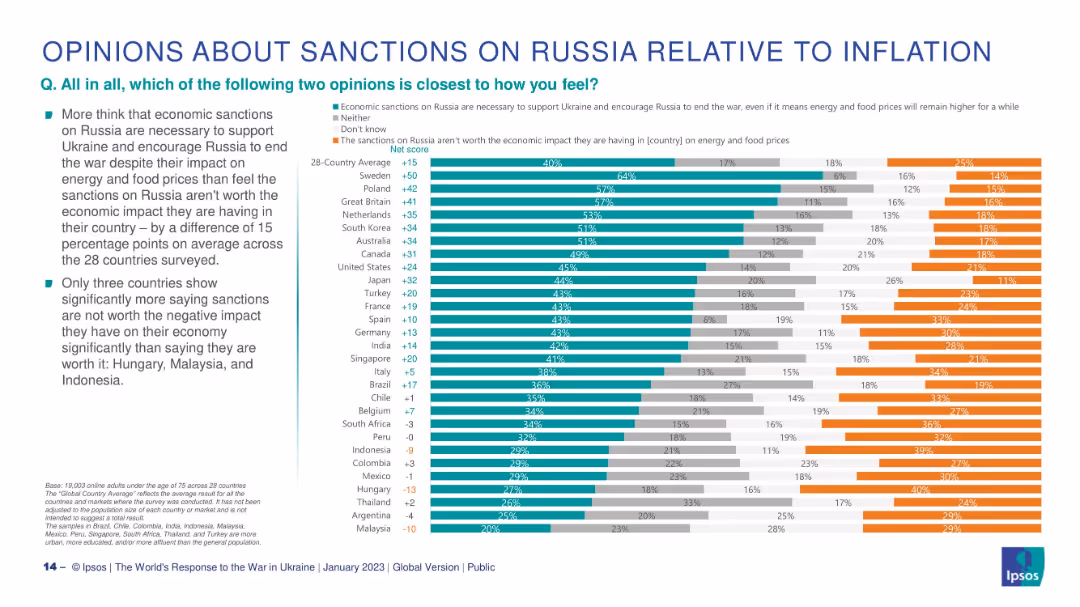
Horizontal stacked bar chart per country; green = pro-sanctions, orange = anti-sanctions, gray = neutral/don’t know.
Pricing Strategies
Government & Public Sector
This slide explores whether citizens think economic sanctions on Russia are justified despite inflation. It shows a 28-country net score comparison with only 3 countries (Hungary, Malaysia, Indonesia) predominantly opposing sanctions due to economic consequences.
sanctions, inflation, economic impact, Ukraine, public opinion, Ipsos, international response
Mixed Chart
IPSOS
Saved
A content slide with text on the left and two column charts on the right. The charts measure the robustness of organizational controls and risk management leadership responsibilities.
Risk Assessment and Management
Financial Services
The slide emphasizes the importance of risk culture in organizations, discussing control concepts and leadership responsibilities in risk management.
risk culture, controls, leadership, management, organization
Multiple Chart
EY
Saved
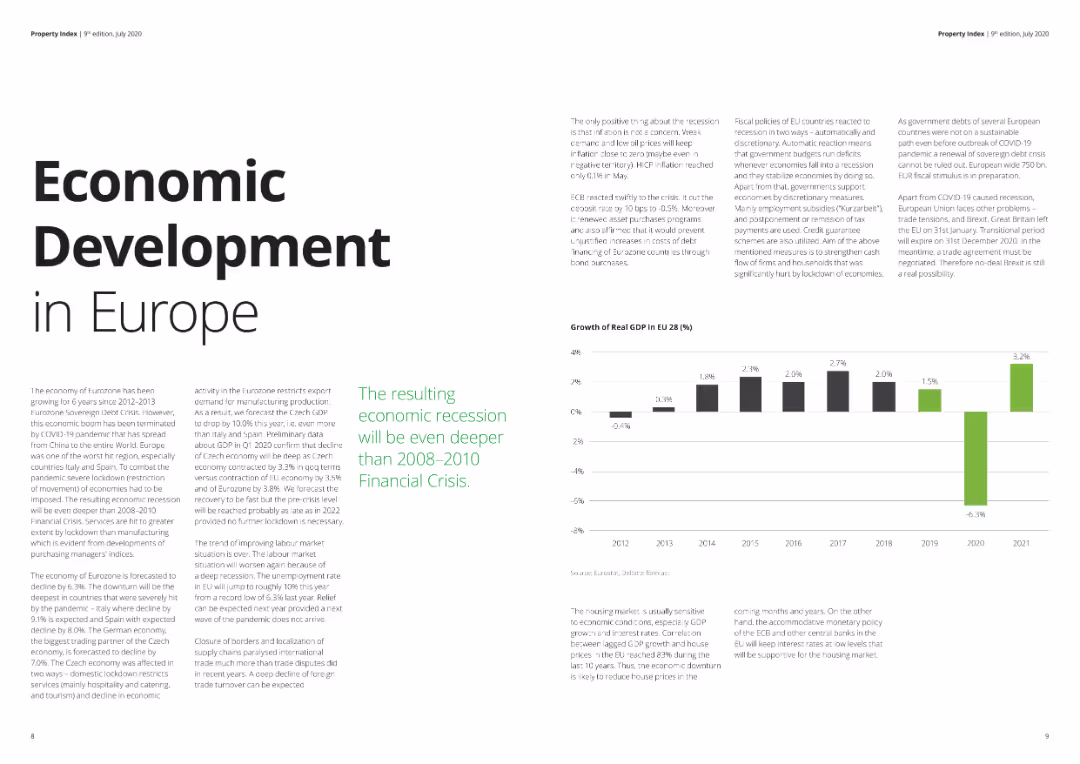
The slide features text detailing economic conditions in Europe, supported by a column chart showing GDP growth rates from 2012 to 2021. The layout is clean with ample white space, suitable for general audiences. Visual complexity is basic.
Market Analysis and Trends
Real Estate & Construction
Provides an overview of economic development in Europe, discussing the impact of the COVID-19 pandemic on GDP growth and the expected economic recession. Useful for understanding broader economic trends and their implications on various sectors.
Economic development, Europe, GDP, recession, COVID-19
Mixed Chart
Deloitte
Saved
Features a three-part Venn diagram linking brand equity, product experience, and pricing to consumer value. The slide is simple with minimal text, focusing on the diagram for impact.
Product and Service Analysis
Consumer Goods
Highlights the relationship between brand equity, product differentiation, and pricing strategy in creating consumer value. Useful for marketing strategy discussions and product development meetings.
consumer value, brand equity, pricing, marketing strategy, Clorox
Framework
Barclays
Saved
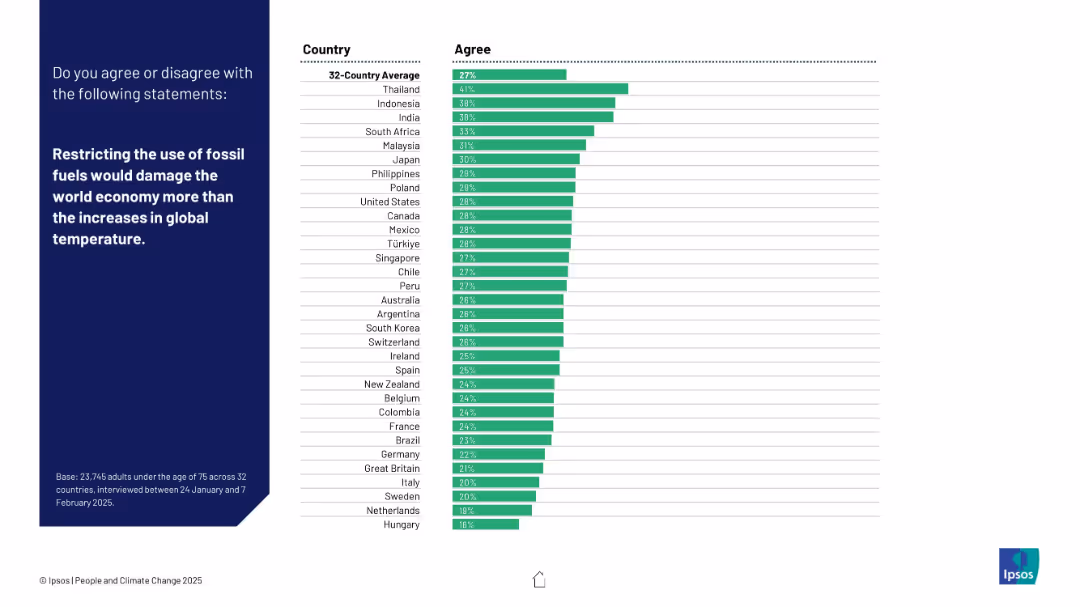
Standard layout with a horizontal bar chart showing agreement by country.
Strategic Planning
Environmental Services & Sustainability
Respondents were asked whether limiting fossil fuels would hurt the economy more than climate change. Thailand leads in agreement; Western countries show low support.
fossil fuels, economic impact, climate policy, temperature rise, global economy, Ipsos, energy strategy, environment vs economy, public opinion, international survey
Mixed Chart
IPSOS
Saved
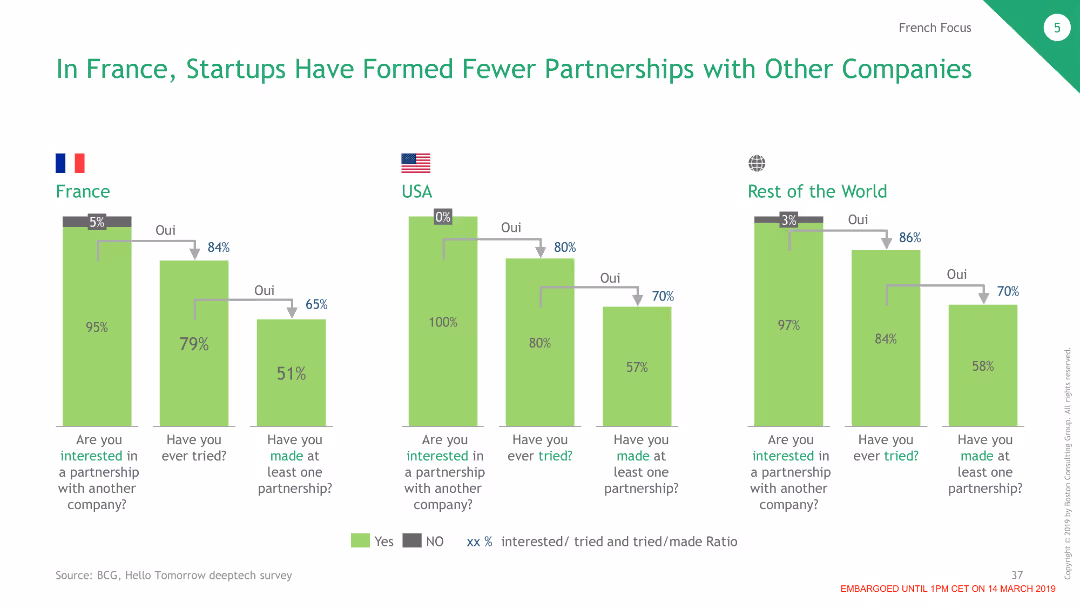
The slide presents column charts comparing partnership formation rates among startups in France, the USA, and the RoW.
Market Analysis and Trends
Professional Services
Analyzes the lower rates of partnership formation among French startups compared to their counterparts in the USA and the RoW.
partnerships, startups, France, USA, RoW
Multiple Chart
BCG
Saved
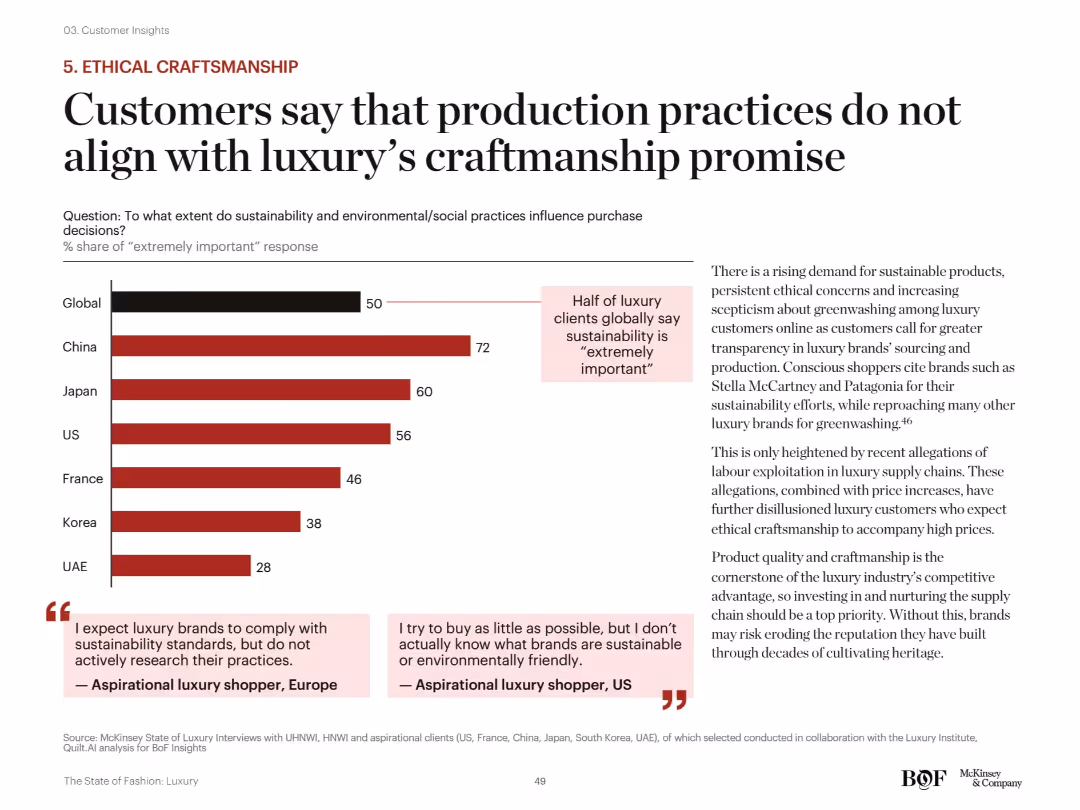
Left: bar graph showing importance of sustainability by region; Right: supporting analysis and customer quotes. Red bars highlight gaps between brand promises and consumer expectations.
Customer and Market Segmentation
Consumer Goods
The slide reveals that 50% of global luxury clients find sustainability “extremely important,” with China ranking highest. Consumers are skeptical of greenwashing and expect brands to uphold ethical craftsmanship and transparency, especially amid labor controversy reports.
sustainability, ethical sourcing, craftsmanship, greenwashing, consumer trust, transparency, environmental standards
Mixed Chart
McKinsey
Saved
Dark green background with white text, a column chart showing recycling percentages for various materials, including paper, glass, plastic, and electronic devices.
Regulatory and Compliance
Consumer Goods
The slide highlights the low recycling rates for e-waste compared to other materials, using survey data to emphasize the need for better recycling practices for electronics.
E-waste, recycling rates, materials, survey, sustainability
Multiple Chart
Oliver Wyman
Saved
Continues from the previous slide, adding further technological innovations and their implications for various sectors.
Technology and Digital Transformation
Technology & Software
Continues to detail emerging space technologies, including laser communications, edge computing, and in-orbit servicing capabilities.
space technologies, communications, digital capabilities, deep-space exploration
Header Horizontal
McKinsey
Saved
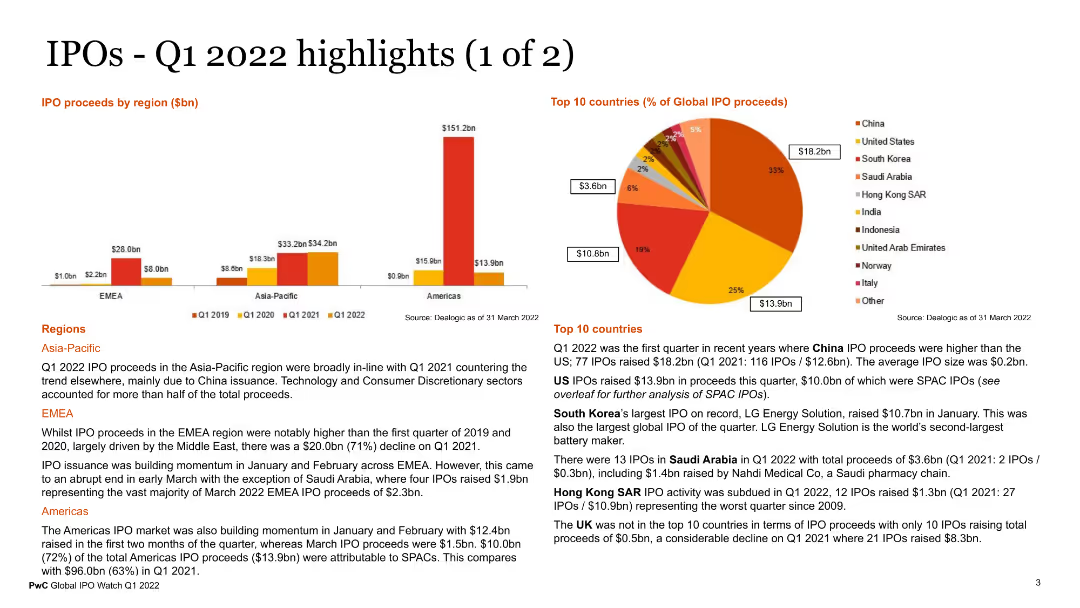
The slide features multiple visual elements, including a column chart for IPO proceeds by region, a pie chart for the top 10 countries by global IPO proceeds, and text sections detailing regional IPO activities in Asia-Pacific, EMEA, and the Americas. The charts use various colors to represent different data points.
Market Analysis and Trends
Financial Services
This slide presents key highlights of IPO activities in Q1 2022, with detailed regional analysis and top countries contributing to IPO proceeds. It provides a clear picture of global IPO trends and regional performance, useful for investors and market analysts.
IPO highlights, Q1 2022, regional analysis, global IPOs, financial trends
Multiple Chart
PwC/Strategy&
Saved
A clear title is followed by a column chart comparing traditional commerce and e-commerce carbon footprints, with a scenario for optimized e-commerce. Text to the right provides strategies for footprint reduction. The blue color scheme is consistent and visually appealing.
Operational Efficiency
Technology & Software
This slide offers a comparison of carbon footprints between traditional and digital commerce and suggests that optimized e-commerce can significantly reduce carbon emissions. It serves to guide strategies for operational efficiency in reducing carbon footprints within the digital economy.
carbon footprint, e-commerce, optimization, traditional commerce, reduction strategies, digital channels
Multiple Chart
Bain
Saved
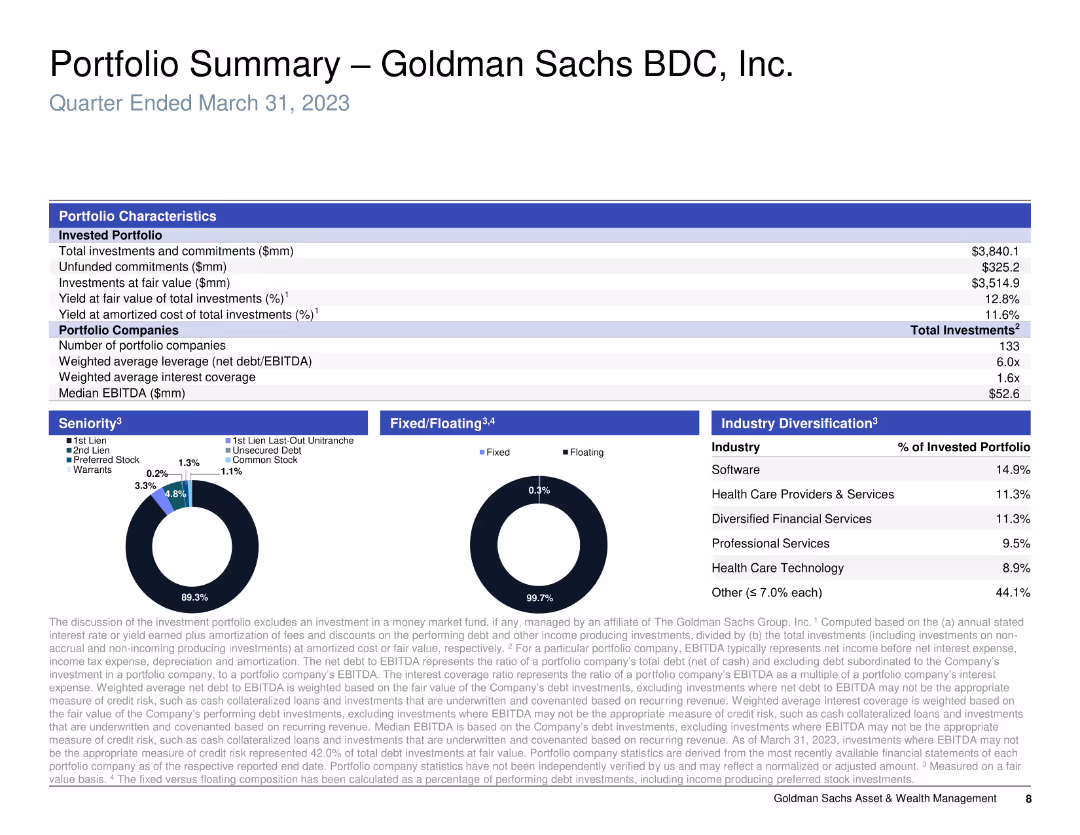
Various charts and tables summarizing portfolio characteristics, investments, and diversification.
Financial Performance
Financial Services
Summarizes key metrics and diversification of Goldman Sachs BDC, Inc.’s portfolio, including investments and sector allocation.
portfolio, summary, Goldman Sachs, BDC
Multiple Chart
Goldman Sachs
Saved
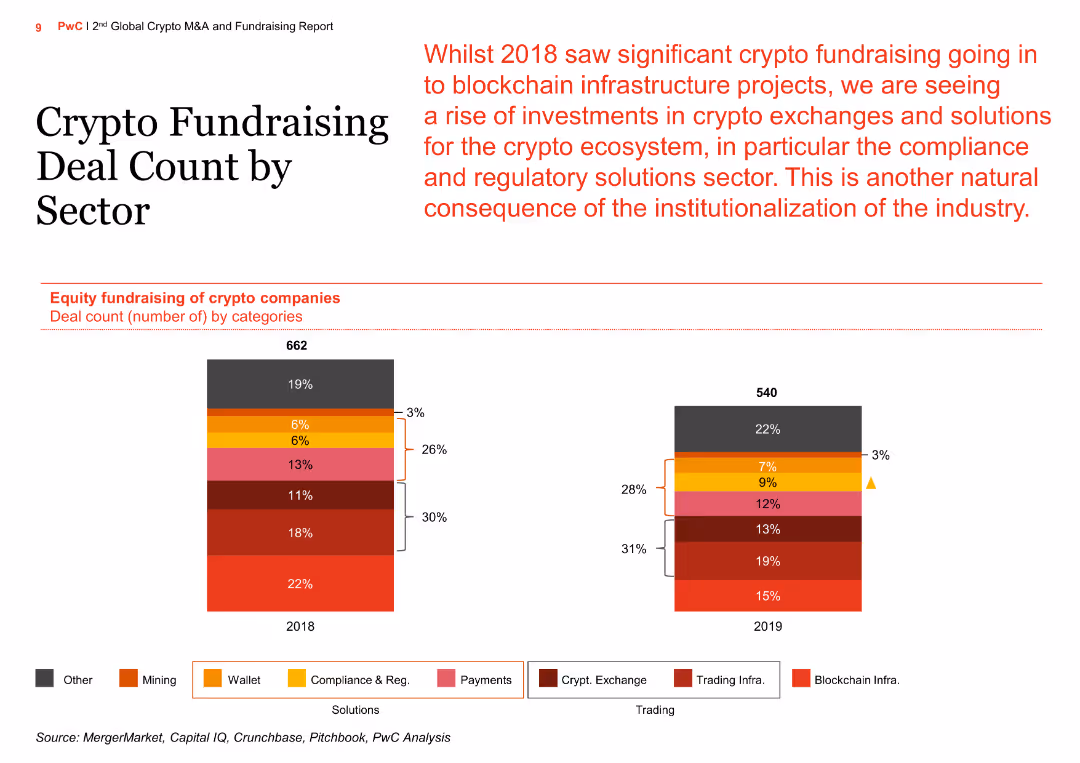
The slide features a column chart depicting the equity fundraising deal count of crypto companies across various categories for the years 2018 and 2019. It includes a stacked column chart with different colored segments representing different categories such as blockchain infrastructure, trading infra, crypto exchange, etc.
Market Analysis and Trends
Financial Services
The slide analyzes the changes in equity fundraising for crypto companies by sector from 2018 to 2019, highlighting the rise in investments in crypto exchanges and compliance and regulatory solutions, reflecting the institutionalization of the industry.
Crypto, Fundraising, Sector, Compliance, Regulatory, Exchange, Blockchain, Infrastructure, Trading, Analysis
Multiple Chart
PwC/Strategy&
Saved
The slide features bar graphs depicting e-commerce, online travel, transport & food, and online media sectors. Use of blue shades, minimalistic design.
Market Analysis and Trends
Technology & Software
This slide illustrates the growth in various sectors of Singapore’s economy post-2020, highlighting a healthy surge with future projections.
Growth, Sectors, Singapore, Projections, eCommerce, Travel, Food, Media, 2025, Recovery
Multiple Chart
Bain
Saved
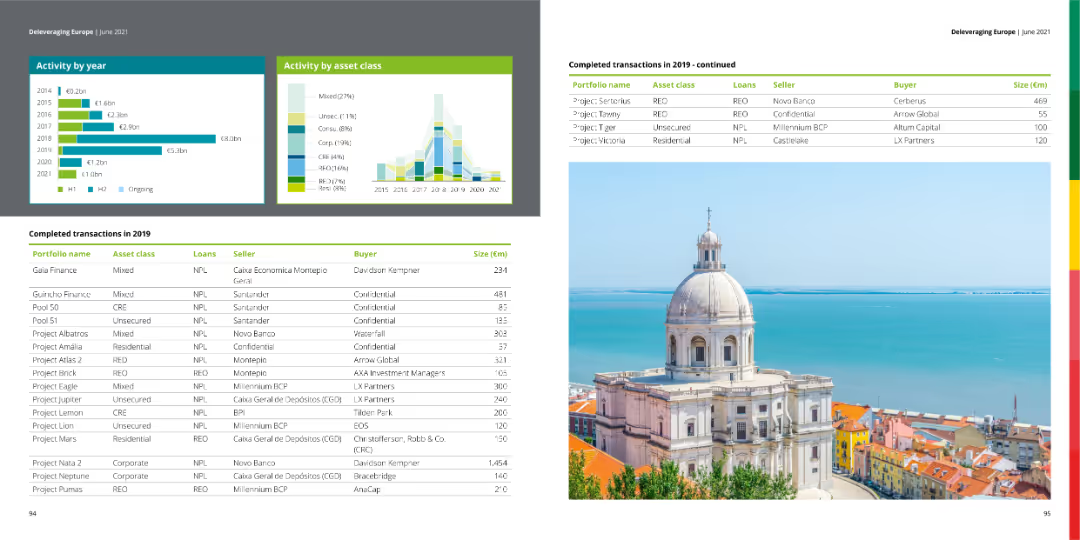
The slide contains column charts showing top sellers and buyers in 2019 and 2020. It also includes two tables of transaction data.
Financial Performance
Financial Services
This slide details completed transactions in 2020 and ongoing ones in 2021, showing top sellers and buyers with financial details.
transactions, financial services, column chart, sellers, buyers
Multiple Chart
Deloitte
Saved
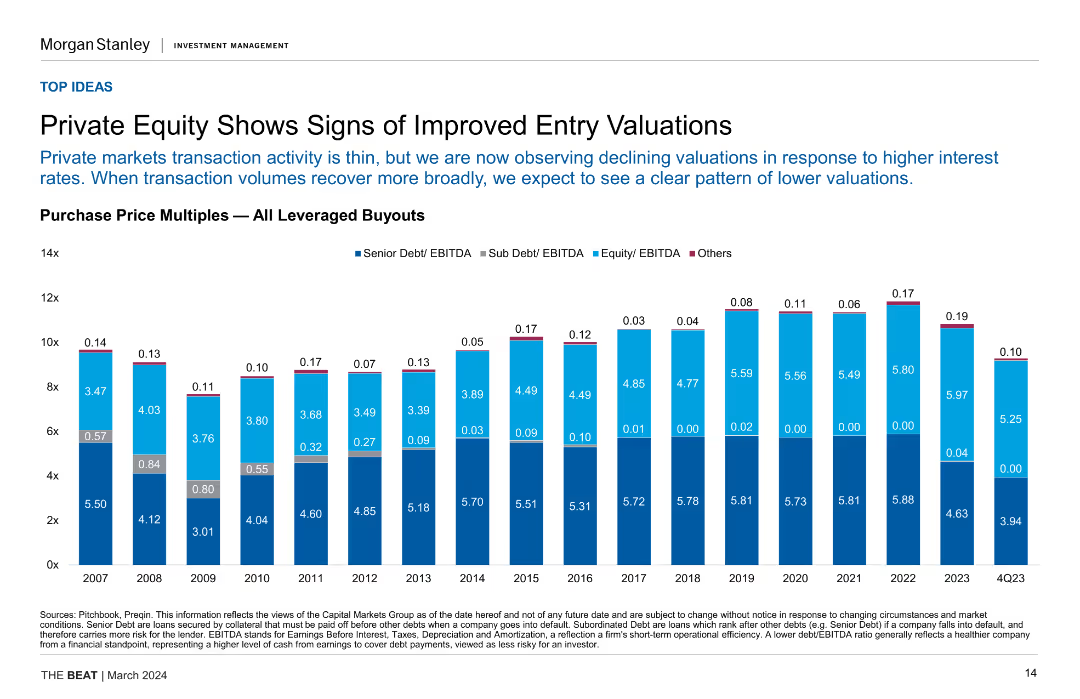
Column chart displaying purchase price multiples for leveraged buyouts over the years, highlighting trends in senior debt, sub-debt, equity, and other categories.
Financial Performance
Financial Services
The slide shows declining valuations in private equity, suggesting improved entry points for investments, and expecting a clearer pattern of lower valuations as volumes recover.
Private Equity, Valuations, Leveraged Buyouts, Debt, Equity, Investment Trends
Single Chart
Morgan Stanley
Saved
Contains bullet points summarizing operational highlights and growth strategies, accompanied by a column chart of revenue growth with recurring and non-recurring figures.
Strategic Planning
Technology & Software
Likely serves as an executive summary, detailing key strategies and financial growth for a company.
Operational, Growth, Strategy, Revenue, Recurring, Non-recurring, Highlights, Financial
Mixed Chart
Goldman Sachs
Saved
Displays comparative line charts and bar charts for value vs. growth valuations and returns across different interest rate environments.
Market Analysis and Trends
Financial Services
The slide compares value and growth stock performance in varying interest rate conditions, suggesting support for value stocks in higher rate environments.
value stocks, growth stocks, interest rates, market analysis, valuations
Multiple Chart
JP Morgan
Saved
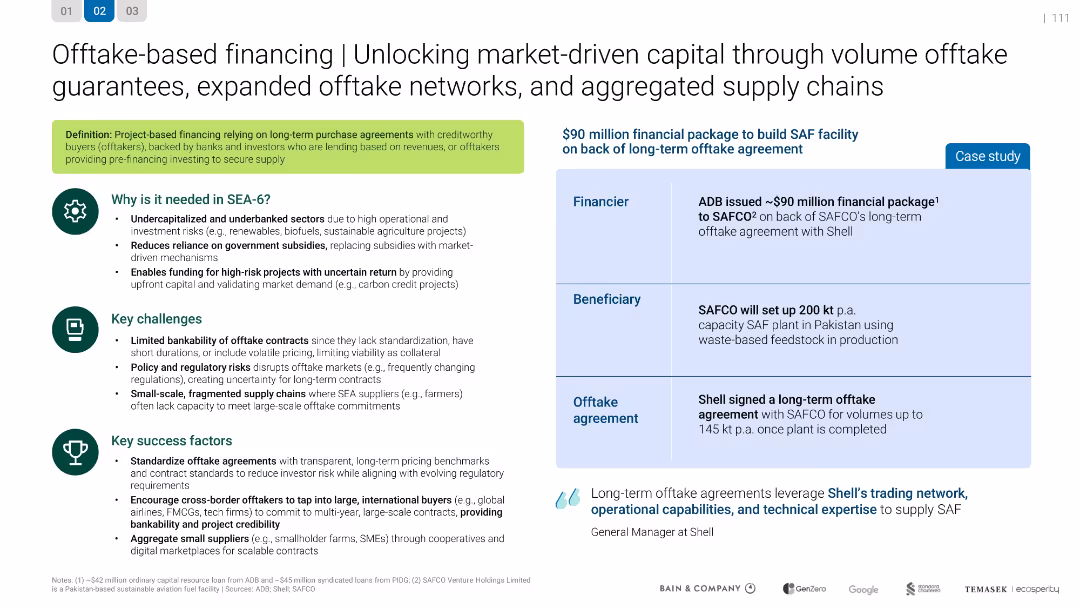
3-column layout: definition and rationale on left, case study in center, challenges/success factors on right; structured with icons and color accents.
Technology and Digital Transformation
Energy & Utilities
Explains offtake-based financing, where long-term contracts back high-risk clean energy projects. Describes SEA challenges like weak offtake structures and success factors such as standardization and supply aggregation. Features a real case study.
offtake, financing, ADB, SAFCO, Shell, energy, SEA
Table
Bain
Saved
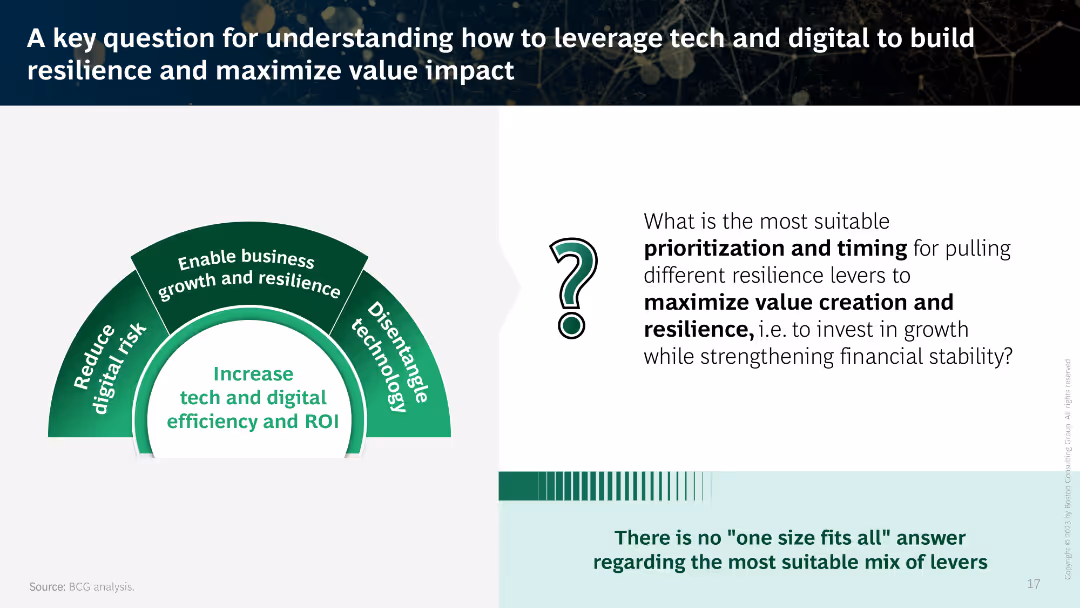
This slide features a combination of graphical elements and text. It includes a semi-circular diagram highlighting four key areas for leveraging tech and digital.
Strategic Planning
Technology & Software
The slide poses a question on prioritization and timing for resilience levers to maximize value creation and resilience while strengthening financial stability.
resilience, tech, digital, value creation, prioritization
Framework
BCG
Saved
A simple design with a blue-toned bar chart depicting deal values over recent years. Annotations provide additional context to the data shown.
Investment Analysis
Financial Services
Presents data on the deal values in the Philippines, with a specific focus on the significant increase in H1 2021, offering insights into the investment climate.
Deal value, Investment climate, Yearly comparison, Market insight
Single Chart
Bain
Saved
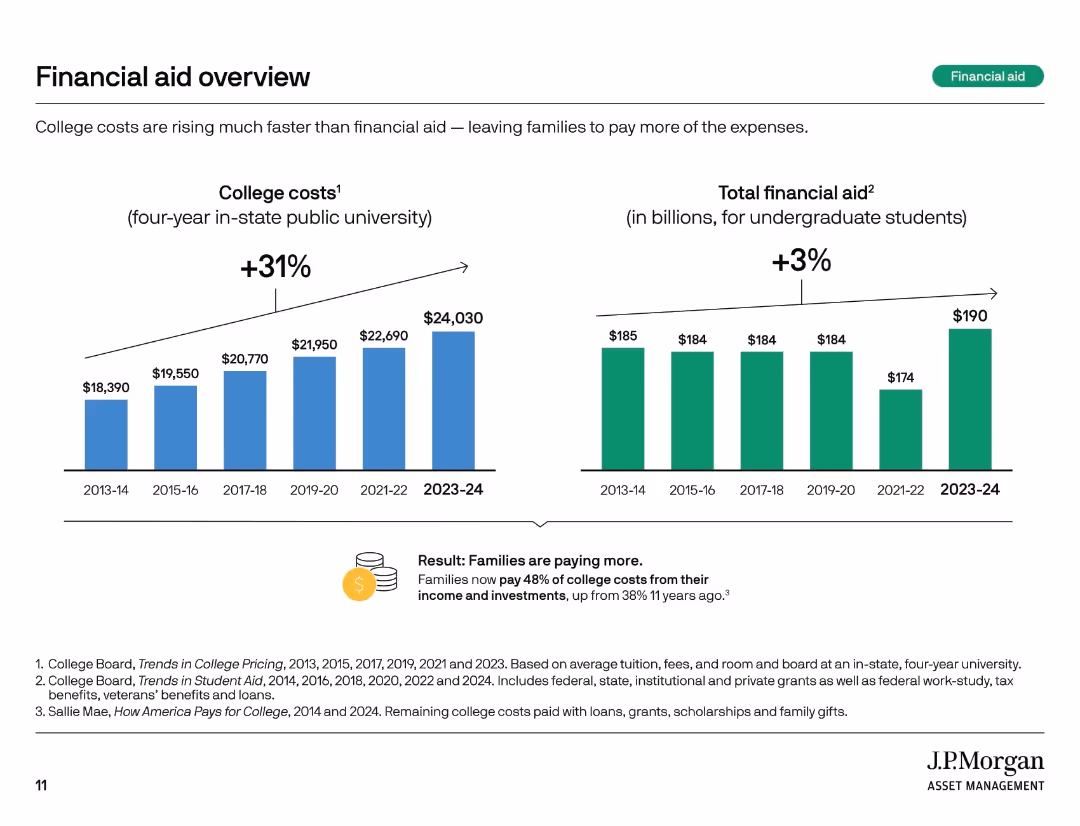
Two vertical bar charts comparing college costs and total financial aid over time. Summary box notes shifting burden to families.
Financial Performance
Education & Training
This slide highlights how college costs have risen 31% over 10 years, while financial aid increased only 3%. Families now bear a larger share of expenses, with 48% of college costs covered from income and investments compared to 38% a decade ago.
financial aid, rising costs, student burden, tuition trends, aid gap, college expenses, cost growth, funding shortfall, family responsibility
Multiple Chart
JP Morgan
Saved
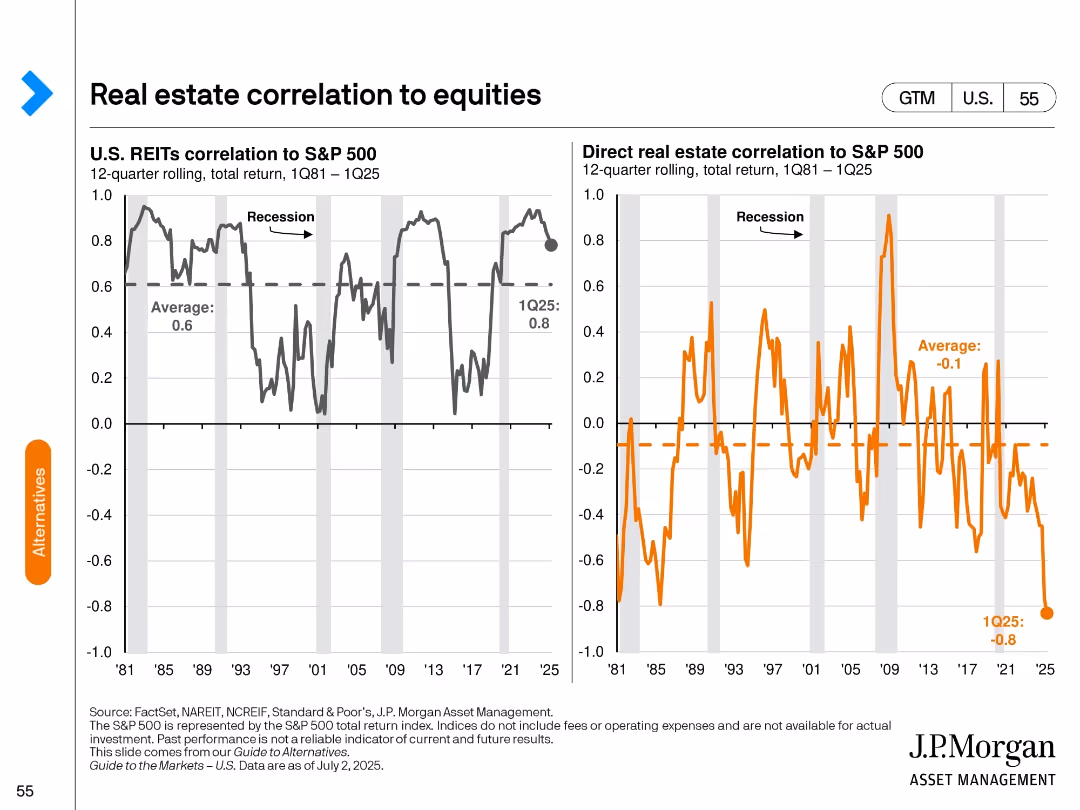
Two line charts: Left—U.S. REITs vs. S&P 500; Right—Direct real estate vs. S&P 500; showing 12-quarter rolling correlations.
Risk Assessment and Management
Real Estate & Construction
Highlights the correlation between real estate (REITs and direct) and equities over time. Emphasizes the low or negative correlation of direct real estate, with implications for diversification in portfolios.
real estate, correlation, REITs, diversification, equity market, risk management
Multiple Chart
JP Morgan
Saved
Previous
Next
If nothing, comes up, please save your slides first
Create a FREE account to continue browsing
Receive Instant Access to 1,000+ slides from companies like McKinsey, Google, and Goldman Sachs
First Name
Last Name
Email
Password
I agree to all
Terms & Privacy Policy
Thank you! Your submission has been received!
Oops! Something went wrong while submitting the form.
Have an account?
Sign in
Column Chart
Heatmap
Chevron
Org Chart
Infographic
Callouts
Timeline
List
Graphic
Picture
Process Flow
Diagram
Paragraph
Map
Table
Framework
Subtitle
Takeaway Box
Icon
Other Chart
Radar Chart
Waterfall Chart
Mekko Chart
Pie Chart
Scatter Plot
Line Chart
Bar chart
Bullet points