My Account
My Slides
Search by Category
Templates
Leave Feedback
Login
Logout
Get Started
Browse all Slides
Browse all Slides
Create a FREE Account
Instant access to 1,000+ real slides from top companies like McKinsey, BCG, Goldman Sachs, Google and many more!
First Name
Last Name
Email
Password
I agree to all
Terms & Privacy Policy
Thank you! Your submission has been received!
Oops! Something went wrong while submitting the form.
Have an account?
Sign in
Saved Slides
This slide includes a bar chart showing reasons why consumers prefer shopping in physical stores, such as checking the product, enjoying in-store shopping, and avoiding online delivery costs.
Customer and Market Segmentation
Retail & E-commerce
The slide explores why consumers in the Middle East choose to shop in physical stores, highlighting preferences like checking product quality, enjoying the shopping experience, and avoiding online issues.
shopping, in-store, consumer, Middle East, product, quality, delivery, preference
Mixed Chart
PwC/Strategy&
Saved
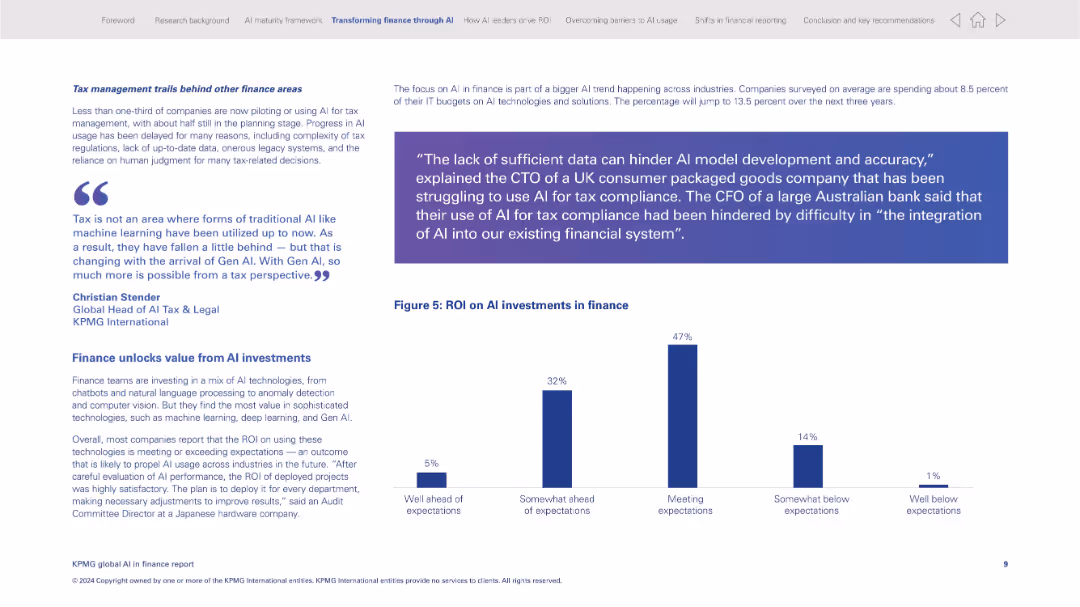
Balanced layout with left-aligned narrative text and a bar chart on ROI distribution by percentage
Investment Analysis
Financial Services
This slide discusses the ROI outcomes of AI investments in finance. It highlights the challenges in tax AI adoption and notes the average IT budget allocation to AI. A bar chart indicates most organizations are seeing satisfactory ROI, with nearly half reporting expectations met.
ROI, finance AI, investment outcomes, tax management, Gen AI, budget allocation, performance, financial technology
Mixed Chart
KPMG
Saved
The slide features a title and a composite image of professionals interacting with digital screens, indicative of a modern business environment.
Industry Overview
Professional Services
Sets the stage for a discussion on evolving sales and marketing tactics in the context of changing consumer behavior and technology.
Sales, Marketing, Business Trends, Consumer Behavior, Digital Transformation, Industry Overview, Market Evolution, Strategy Development, Business Innovation, Executive Perspective
Title
BCG
Saved
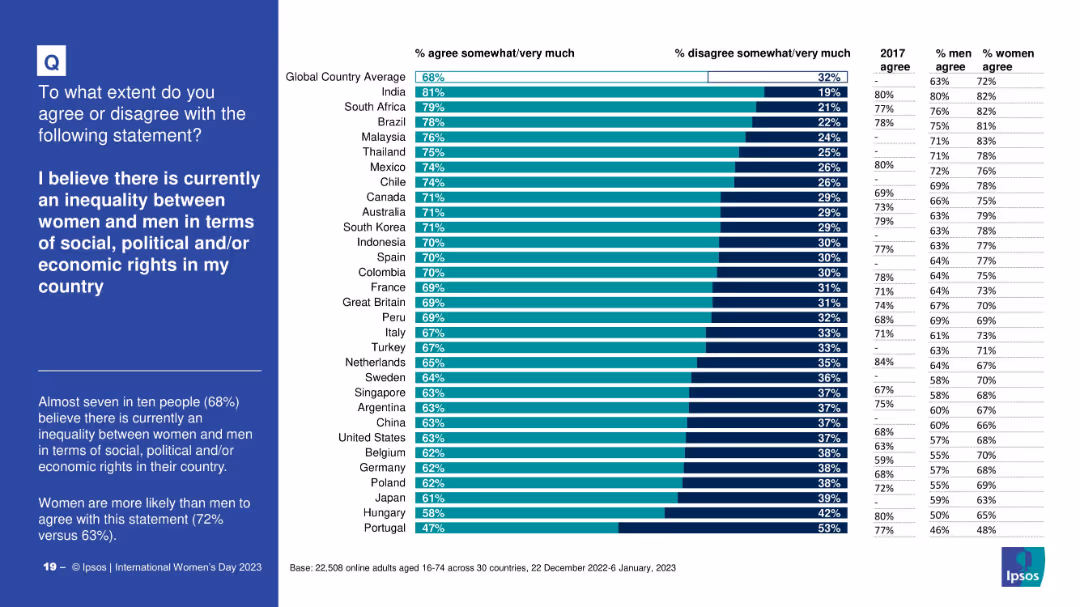
Horizontal bar chart showing country-specific agreement levels; includes 2017 data, gender-specific agreement, and global averages
Market Analysis and Trends
Professional Services
This slide visualizes public belief in current gender inequality across countries, comparing agreement/disagreement rates, gender-specific stats, and previous data from 2017. Women consistently agree more than men.
gender inequality, perception, country analysis, 2023 survey, global opinion, historical comparison
Mixed Chart
IPSOS
Saved
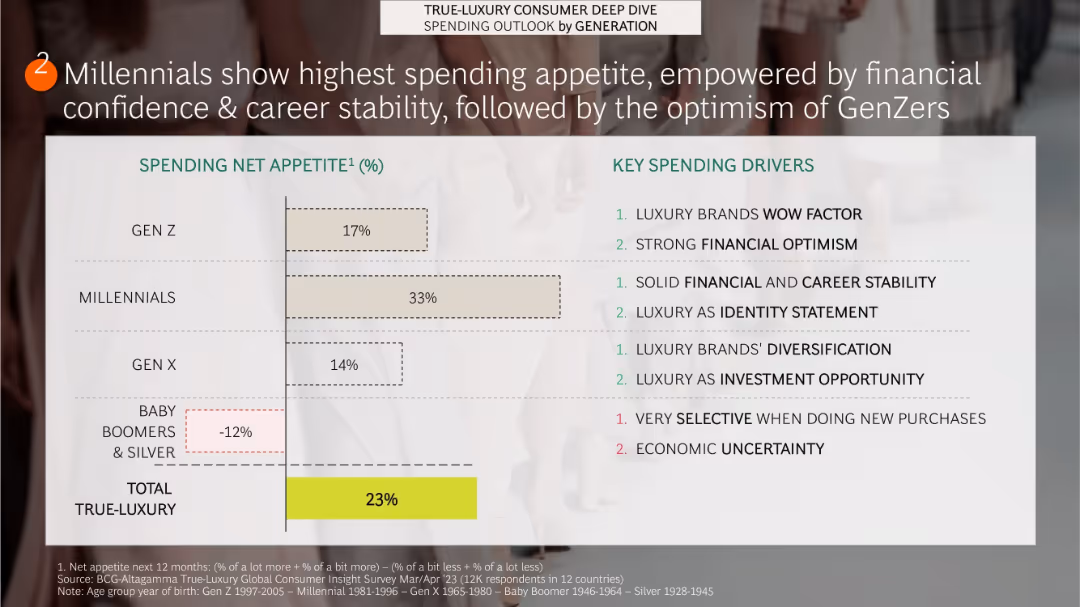
Split layout with left side bar chart showing spending appetite by generation and right side listing key spending drivers by cohort
Customer and Market Segmentation
Consumer Goods
Millennials show the highest net appetite for luxury spending (33%), attributed to financial and career stability. Gen Z (17%) follows due to optimism and luxury's wow factor. Older generations like Baby Boomers and Silvers have a negative net appetite, citing economic uncertainty.
generations, spending appetite, Millennials, Gen Z, Baby Boomers, financial optimism, identity, luxury market
Single Chart
BCG
Saved
Features a vertical column chart depicting liquidity coverage ratio and a text box outlining liquidity management strategies and goals.
Risk Assessment and Management
Financial Services
Discusses UBS Group AG's liquidity coverage ratio, efficiency, safety, and strategies to meet stringent Swiss liquidity requirements.
UBS, liquidity, coverage ratio, efficiency, safety, funding, management, requirements, Swiss
Mixed Chart
UBS
Saved
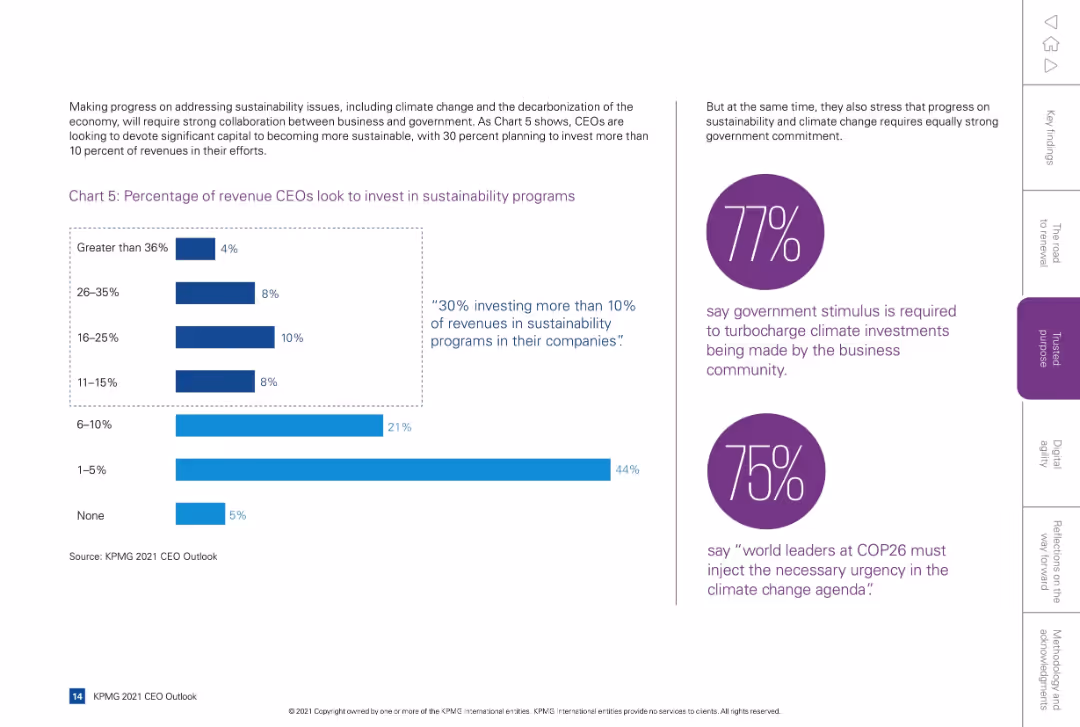
Split layout: left side with bar chart and supporting text, right side has two purple circular callouts with statistics and quotes.
Regulatory and Compliance
Environmental Services & Sustainability
Shows CEO intentions to invest revenue in sustainability programs, with 30% allocating more than 10%. Also emphasizes business-government collaboration on climate issues, highlighting expectations for government stimulus and leadership.
sustainability, revenue allocation, ESG, investment, climate, government
Mixed Chart
KPMG
Saved
This slide has column charts with financial data in blue and black colors on a white background.
Financial Performance
Financial Services
The slide presents a comprehensive view of the Institutional Clients Group financial results, featuring detailed quantitative metrics such as net interest income, total revenues, credit costs, and net income, juxtaposed with year-on-year and quarter-on-quarter comparisons. It is likely used to evaluate financial performance and make strategic decisions.
financial, clients, income, revenue, costs, credit, EBT, net income, ROcTE, efficiency
Mixed Chart
Citigroup
Saved
A column chart illustrates 2022 revenue with potential increases and decreases from various business factors. Text boxes provide context for each bar, explaining the contributions to total revenue and expectations. The color scheme distinguishes between actual and hypothetical values.
Investment Analysis
Financial Services
This forward-looking slide assesses how recent investments could impact revenue and EBITDA, providing a projection beyond the current fiscal year. It's valuable for strategic planning and forecasting future financial outcomes.
financial forecasting, investment impact, strategic planning
Single Chart
Goldman Sachs
Saved
The slide is split into two sections. The left side contains images depicting growth estimates for various vessel types from 2023 to 2024. The right side lists key market catalysts for the drybulk sector.
Market Analysis and Trends
Transportation & Logistics
This slide analyzes the growth projections for different vessel types in the drybulk sector and identifies major market catalysts affecting this industry.
shipping, drybulk, growth estimates, market catalysts, transportation
Header Horizontal
Deutsche Bank
Saved
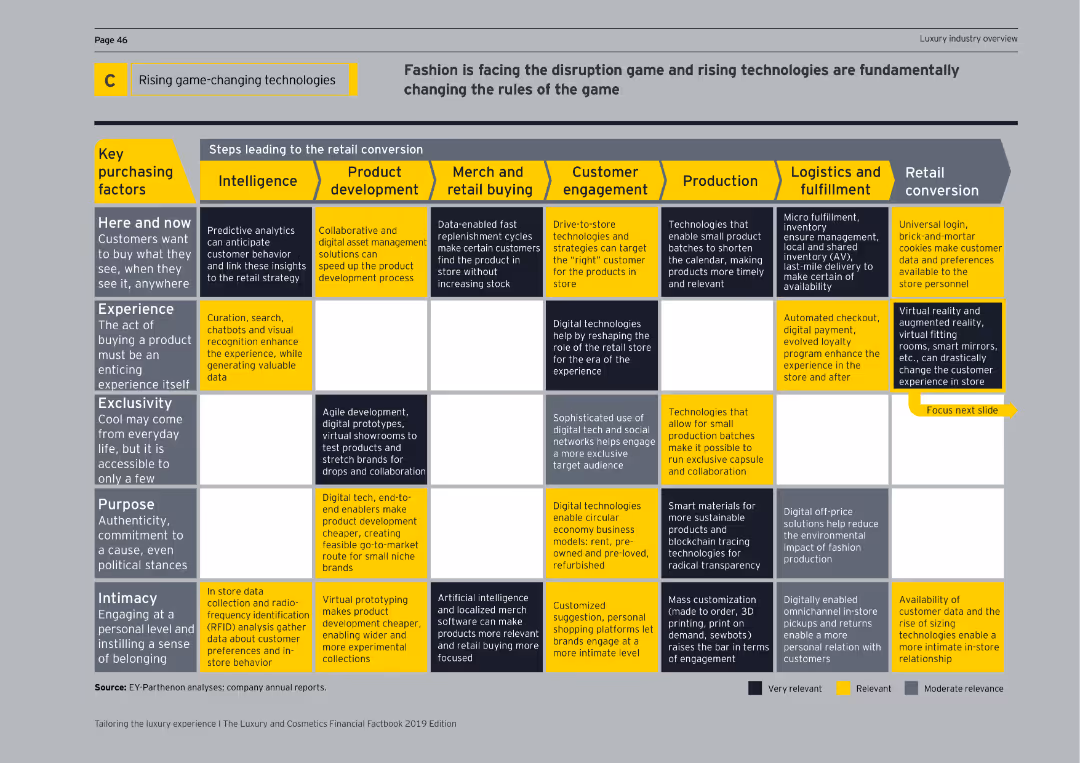
Matrix chart showing steps leading to retail conversion with key purchasing factors and corresponding technologies across different stages.
Technology and Digital Transformation
Technology & Software
Details how emerging technologies are revolutionizing retail by enhancing various aspects from intelligence to retail conversion strategies.
game-changing technologies, retail conversion, key purchasing factors, intelligence, customer engagement, production, logistics, matrix chart
Table
EY
Saved
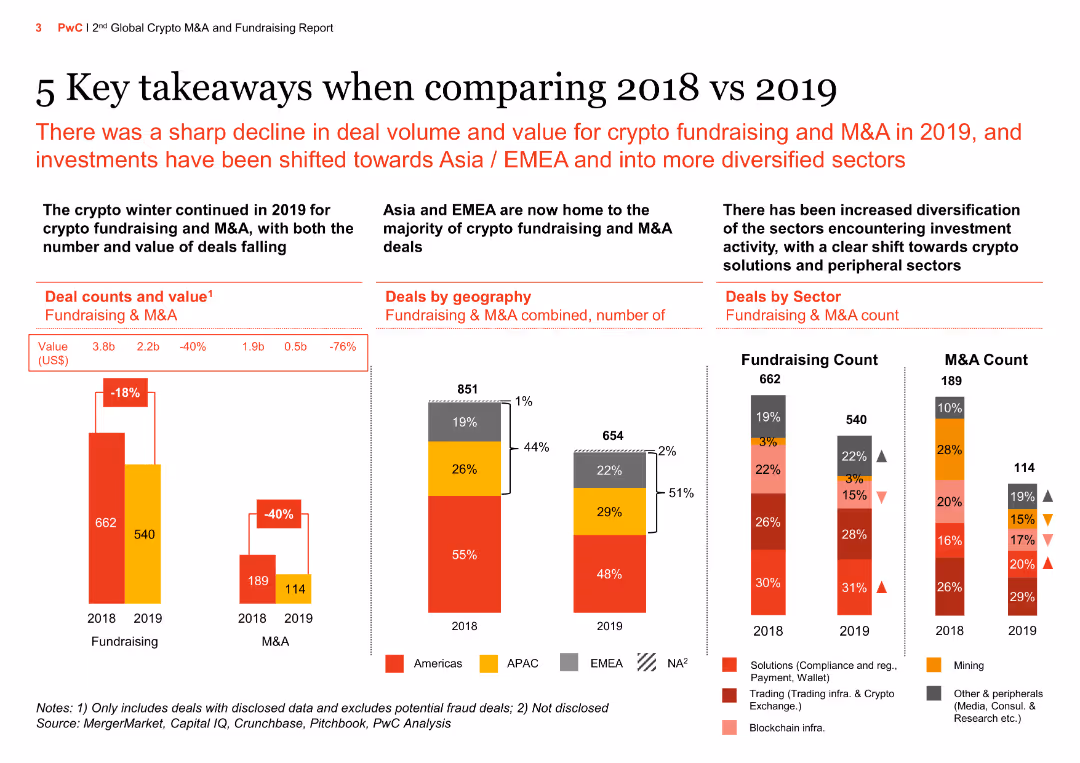
The slide has multiple column charts comparing deal counts and values, deals by geography, and deals by sector between 2018 and 2019. The data show a sharp decline in deal volume and value for crypto fundraising and M&A.
Market Analysis and Trends
Financial Services
This slide presents key takeaways on the decline in crypto fundraising and M&A deal volumes and values from 2018 to 2019, highlighting geographic and sectoral shifts in investment activities.
Crypto fundraising, M&A, deal volume, deal value, geography, sector, financial services, market trends, investment, 2018 vs 2019
Multiple Chart
PwC/Strategy&
Saved
Combines text with bar charts to highlight the differences in how highly resilient boards handle talent and culture-related issues.
Human Resources and Talent Management
Professional Services
The slide discusses the importance of prioritizing talent discussions, using data to drive insights, and overseeing DE&I initiatives, comparing highly resilient boards to less resilient ones.
talent management, DE&I, resilient boards, professional services, data insights, culture, bar charts
Multiple Chart
EY
Saved
The slide presents a comparative table of various players in the market research industry, showing turnover and focus areas.
Competitive Landscape
Professional Services
The slide compares Ipsos with other market research companies, highlighting turnover figures and areas of specialization.
Comparative, Market Research, Turnover, Specialization, Ipsos
Multiple Chart
IPSOS
Saved
Flowcharts and column charts showing technology improvement.
Technology and Digital Transformation
Financial Services
Details improvements in electronic offerings with specific performance metrics.
Technology, Enhancements, Strategy, Performance Metrics, Financial Services
Mixed Chart
Barclays
Saved
Two sets of bar charts dominate this slide, showing the current and previous year local interest rates for developed and emerging markets. The color-coded bars allow for easy year-over-year comparison.
Market Analysis and Trends
Financial Services
The slide analyzes sovereign currency yields, comparing the interest rates of different currencies from developed and emerging markets against previous year's rates, useful for evaluating investment risks and opportunities.
currency yields, interest rates, developed markets, emerging markets, financial analysis, investment, year-over-year comparison
Multiple Chart
Morgan Stanley
Saved
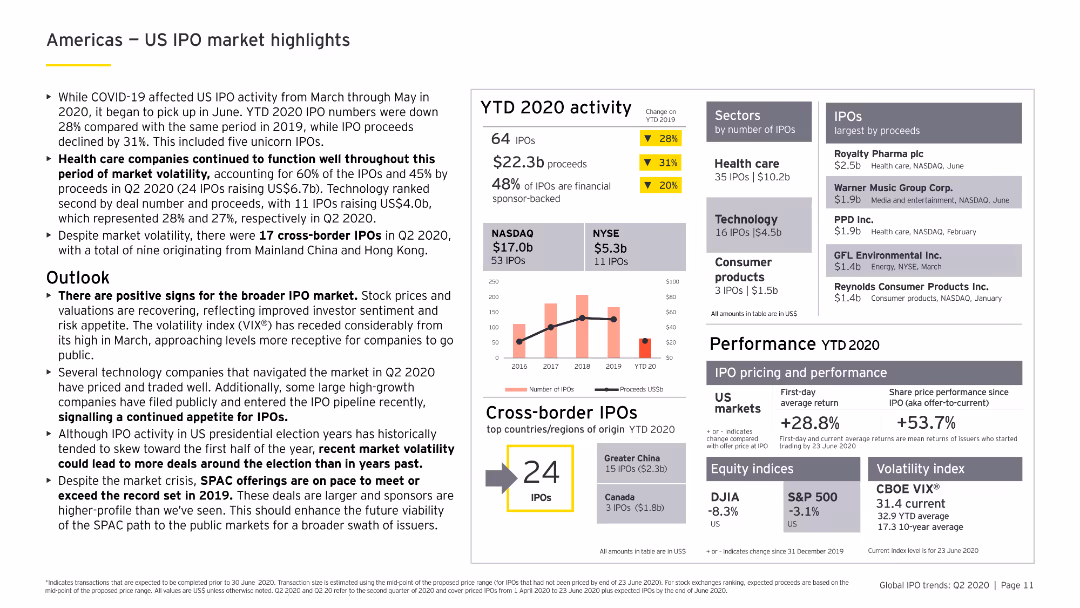
Includes column charts and bar charts showing YTD 2020 IPO activity in the US, sector analysis, and cross-border IPO data, with a focus on health care and technology.
Market Analysis and Trends
Financial Services
Reviews the US IPO market's performance in 2020, focusing on trends and insights from the health care and technology sectors, along with cross-border IPO activities.
US IPO, health care, technology, cross-border, YTD 2020
Mixed Chart
EY
Saved
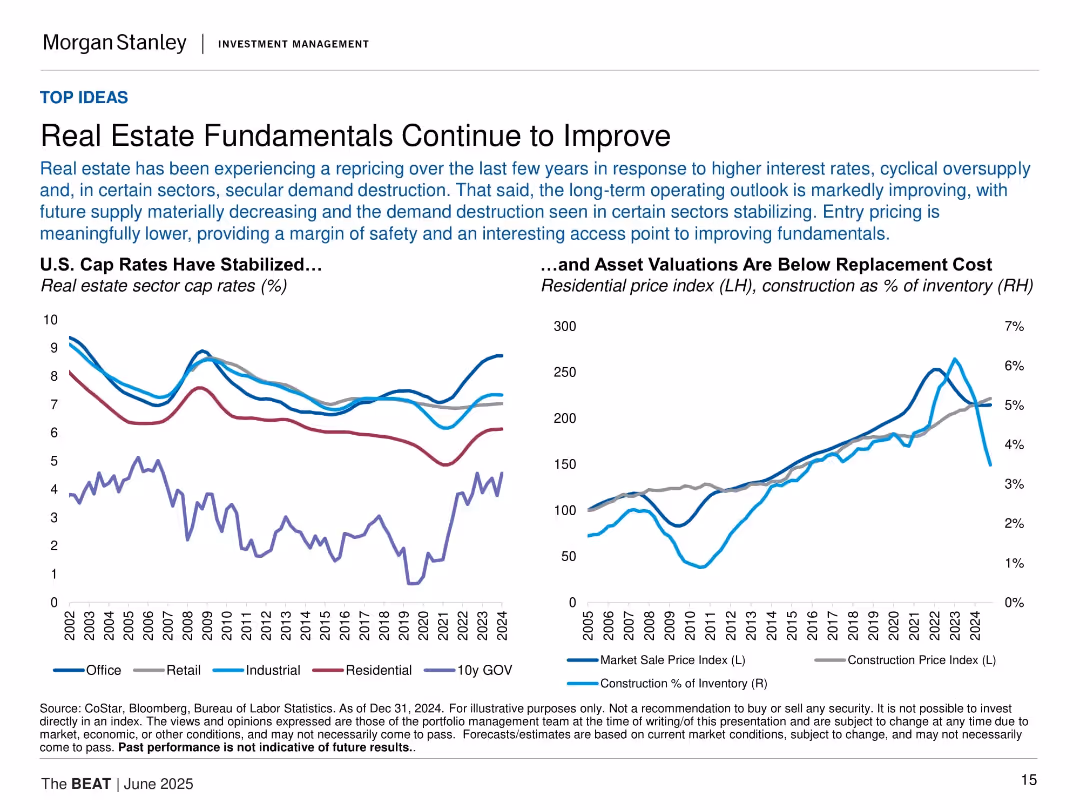
Two line charts: one for cap rates by sector, another for price and construction metrics; stylized and dual-axis.
Market Analysis and Trends
Real Estate & Construction
This slide describes improving real estate fundamentals due to pricing adjustments and shrinking supply. It includes charts on sector cap rates and residential asset valuations compared to replacement cost metrics.
real estate, cap rates, pricing, supply, valuation, fundamentals, market sale index, construction, investment
Multiple Chart
Morgan Stanley
Saved
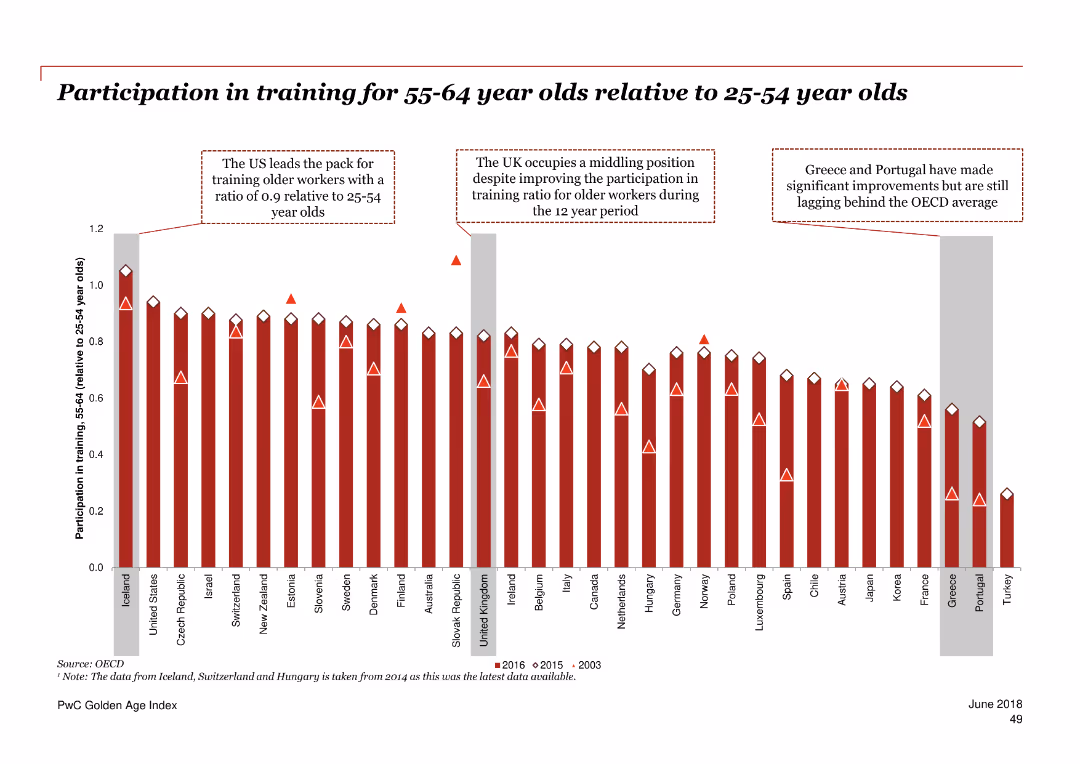
Column chart showing the ratio of participation in training for 55-64 year olds relative to 25-54 year olds across various countries.
Human Resources and Talent Management
Professional Services
The slide compares the training participation rates of older and younger adults in different countries over 2003, 2015, and 2016.
training participation, age comparison, education, OECD, trend
Single Chart
PwC/Strategy&
Saved
Text-heavy slide discussing refugee documentation in Poland.
Regulatory and Compliance
Government & Public Sector
Explores documentation status of Ukrainian refugees in Poland and its implications.
refugees, documentation, Poland, compliance
Mixed Chart
Deloitte
Saved
The slide includes a line graph of relative returns of investment strategies and a bar chart of strategy performance across recessions.
Market Analysis and Trends
Financial Services
Analyzes the performance of mean reversion strategies in the financial market and their relative performance post-COVID compared to passive strategies.
mean reversion, COVID cyclicals, investment strategies, market analysis, financial performance
Multiple Chart
Citigroup
Saved
The slide displays three column charts for manufacturing performance, new orders, and employment across Brazil, Colombia, Mexico, Saudi Arabia, South Africa, and Turkey. Commentary on the right.
Market Analysis and Trends
Financial Services
The slide shows robust growth in Saudi Arabia, improving factory activity in Brazil, and a sharp production fall in Turkey.
emerging markets, Brazil, Colombia, Mexico, Saudi Arabia, South Africa, Turkey, manufacturing, new orders, employment
Multiple Chart
Accenture
Saved
A line chart displaying trends in GDP per capita from 2011 to 2016 for several US metro areas, each represented by a different colored line, with highlighted points for areas like San Francisco and Washington DC.
Financial Performance
Transportation & Logistics
Analyzes economic growth in U.S. metropolitan areas through GDP per capita over time, highlighting regions with significant changes. Useful for economic planning and assessment.
GDP, economic growth, metro areas, US, trends, financial analysis
Single Chart
BCG
Saved
The slide features a column chart comparing reasons for holding value-referenced crypto assets (VRCAs) between 2022 and 2023, with horizontal bars for each reason.
Market Analysis and Trends
Financial Services
The slide presents data on why individuals hold VRCAs, highlighting the stability, ease of payment, portfolio diversification, and investment opportunities as key reasons.
Crypto assets, VRCAs, reasons, 2023, 2022, investment, portfolio, stability, payment ease, diversification
Mixed Chart
IPSOS
Saved
The slide features a large, bold title in purple asking a transformative question about learning in an organization. It includes a stylized figure interacting with a blank blackboard, suggesting teaching or presenting. The background is a minimalist white room, focusing attention on the title and graphic.
Industry Overview
Education & Training
This slide introduces the concept of transformation in organizational learning, prompting viewers to consider the readiness for change. It likely serves as a section header or opening to a discussion about innovative learning strategies in corporate settings.
transformation, learning, organization, education, change, innovation, readiness, corporate training, engagement
Title
Accenture
Saved
Previous
Next
If nothing, comes up, please save your slides first
Create a FREE account to continue browsing
Receive Instant Access to 1,000+ slides from companies like McKinsey, Google, and Goldman Sachs
First Name
Last Name
Email
Password
I agree to all
Terms & Privacy Policy
Thank you! Your submission has been received!
Oops! Something went wrong while submitting the form.
Have an account?
Sign in
Column Chart
Heatmap
Chevron
Org Chart
Infographic
Callouts
Timeline
List
Graphic
Picture
Process Flow
Diagram
Paragraph
Map
Table
Framework
Subtitle
Takeaway Box
Icon
Other Chart
Radar Chart
Waterfall Chart
Mekko Chart
Pie Chart
Scatter Plot
Line Chart
Bar chart
Bullet points