My Account
My Slides
Search by Category
Templates
Leave Feedback
Login
Logout
Get Started
Browse all Slides
Browse all Slides
Create a FREE Account
Instant access to 1,000+ real slides from top companies like McKinsey, BCG, Goldman Sachs, Google and many more!
First Name
Last Name
Email
Password
I agree to all
Terms & Privacy Policy
Thank you! Your submission has been received!
Oops! Something went wrong while submitting the form.
Have an account?
Sign in
Saved Slides
Includes multiple column charts tracking interest, loans, and deposits over time.
Financial Performance
Financial Services
Tracks net interest income and average loans and deposits across various banking sectors over sequential quarters.
banking, interest, loans, deposits, financial performance
Multiple Chart
Citigroup
Saved
Two-column text-heavy layout with Circular diagram split into four quadrants illustrating skill distribution within GBS roles.
Organizational Structure and Change
Professional Services
Discusses key skills for GBS effectiveness and strategic value, highlighting areas like leadership and action orientation.
GBS, skills, strategy, leadership, action-oriented
Diagram
Deloitte
Saved
The slide presents two contrasting graphs: a line chart showing household net worth to income ratio and an area chart depicting savings buffer over time. The juxtaposition highlights shifts in economic stability.
Investment Analysis
Financial Services
This slide gives an overview of the household sector's financial health, crucial for understanding consumer behavior and potential investment risks. The net worth and savings data are pivotal for financial planning and advising within the financial services industry.
Household, Net Worth, Savings, Finance
Multiple Chart
Morgan Stanley
Saved
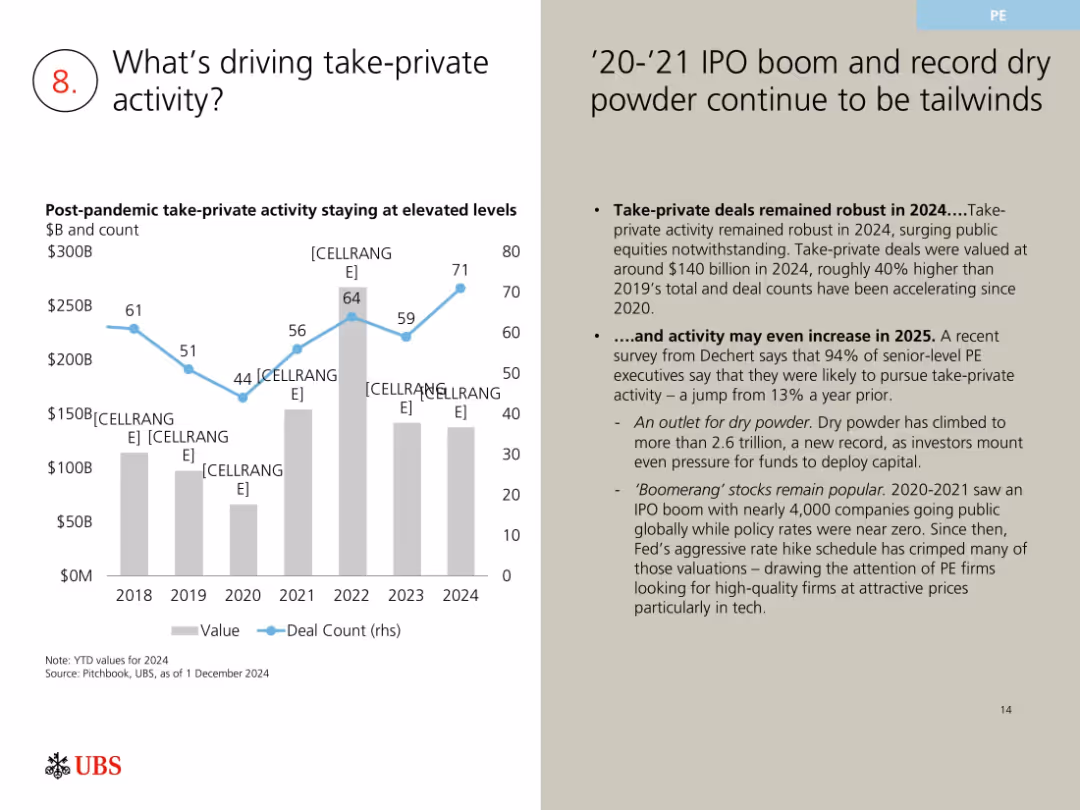
Left-aligned chart with blue line and gray bars; right-hand side has bulleted analysis text on a beige background.
Market Analysis and Trends
Financial Services
The slide examines why take-private deals remain strong post-pandemic. Key drivers include ample dry powder, tech valuations, and interest from PE firms. The 2020-2024 chart shows increasing deal counts and value, signaling robust ongoing interest and possibly more in 2025.
take-private, PE, dry powder, IPO boom, 2024 deals, valuations, M&A
Mixed Chart
UBS
Saved
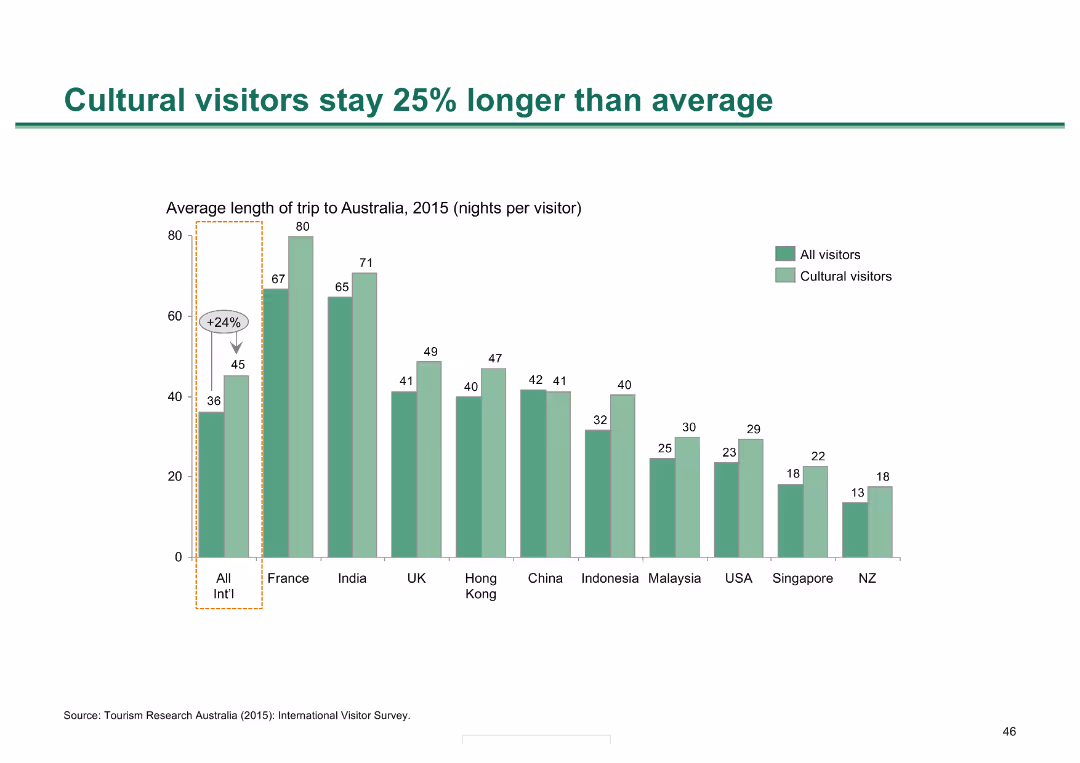
A column chart showing the average length of stay for cultural visitors compared to all visitors, with data broken down by country of origin.
Market Analysis and Trends
Hospitality & Tourism
Demonstrates that cultural visitors tend to stay longer in Australia compared to the average visitor, with specific country breakdowns highlighting variations.
cultural visitors, length of stay, Melbourne, tourism, visitor analysis
Single Chart
BCG
Saved
Contains pie charts comparing Level 3 assets and liabilities, accompanied by column charts that trace movements in balances over a specific period. The visual elements are arranged to clearly distinguish assets and liabilities with different colors.
Risk Assessment and Management
Financial Services
Explains the concept of Level 3 assets and liabilities, which represent significant valuation uncertainty, highlighting their movement and impact on financial risk management.
financial, assets, liabilities, risk, valuation
Multiple Chart
Deutsche Bank
Saved
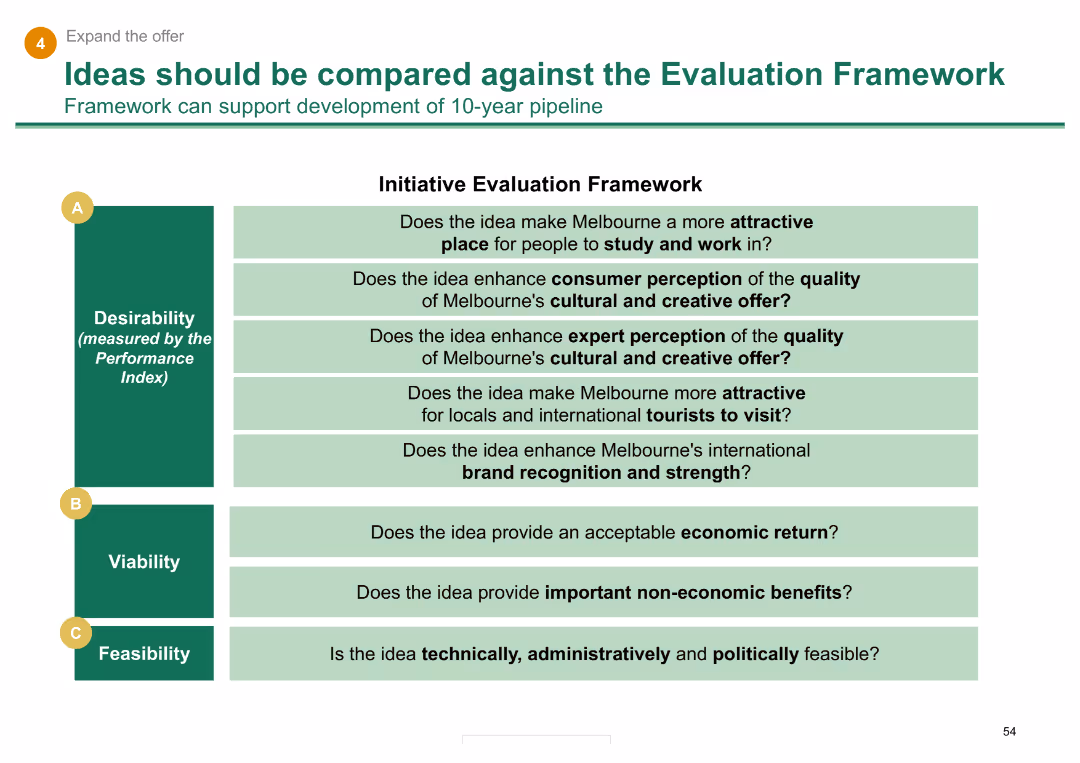
A table listing criteria for evaluating ideas based on desirability, viability, and feasibility, with specific questions under each category.
Strategic Planning
Professional Services
Provides a framework for evaluating initiatives to improve Melbourne's attractiveness, considering aspects like cultural perception, economic return, and technical feasibility.
evaluation framework, strategic planning, Melbourne, criteria, initiatives
Framework
BCG
Saved
The slide includes multiple bar graphs broken down by retail categories (food & beverage, personal care, apparel, home appliances) showing year-over-year sales changes for China. Each graph is color-coded and labeled with monthly data from February to July, providing a detailed look at specific segments within the retail market. The layout allows for easy comparison across categories, highlighting trends and shifts in consumer purchasing behavior during the pandemic.
Market Analysis and Trends
Retail & E-commerce
This detailed slide analyzes China's retail sales by category, offering insights into consumer preferences and shifts in spending during COVID-19. It is beneficial for market analysts and retail managers to identify which categories are experiencing growth or decline, aiding in targeted marketing and inventory management. The breakdown by month and category enables precise strategic planning and forecasting, essential for optimizing operations and maximizing sales in a volatile market environment.
retail sales, market analysis, COVID-19, China, consumer behavior, strategic planning, category analysis
Table
BCG
Saved
Includes column charts showing the adoption rates of different air conditioning technologies, alongside a column chart projecting future energy demands for cooling in Southeast Asia.
Market Analysis and Trends
Energy & Utilities
Discusses the potential for significant carbon abatement in Southeast Asia through the adoption of more efficient cooling technologies in residential AC systems, detailing the current low penetration rates and the high potential for improvement.
cooling, energy efficiency, SEA, carbon abatement
Multiple Chart
Bain
Saved
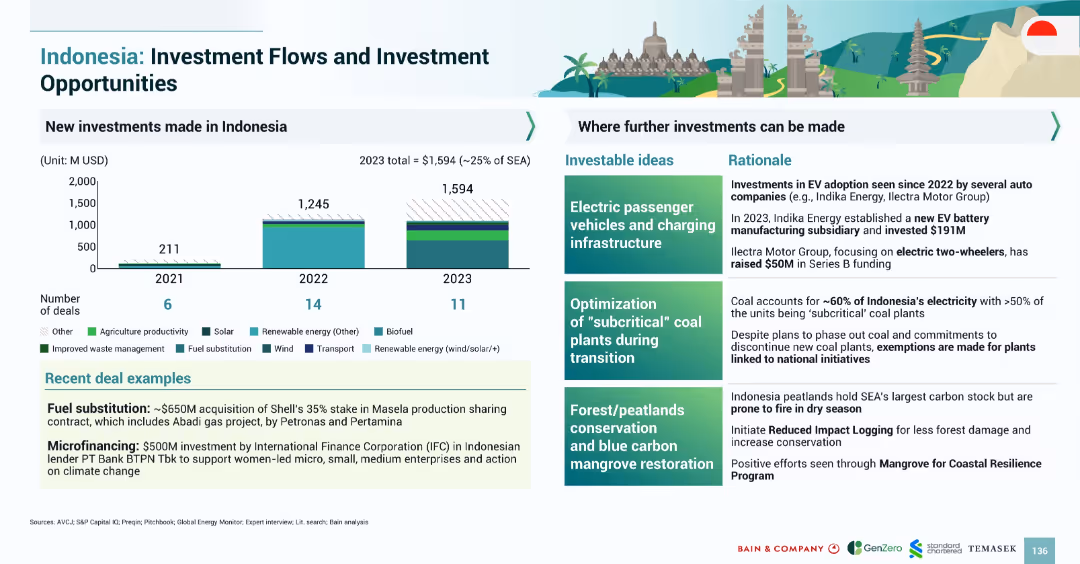
Bar chart showing investment volumes by year and type, with right-aligned boxes listing investable ideas and deal rationale
Investment Analysis
Financial Services
Highlights investment trends in Indonesia’s green sectors and identifies growth areas like EV infrastructure, coal transition, and mangrove restoration, backed by recent deal examples
Indonesia, EV, investment, fuel substitution, climate finance, mangroves, coal phaseout, renewables
Mixed Chart
Bain
Saved
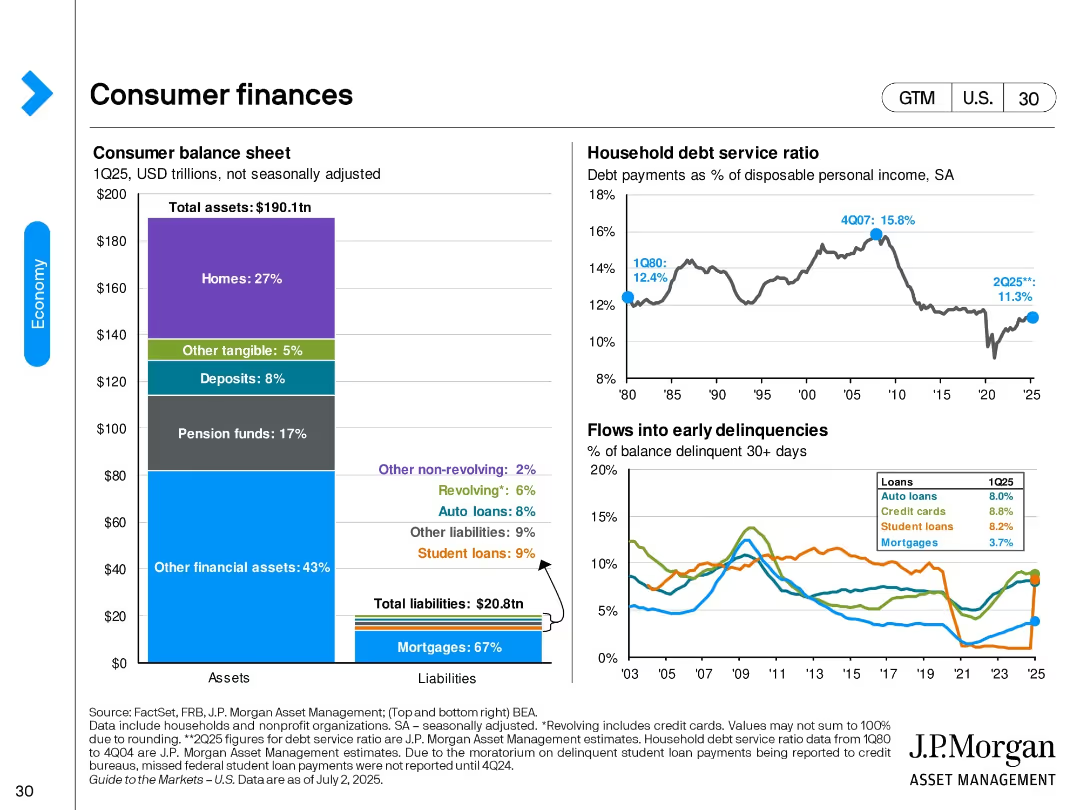
Three-panel design: asset/liability bar chart, household debt service line graph, and delinquency line graph segmented by loan type.
Performance Metrics and KPIs
Financial Services
This slide reviews the U.S. consumer balance sheet for 1Q25, debt service ratio trends, and delinquency rates by loan type. It shows a stable financial position with manageable debt levels and an increase in auto and credit card delinquencies.
consumer debt, household finance, delinquencies, mortgages, loans, balance sheet, debt ratio, financial health
Multiple Chart
JP Morgan
Saved
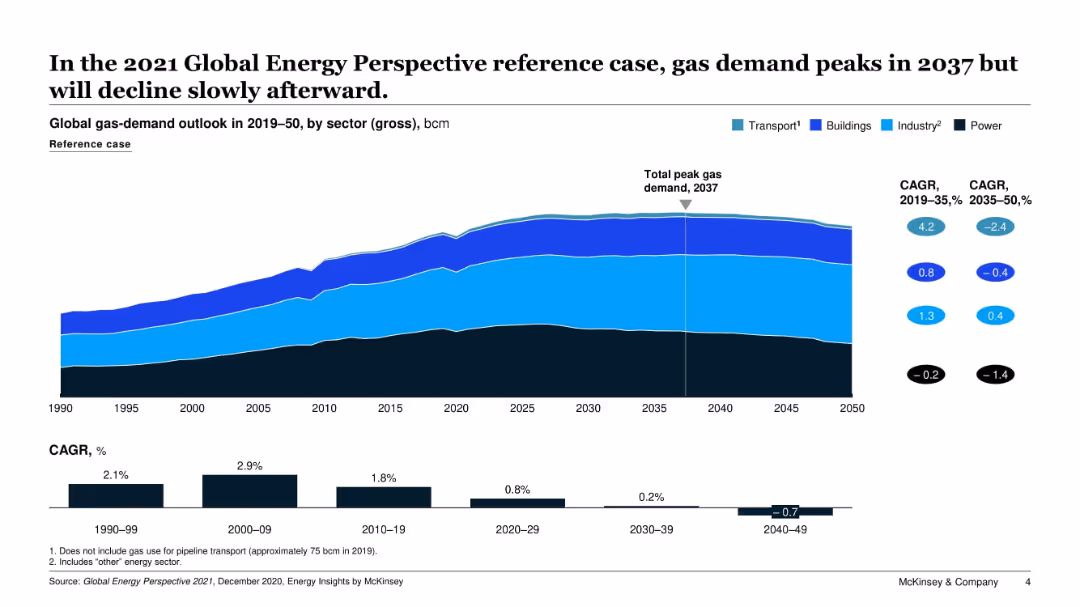
Area chart showing global gas-demand outlook from 1990 to 2050, segmented by sector (Transport, Buildings, Industry, Power). Includes CAGR statistics and a peak demand marker.
Market Analysis and Trends
Energy & Utilities
This slide presents a long-term forecast of global gas demand, showing that total demand will peak in 2037 and gradually decline afterward. The graph breaks down demand by sector and highlights compound annual growth rates (CAGR) across different periods, emphasizing shifts in demand across sectors.
gas demand, forecast, CAGR, transport, industry, power, buildings, energy outlook, decline, peak
Multiple Chart
McKinsey
Saved
The slide is a mix of data visualizations including pie charts for recession concerns and views on the economy, and bar graphs for profit expectations and AI use, complemented by descriptive sections.
Operational Efficiency
Financial Services
Summarizes key economic insights from business leaders, covering topics from recession prospects to profit expectations, and the application of AI in business, providing a broad overview of the business climate.
Recession, Economy, Profit, AI, Workforce
Multiple Chart
JP Morgan
Saved
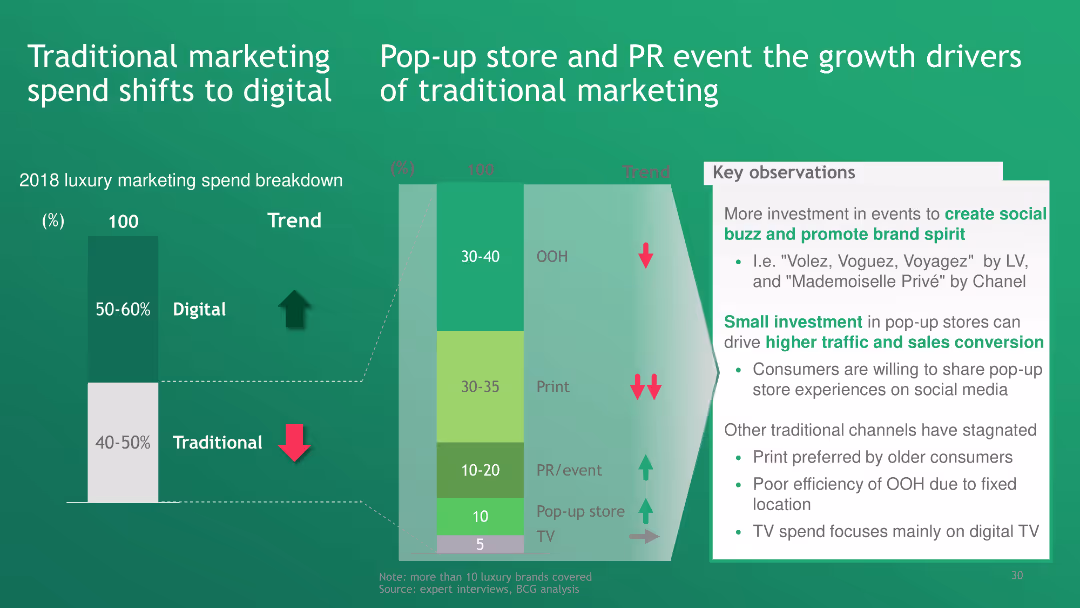
The slide features a bar chart comparing traditional and digital marketing spend in the luxury sector. It also discusses the growing impact of pop-up stores and PR events in traditional marketing strategies.
Technology and Digital Transformation
Media & Entertainment
The slide indicates a significant shift from traditional to digital marketing spend in the luxury industry, with pop-up stores and PR events being the main growth drivers for traditional marketing channels.
traditional marketing, digital marketing, pop-up stores, PR events, luxury marketing
Multiple Chart
BCG
Saved
The slide contains two line charts showing the growth of contract value and free cash flow over the years, with key data points marked from 2013 to 2023.
Financial Performance
Professional Services
It presents Gartner’s historical financial performance, highlighting the consistent growth in contract value and free cash flow over a decade, indicating robust performance.
Gartner, financial performance, contract value, free cash flow, growth, historical performance
Multiple Chart
Gartner
Saved
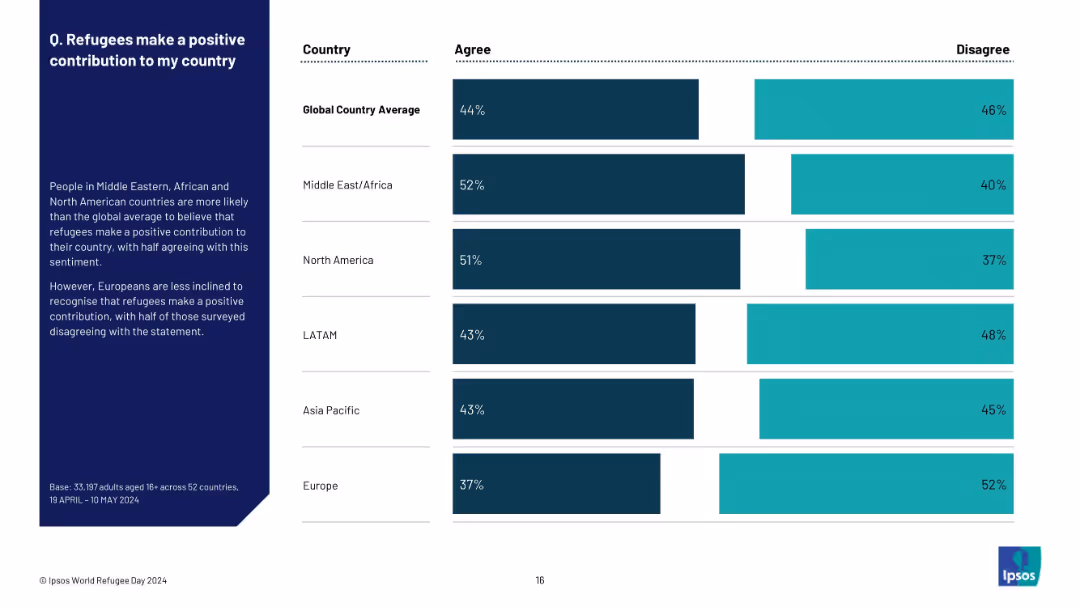
Split layout with a left-side text summary and a right-side horizontal bar chart comparing regions’ agree/disagree %
Market Analysis and Trends
Government & Public Sector
The slide explores regional attitudes toward the positive contribution of refugees. Middle East, Africa, and North America show more favorable views than the global average, while Europe shows more negative sentiment. The chart contrasts agreement levels across regions.
refugees, perception, contribution, global comparison, agreement, regional trends, Ipsos, 2024, World Refugee Day
Mixed Chart
IPSOS
Saved
The slide features a timeline of events and a map showing the Metro Manila Subway Project's phases. It includes photos and brief descriptions of key milestones.
Strategic Planning
Transportation & Logistics
Timeline of the Metro Manila Subway Project's development from initial inspections to meetings concerning construction phases.
subway, Philippines, timeline, construction, milestones
Vertical Flow
Deloitte
Saved
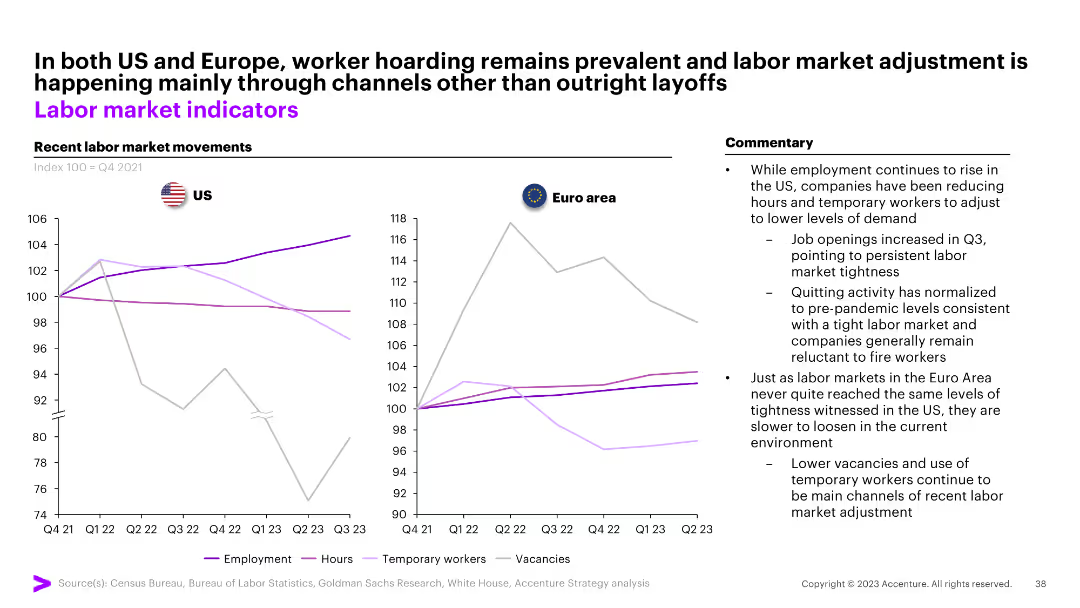
The slide has two line charts comparing labor market indicators between the US and Euro area, with commentary on the right side and labeled data sources at the bottom.
Market Analysis and Trends
Financial Services
The slide discusses recent labor market movements in the US and Euro area, highlighting worker hoarding and labor market adjustments.
labor market, US, Euro area, employment, vacancies
Multiple Chart
Accenture
Saved
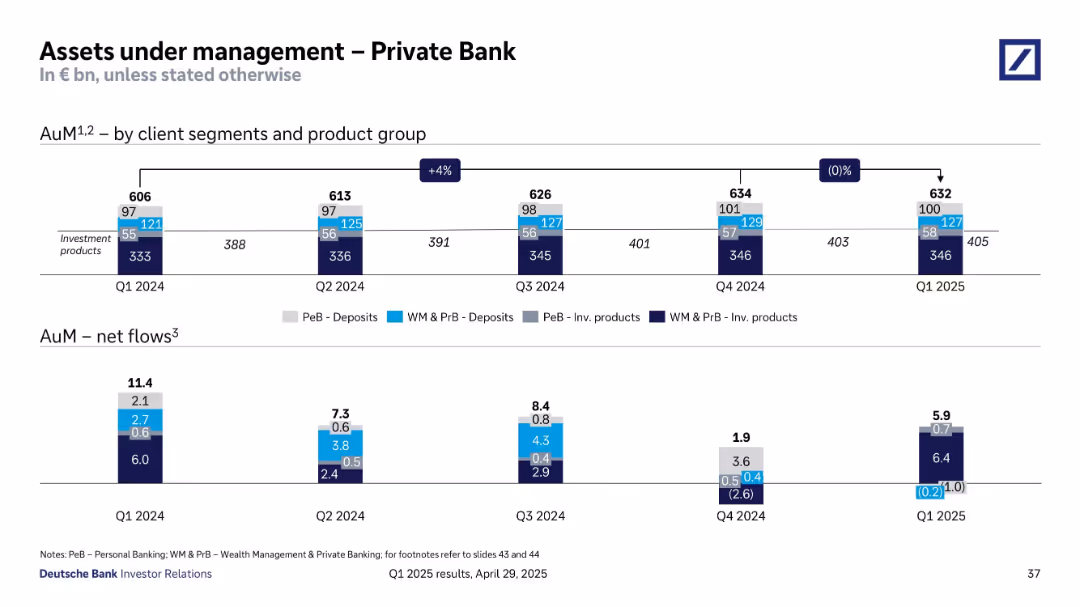
Bar graphs show quarterly AuM by segment and product type, with net flows detailed below. Color-coded by product and client type.
Performance Metrics and KPIs
Financial Services
This slide tracks assets under management (AuM) for the Private Bank from Q1 2024 to Q1 2025, segmented by product type (deposits vs investment products) and client segment. It also presents net flow trends, showing continued positive inflows despite a dip in Q4 2024, suggesting strong client engagement and growth potential.
AuM, private banking, investment products, deposits, net flows, clients
Single Chart
Deutsche Bank
Saved
The slide includes two donut charts comparing 2023 and 2022 responses on investment knowledge, with key percentages highlighted.
Market Analysis and Trends
Financial Services
It displays the percentage of Canadians who correctly answered a question about stocks vs. mutual funds, comparing 2022 to 2023.
Stocks, Mutual Funds, Knowledge, Canadians, Percentage, 2023, 2022, Chart, Financial, Trends
Multiple Chart
IPSOS
Saved
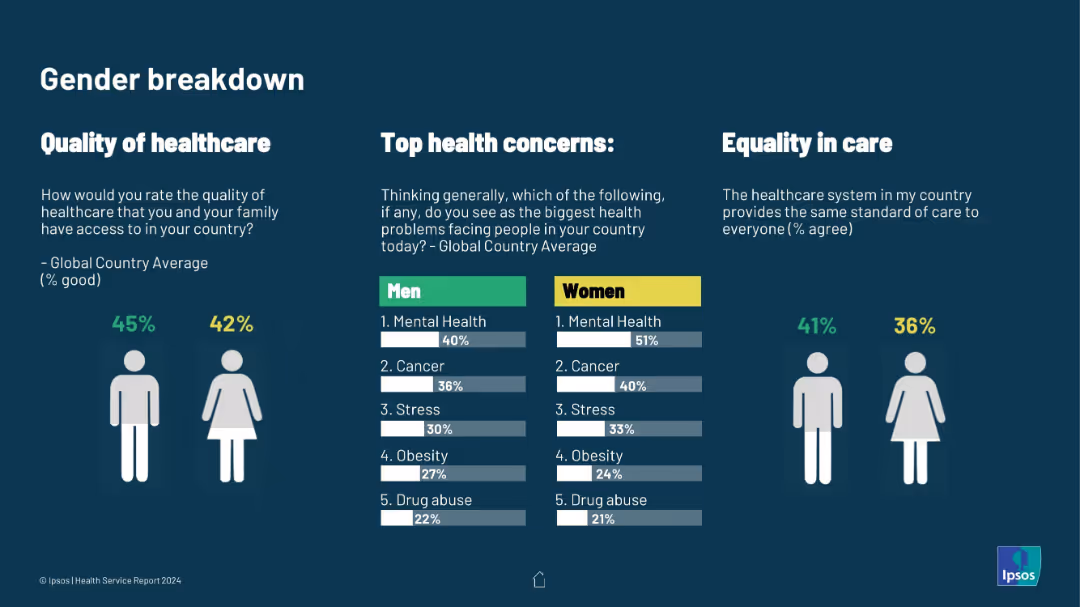
Clean infographic with male/female icons and horizontal bar charts. Covers quality perception, top health concerns, and care equality
Customer and Market Segmentation
Healthcare & Pharmaceuticals
Gender-specific breakdown of healthcare perception and concerns. Women more frequently cite mental health as a top concern; equality in care is also shown to be lower for women.
gender differences, healthcare quality, mental health, health priorities, care equity, Ipsos health data, public perception
Multiple Chart
IPSOS
Saved
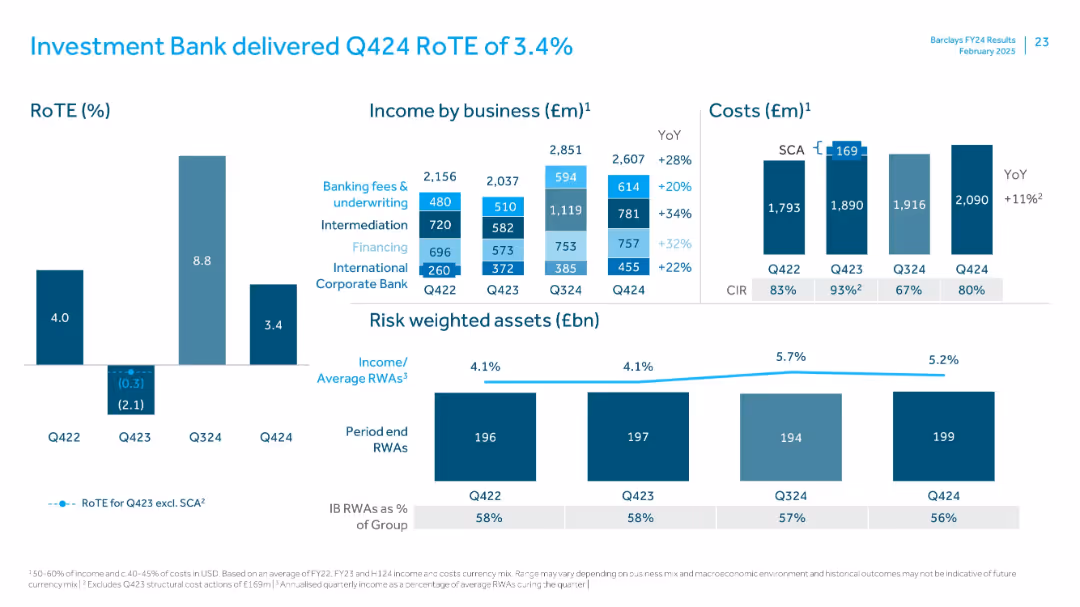
Panel layout with income by business and type; cost bar charts and risk-weighted assets at bottom
Financial Performance
Financial Services
Breaks down Investment Bank’s income across key services—fees, intermediation, financing. RoTE is relatively low. Expenses and risk-weighted assets are charted, with commentary on CIR improvement and business mix effects.
Investment Bank, RoTE, income breakdown, risk-weighted assets, CIR, financing, underwriting
Multiple Chart
Barclays
Saved
This slide contrasts the personal luxury goods market distribution by channel between 2017 and 2025 projections. It uses a stacked column chart to illustrate changes in market channels such as online, department stores, and monobrand stores, with red and gray colors to denote changes over time.
Market Analysis and Trends
Consumer Goods
Evaluates the shifting dynamics in the retail channels for luxury goods, forecasting significant growth in online sales and a reevaluation of physical store strategies. Provides insight into the changing role of different retail formats in the luxury market towards 2025.
luxury goods, retail trends, channel analysis, market strategy, future projections
Multiple Chart
Bain
Saved
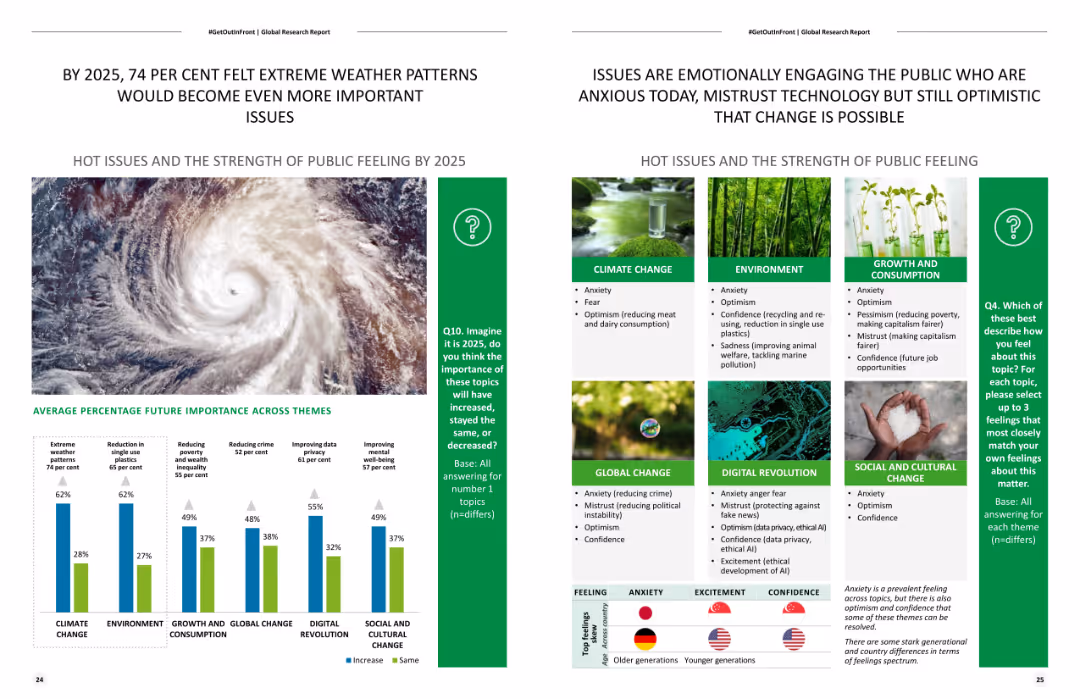
Features a column chart and a list of themes with percentages showing expected future importance of various issues. It also includes a large image of a hurricane.
Strategic Planning
Environmental Services & Sustainability
Predicts the future importance of various global issues by 2025, with a focus on extreme weather patterns and public sentiment analysis on environmental changes.
Future trends, extreme weather, environmental impact, strategic planning, public sentiment
Mixed Chart
Deloitte
Saved
Diagram-centric slide with a detailed circular infographic illustrating the governance structure for ESG topics, complemented by text explanations.
Regulatory and Compliance
Environmental Services & Sustainability
It explains the governance mechanism in place for ESG matters within the company, detailing roles from the Board to specialized committees.
ESG, Governance, Structure, Management, Oversight
Diagram
Booz Allen Hamilton
Saved
Previous
Next
If nothing, comes up, please save your slides first
Create a FREE account to continue browsing
Receive Instant Access to 1,000+ slides from companies like McKinsey, Google, and Goldman Sachs
First Name
Last Name
Email
Password
I agree to all
Terms & Privacy Policy
Thank you! Your submission has been received!
Oops! Something went wrong while submitting the form.
Have an account?
Sign in
Column Chart
Heatmap
Chevron
Org Chart
Infographic
Callouts
Timeline
List
Graphic
Picture
Process Flow
Diagram
Paragraph
Map
Table
Framework
Subtitle
Takeaway Box
Icon
Other Chart
Radar Chart
Waterfall Chart
Mekko Chart
Pie Chart
Scatter Plot
Line Chart
Bar chart
Bullet points