My Account
My Slides
Search by Category
Templates
Leave Feedback
Login
Logout
Get Started
Browse all Slides
Browse all Slides
Create a FREE Account
Instant access to 1,000+ real slides from top companies like McKinsey, BCG, Goldman Sachs, Google and many more!
First Name
Last Name
Email
Password
I agree to all
Terms & Privacy Policy
Thank you! Your submission has been received!
Oops! Something went wrong while submitting the form.
Have an account?
Sign in
Saved Slides
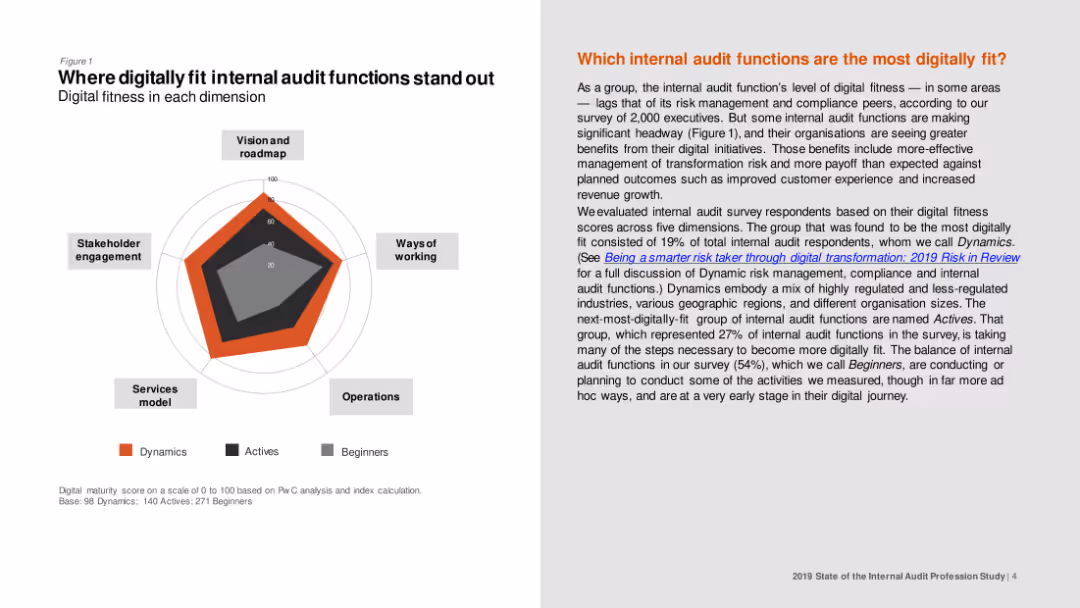
Spider chart illustrating digital fitness scores across dimensions like vision and roadmap, stakeholder engagement, and ways of working for different internal audit groups.
Technology and Digital Transformation
Professional Services
The slide highlights the areas where digitally fit internal audit functions excel, such as stakeholder engagement and services model, comparing Dynamics, Actives, and Beginners.
Digital fitness, internal audit, stakeholder engagement, vision, roadmap
Mixed Chart
PwC/Strategy&
Saved
Contains a table and column charts comparing different scenarios for scrap usage in steel production by 2025, highlighting potential strategies.
Operational Efficiency
Industrial & Manufacturing
The slide proposes strategies for optimizing scrap usage in steel production, with projections and technological implications for 2025.
scrap usage, steel production, strategies, 2025, table, column chart
Mixed Chart
McKinsey
Saved
This slide features a column chart displaying expected changes in second-hand consumption across various markets post-pandemic. The chart uses three color bars for "More," "About the same," and "Less." The text includes a question and survey details.
Market Analysis and Trends
Consumer Goods
The slide shows survey data on anticipated changes in second-hand purchasing behaviors post-pandemic, with comparisons across different global markets.
second-hand, consumption, market trends, survey, global behavior
Multiple Chart
IPSOS
Saved
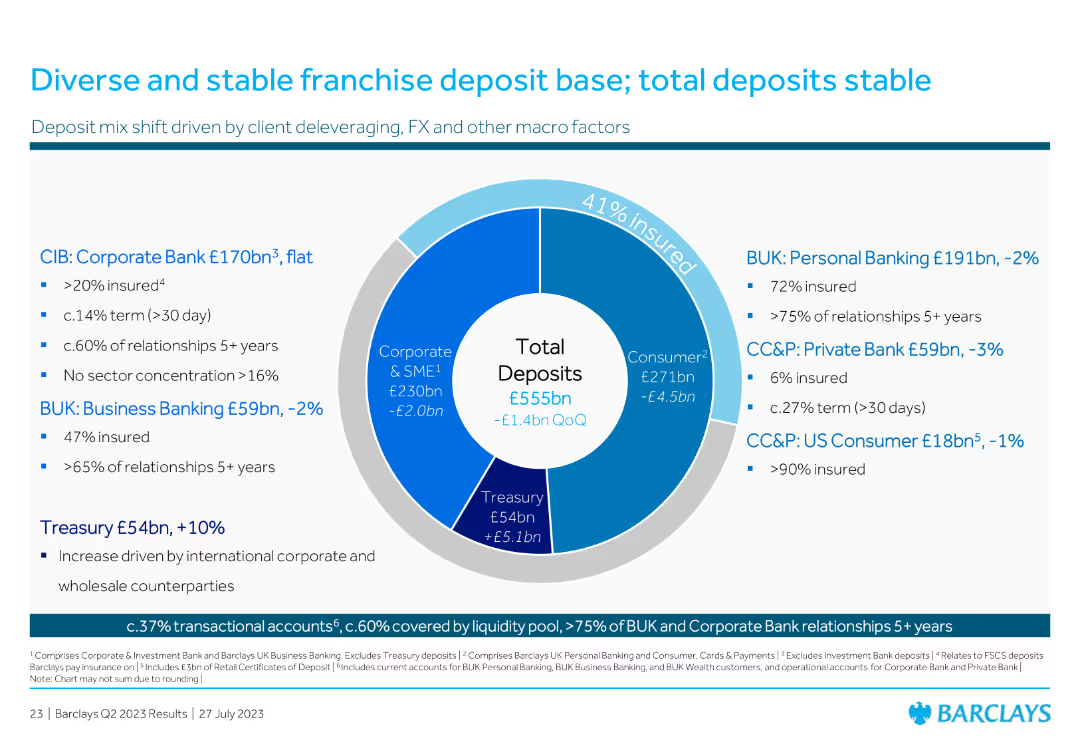
Features a pie chart and bullet points outlining the composition of total deposits across different segments.
Financial Performance
Financial Services
Highlights the diversity and stability of the franchise deposit base, showing stable total deposits and their composition.
deposits, stable, franchise, diversity, base
Mixed Chart
Barclays
Saved
The slide presents two complex scatter plots comparing industry performance and stability. It uses color-coded dots for different industries and banks.
Competitive Landscape
Financial Services
This visual comparison is used to showcase long-term earnings growth and stability within the banking sector, highlighting the company's superior performance.
earnings growth, stability, industry comparison, banks
Multiple Chart
JP Morgan
Saved
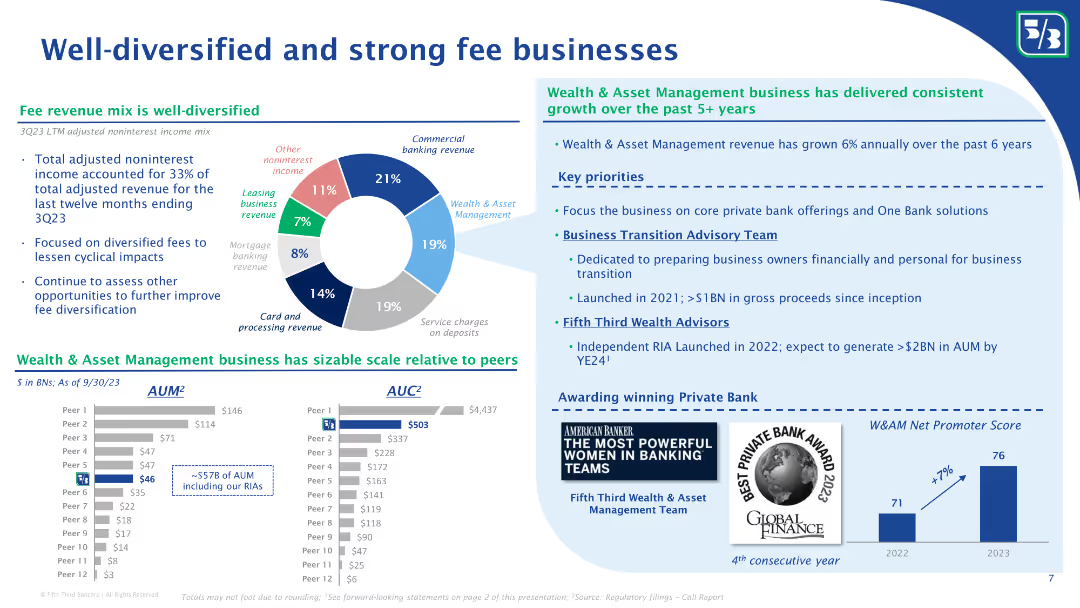
The slide features a pie chart showing the mix of noninterest income, and column charts comparing AUM and AUC with peers. Bullet points discuss the growth of the wealth and asset management business and key priorities for future growth.
Financial Performance
Financial Services
The slide highlights Fifth Third Bank’s diversified fee revenue streams, with a detailed breakdown of noninterest income sources. It showcases their wealth and asset management business growth, comparing AUM and AUC with peers, and outlines key priorities for future growth and client advisory services.
Fee businesses, noninterest income, diversified revenue, AUM, AUC, wealth management, asset management, revenue growth, client advisory, Fifth Third Bank
Multiple Chart
Goldman Sachs
Saved
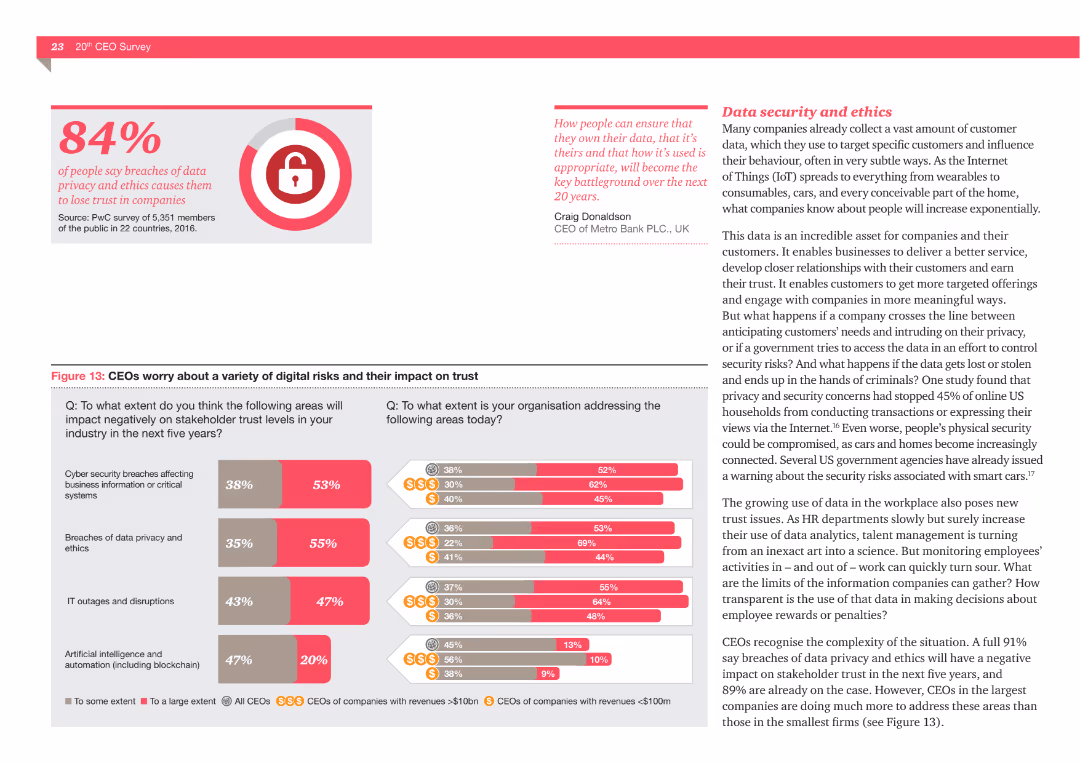
The slide includes a bar chart detailing CEOs' concerns about digital risks like cybersecurity breaches and IT outages, and their impact on stakeholder trust. It shows the extent to which these risks are being addressed.
Risk Assessment and Management
Technology & Software
This slide addresses the digital risks that concern CEOs, such as cybersecurity breaches, data privacy issues, and IT outages, and how these risks impact stakeholder trust. It also highlights the efforts made to address these risks.
Digital risks, cybersecurity, data privacy, IT outages, stakeholder trust, CEOs
Multiple Chart
PwC/Strategy&
Saved
Slide features two sets of column charts and a list of bar charts. Colors vary across charts to differentiate data, using green and grayscale tones.
Market Analysis and Trends
Retail & E-commerce
Slide presents data on second-hand luxury goods purchasing preferences and the most commonly used online platforms by geography in 2018.
second-hand luxury, online shopping, market trends, consumer behavior, platform usage
Multiple Chart
BCG
Saved
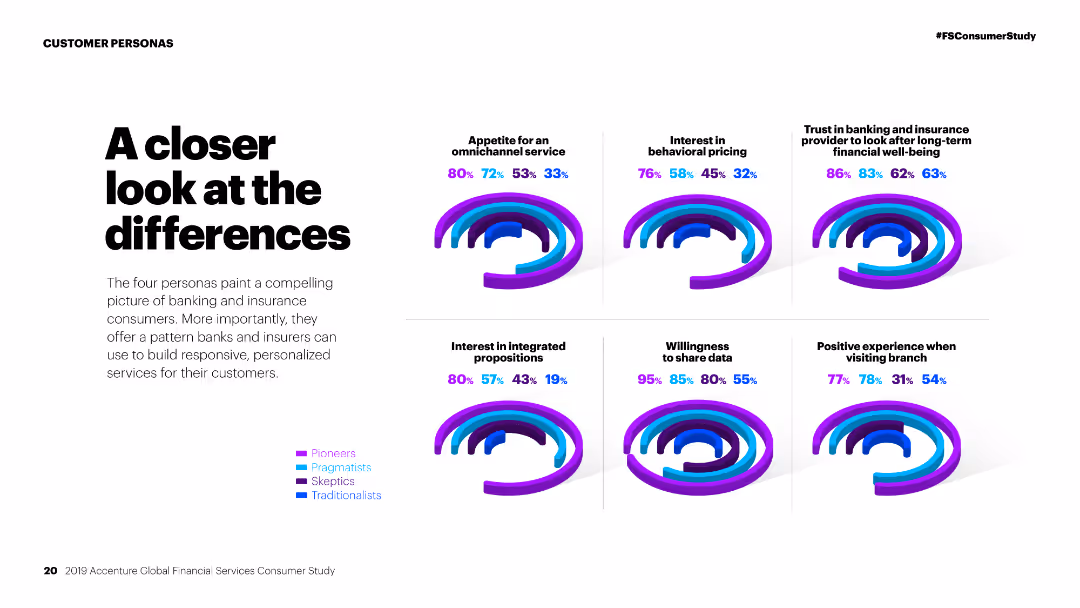
Column charts comparing personas on various factors like omnichannel service, behavioral pricing, and willingness to share data.
Competitive Landscape
Financial Services
Comparison of different customer personas in financial services, analyzing their preferences and behaviors towards various service aspects.
Personas, financial services, comparison, omnichannel service, behavioral pricing, data sharing, customer preferences, market study, segmentation
Multiple Chart
Accenture
Saved
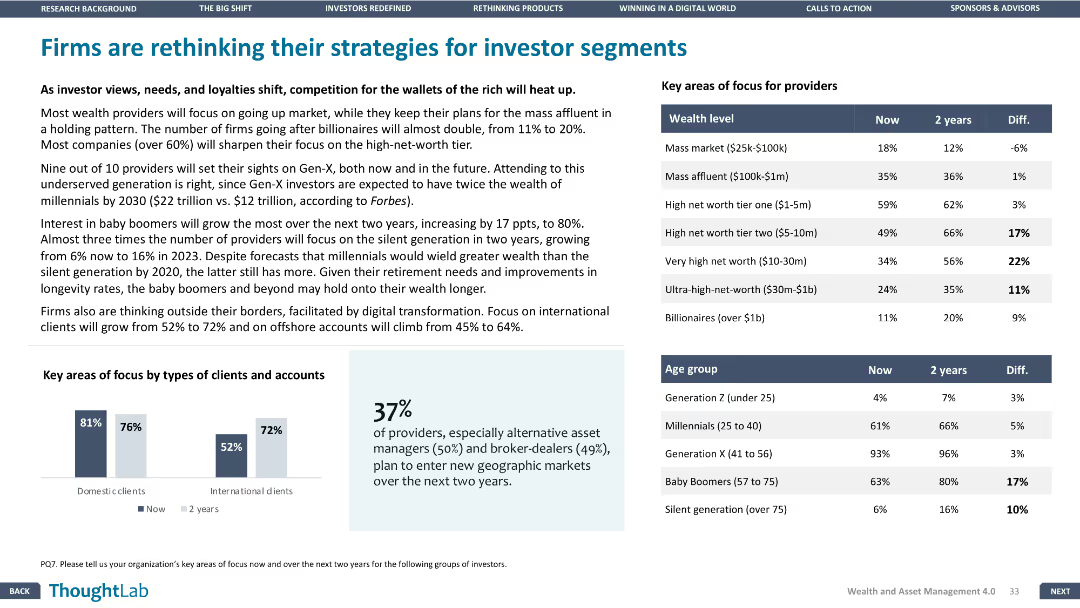
Column charts displaying key areas of focus for providers by wealth level and age group. Design is structured and clear, presenting comparative data effectively.
Strategic Planning
Financial Services
Discusses shifts in firm strategies for different investor segments, with data on focus areas for providers by wealth level and age group over the next two years.
strategies, investors, segments, focus, data
Mixed Chart
Deloitte
Saved
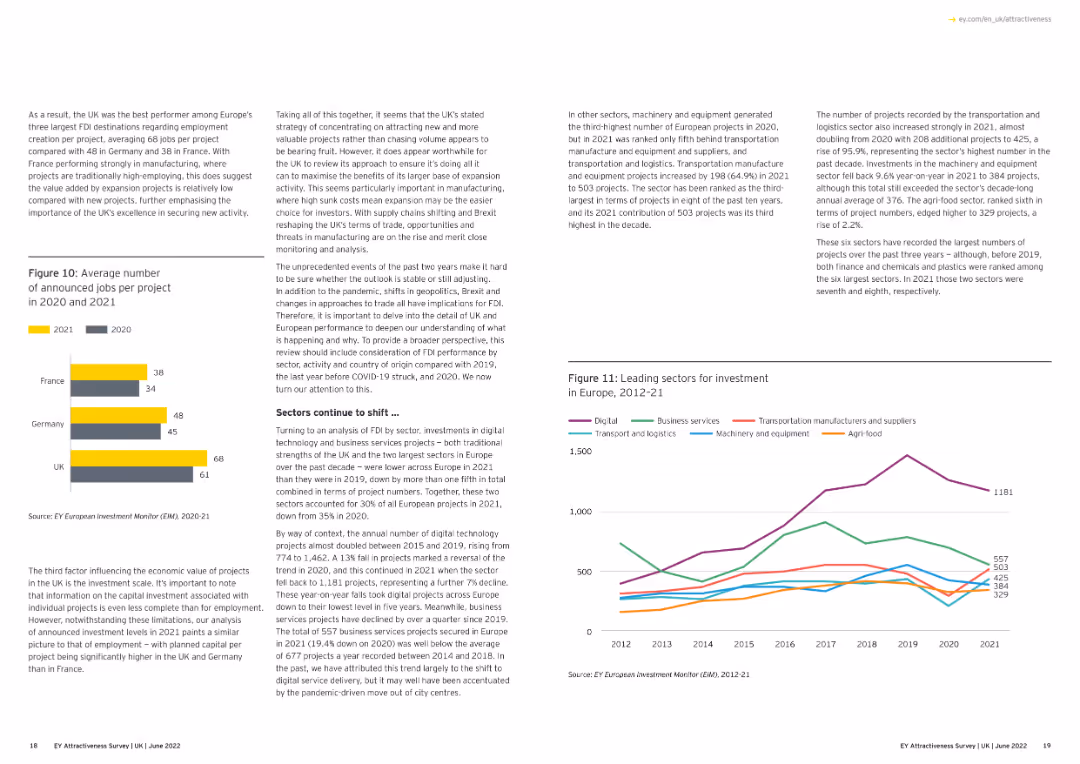
This slide features a column chart comparing the average number of announced jobs per project in 2020 and 2021 for the UK, Germany, and France.
Market Analysis and Trends
Financial Services
The slide presents a comparison of the average number of announced jobs per project in 2020 and 2021 across three countries, highlighting the UK's performance.
FDI, jobs, comparison, UK, Germany, France
Multiple Chart
EY
Saved
A single column chart depicts the increase in mobile gaming revenue per gamer from 2015 to 2025, with key growth drivers listed.
Market Analysis and Trends
Media & Entertainment
The slide centers on the revenue per mobile gamer in SEA, highlighting a 3.6x increase and mobile gaming's share of total gaming revenue.
mobile gaming, revenue, SEA, growth
Multiple Chart
Bain
Saved
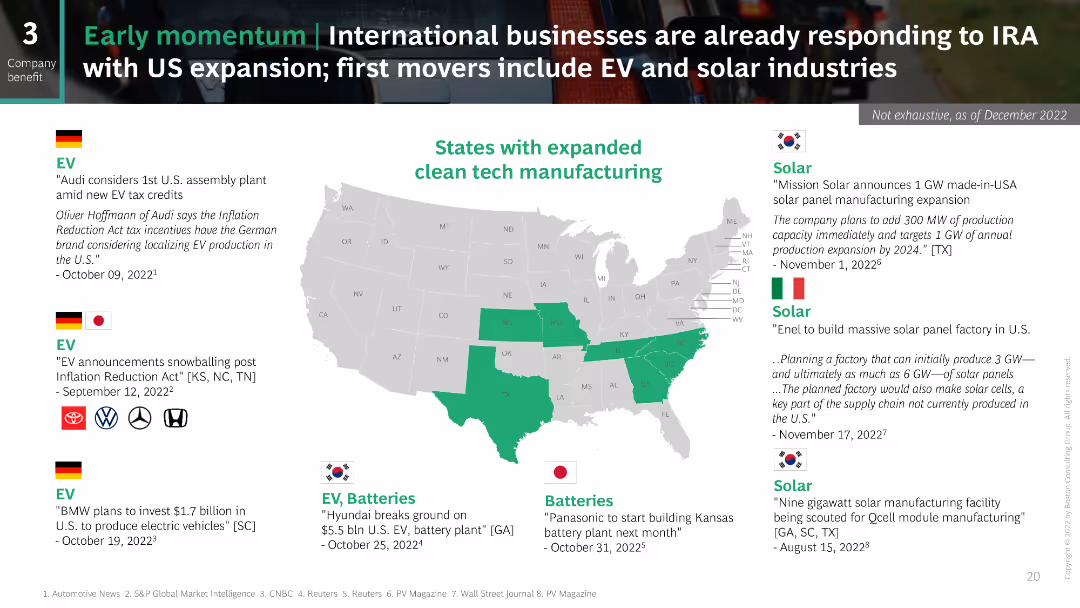
The slide features a US map highlighting states with expanded clean tech manufacturing in green. The left side lists company announcements with their logos and relevant dates. On the right, there are descriptions of solar initiatives.
Market Analysis and Trends
Energy & Utilities
This slide discusses the early response to the Inflation Reduction Act (IRA) by international businesses, specifically focusing on electric vehicles (EV) and solar industries. It highlights various company announcements and planned expansions in the US.
tax credits, IRA, financial benefits, market size, transfer
Graphic
BCG
Saved
The slide contains a donut chart showing the subscription mix of Gartner's research revenue. The chart highlights that 92% of revenue is subscription-based.
Financial Performance
Professional Services
It highlights the dominance of subscription revenue in Gartner’s research segment, indicating a stable and recurring revenue model.
Gartner, research, subscription, revenue, recurring, financial performance, model
Single Chart
Gartner
Saved
Includes a bar graph comparing employment roles in "FIGURE 4", bulleted text, and detailed analysis on the right side concerning work roles in the US.
Market Analysis and Trends
Technology & Software
The slide examines the redistribution of work roles in the United States from 2017 to 2028, highlighting the major increase in workers required in 'Empathy and Support' roles over the next 10 years.
Workforce, Empathy, Support, USA, Redistribution
Mixed Chart
Accenture
Saved
The slide includes a bar chart showing the percentage of global IPOs by sector and the number and proceeds of IPOs for 2022 compared to 2021.
Market Analysis and Trends
Financial Services
Shows the dominance of the technology sector in IPO volume and the leading role of the energy sector in IPO proceeds in 2022.
Technology, energy, IPO, sector comparison, 2022
Multiple Chart
EY
Saved
A visionary slide showcasing futuristic concepts with images and text, focusing on how luxury brands can harness creativity and innovation. It presents a forward-looking perspective with inspirational quotes and graphics.
Strategic Planning
Consumer Goods
This slide envisions the future of the luxury market in 2030, advocating for brands to embrace cultural and creative excellence. It suggests strategies for brands to reimagine their roles through innovation, creativity, and deeper consumer engagement, aiming to drive future growth and market dominance.
future trends, luxury market, innovation, creativity, brand strategy
Mixed Chart
Bain
Saved
Features a line chart comparing the growth indices of GDP, exports, and FDI from 2015 to 2030, with annotations on forecasted trends. The chart is supported by bullet-pointed annotations for clarity.
Market Analysis and Trends
Financial Services
Slide predicts growth trends in GDP, exports, and FDI up to 2030, emphasizing the ongoing increase despite controversies in globalization. Useful for financial forecasting and economic strategy meetings.
GDP, exports, FDI, forecasts, globalization
Multiple Chart
Roland Berger
Saved
Slide includes multiple column charts presenting financial data like revenue CAGR and CET1 ratio development across various banking divisions.
Performance Metrics and KPIs
Financial Services
Analyzes Deutsche Bank’s key performance metrics such as revenue growth, cost/income ratio, and liquidity, comparing current data with previous fiscal years.
performance, revenue, financial metrics, banking, growth
Multiple Chart
Deutsche Bank
Saved
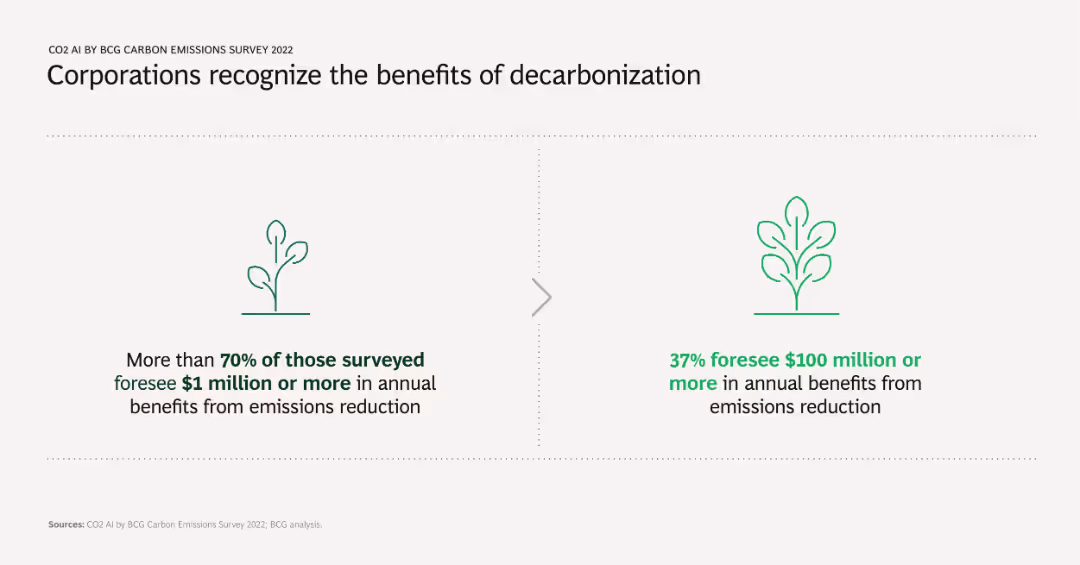
Two comparative infographic elements showing survey results: one indicating the percentage of companies seeing $1 million+ in annual benefits, and the other showing those seeing $100 million+ in benefits from emission reductions.
Strategic Planning
Environmental Services & Sustainability
Highlights the financial benefits corporations expect from decarbonization efforts, showcasing significant monetary advantages at different scales. Supports the argument for strategic investment in emission reduction initiatives.
decarbonization, financial benefits, emission reduction, survey, strategic planning
Boxed
BCG
Saved
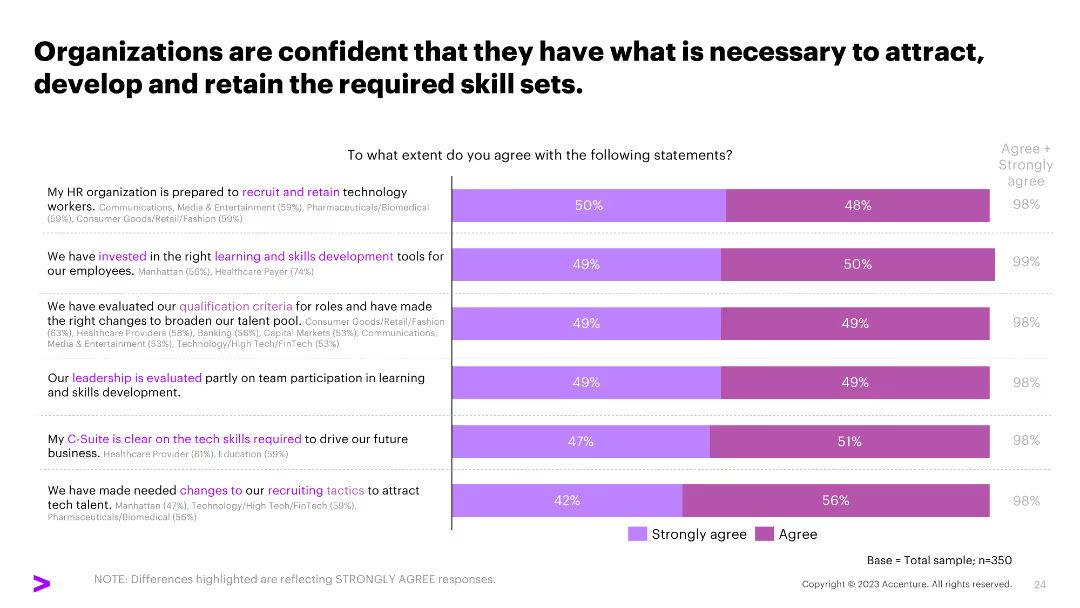
A column chart showing agreement levels on various HR practices, such as recruitment, skills development, and leadership evaluation, with percentages for each.
Human Resources and Talent Management
Professional Services
The slide shows how organizations agree on their capability to attract, develop, and retain required skill sets, emphasizing effective HR practices.
HR practices, skills development, recruitment, leadership evaluation
Mixed Chart
Accenture
Saved
The slide presents a series of column charts with varying shades of blue indicating different sectors such as DFS, E-commerce, and Transport. Each chart corresponds to a year from 2019 to H1 2022 and includes percentages and the private funding value in billions. The layout is well-organized with a clear legend and is titled in large, bold font.
Market Analysis and Trends
Financial Services
This slide analyzes the shift in private funding within various sectors from 2019 to the first half of 2022. DFS has overtaken e-commerce in terms of investment, highlighting significant industry dynamics and investment trends. It can be used for presenting market shifts and predicting future investment focus.
DFS, e-commerce, transport, investment, trends, market shift, funding, analysis, 2019-2022
Single Chart
Bain
Saved
Slide includes a column chart and table with data showing interest levels in vehicle subscription services by age, and key characteristics valued in such services.
Product and Service Analysis
Transportation & Logistics
Explores consumer interest in vehicle subscription models, highlighting the importance of cost control, convenience, and flexibility.
Vehicle subscription, consumer interest, cost control, convenience, flexibility
Mixed Chart
Deloitte
Saved
Features multiple pie charts displaying the percentage use of AI in different operational areas.
Operational Efficiency
Technology & Software
Outlines the use of AI in daily operations across various industries, focusing on customer experience and operations, and highlights the sectors and processes where AI has the most significant impact.
AI, operations, customer experience, day-to-day, industries
Multiple Chart
Deloitte
Saved
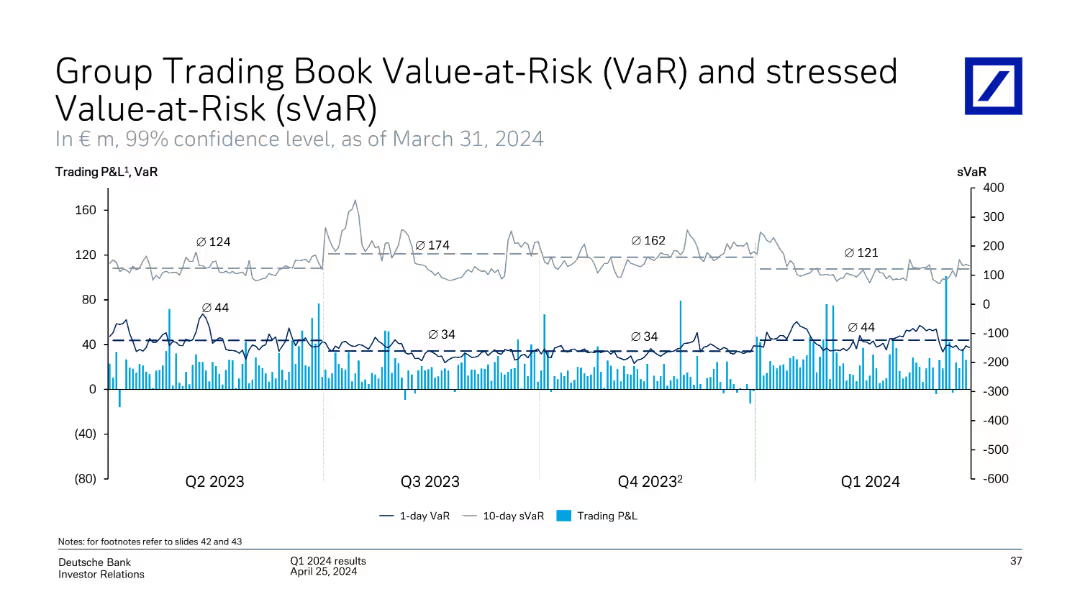
This slide features a line chart showing the Group Trading Book Value-at-Risk (VaR) and stressed VaR over four quarters, with additional details on trading P&L.
Risk Assessment and Management
Financial Services
Analyzes the trading book value-at-risk and stressed value-at-risk over time, including 1-day VaR, 10-day sVaR, and trading P&L figures for risk management.
trading, value-at-risk, VaR, sVaR, trading P&L, risk management, line chart
Single Chart
Deutsche Bank
Saved
Previous
Next
If nothing, comes up, please save your slides first
Create a FREE account to continue browsing
Receive Instant Access to 1,000+ slides from companies like McKinsey, Google, and Goldman Sachs
First Name
Last Name
Email
Password
I agree to all
Terms & Privacy Policy
Thank you! Your submission has been received!
Oops! Something went wrong while submitting the form.
Have an account?
Sign in
Column Chart
Heatmap
Chevron
Org Chart
Infographic
Callouts
Timeline
List
Graphic
Picture
Process Flow
Diagram
Paragraph
Map
Table
Framework
Subtitle
Takeaway Box
Icon
Other Chart
Radar Chart
Waterfall Chart
Mekko Chart
Pie Chart
Scatter Plot
Line Chart
Bar chart
Bullet points