My Account
My Slides
Search by Category
Templates
Leave Feedback
Login
Logout
Get Started
Browse all Slides
Browse all Slides
Create a FREE Account
Instant access to 1,000+ real slides from top companies like McKinsey, BCG, Goldman Sachs, Google and many more!
First Name
Last Name
Email
Password
I agree to all
Terms & Privacy Policy
Thank you! Your submission has been received!
Oops! Something went wrong while submitting the form.
Have an account?
Sign in
Saved Slides
Features a table with a well-organized layout. Each section is divided by clear headings, and the color scheme is consistent, enhancing readability. Information is presented through a mix of visuals and brief textual explanations.
Market Analysis and Trends
Environmental Services & Sustainability
Explores the potential value in developing projects related to carbon credit trading, focusing on the Southeast Asian market. It assesses various phases such as project design, implementation, and monitoring, providing estimated market sizes and profit margins.
carbon credits, market value, SEA, project development, trading
Table
Bain
Saved
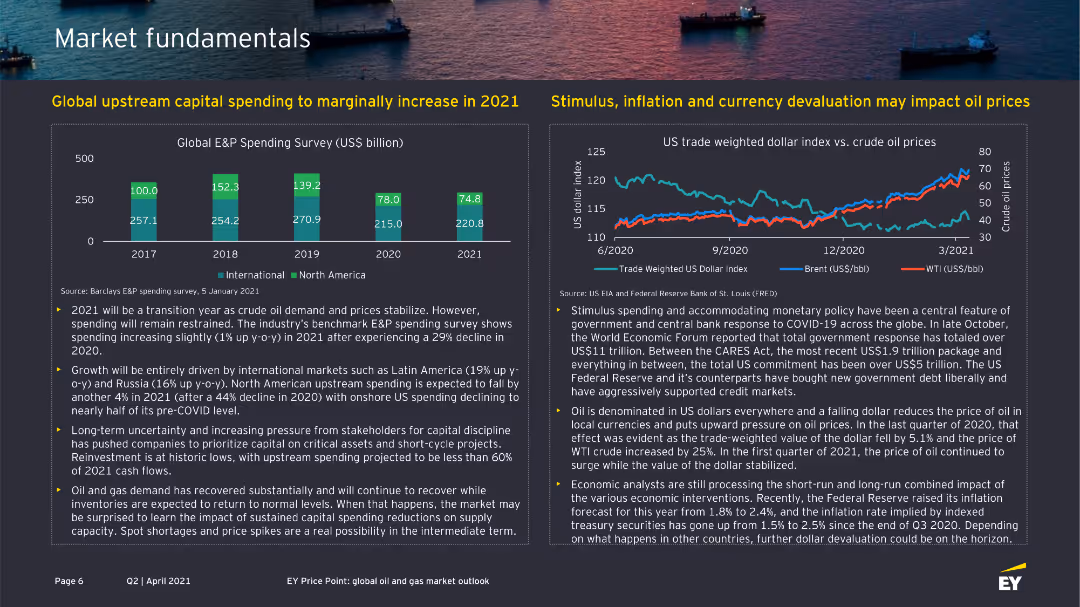
The slide features two column charts, one showing global E&P spending survey results and another line chart showing the US trade-weighted dollar index vs. crude oil prices.
Market Analysis and Trends
Energy & Utilities
It presents data on global upstream capital spending and the impact of economic factors like stimulus, inflation, and currency devaluation on oil prices.
E&P spending, capital, oil prices, trade-weighted dollar, inflation
Multiple Chart
EY
Saved
The slide features a blend of pie charts, bar graphs, and detailed textual information, using a mix of red, blue, and grey shades.
Financial Performance
Industrial & Manufacturing
The slide summarizes Leonardo's 2021 annual results, highlighting significant achievements such as revenue growth, backlog, and order value, along with a special focus on financial metrics.
annual results, revenue growth, financial metrics, backlog, orders, FOCF, ROIC, commercial momentum, EBITA
Multiple Chart
Goldman Sachs
Saved
The slide contains a set of comparison blocks split into three categories: Environment, Social/Stakeholders, and Corporate Governance. Each block has key figures and percentages, highlighted with distinct colors like green, blue, and yellow. Icons and minimal text accompany the data for a clean visual appeal.
Regulatory and Compliance
Environmental Services & Sustainability
The slide highlights the 2022 sustainability achievements in environmental impact, social responsibility, and corporate governance. It includes key performance indicators such as carbon emissions, energy consumption, and tenant satisfaction rates. This slide could serve to showcase corporate social responsibility progress in investor meetings or internal company reviews on sustainability practices.
sustainability, corporate governance, social responsibility, KPIs, environmental impact
Table
Morgan Stanley
Saved
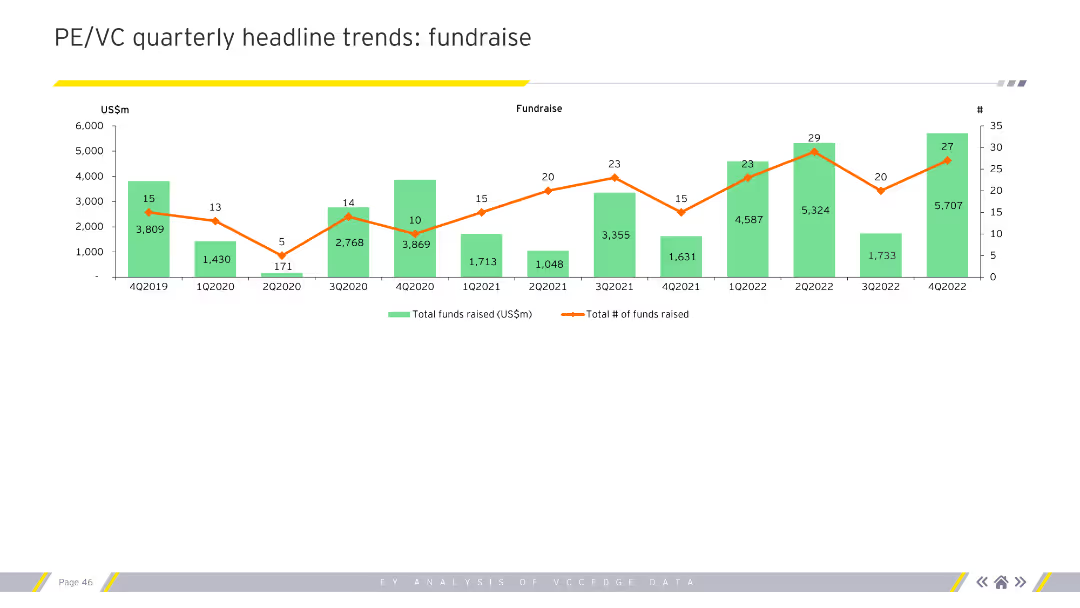
Features line and column charts depicting fundraising trends by total funds raised and the number of funds raised over different quarters. Visual complexity is moderate.
Investment Analysis
Financial Services
Analyzes trends in private equity and venture capital fundraising, showing variations in the amount and number of funds raised quarterly. Essential for fundraising strategists and investors.
fundraising, PE, VC, trends, financial, analysis
Single Chart
EY
Saved
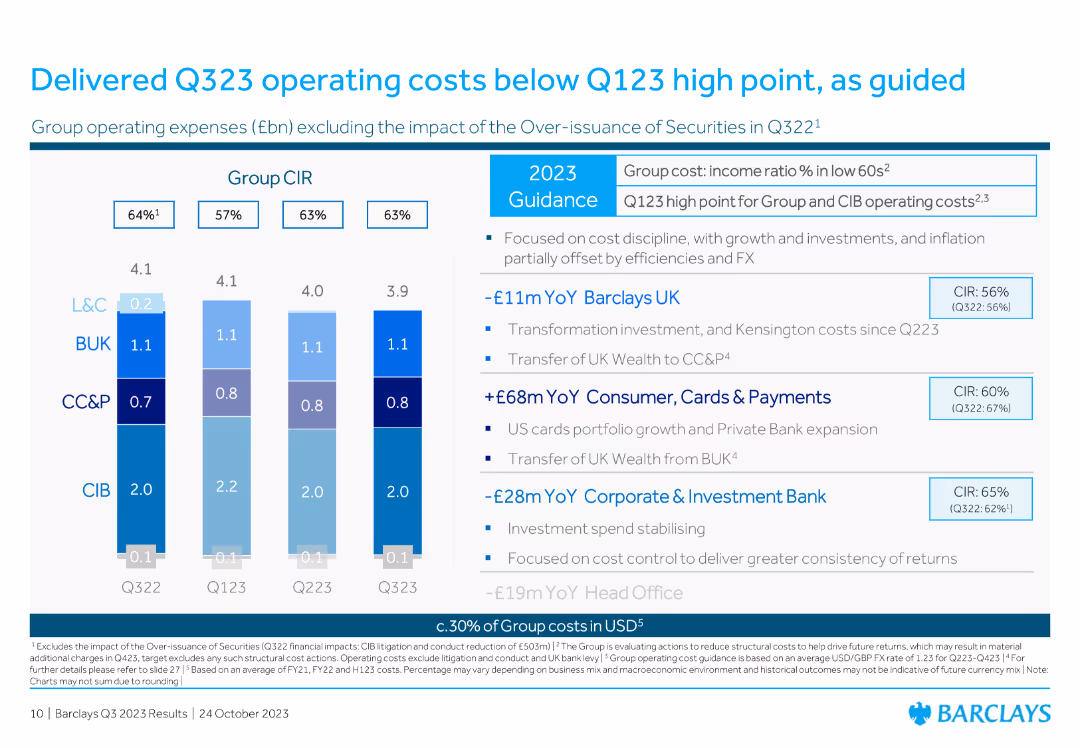
The slide contains a column chart depicting group operating expenses (£bn) excluding the impact of over-issuance of securities from Q322 to Q323. It includes details on cost reductions and operating expenses for different divisions.
Operational Efficiency
Financial Services
The slide reports that Barclays' operating costs for Q323 were below the Q123 high point, with a focus on cost discipline and detailed reductions for divisions like Barclays UK, CC&P, and Corporate & Investment Bank.
operating costs, Q323, cost discipline, reductions, divisions
Mixed Chart
Barclays
Saved
The slide includes a column chart of 2023 redemptions alongside a comprehensive table showing bond details, including ISIN, instrument type, currency, notional amounts, and maturity dates.
Financial Performance
Financial Services
This slide provides an overview of bond redemptions by UBS in 2023, detailing instrument types, currencies, and financial metrics, useful for financial analysis and reporting.
UBS, 2023 redemptions, bonds, financial metrics, maturity dates
Mixed Chart
UBS
Saved
This slide features a large green circle graph comparing digital economy projections for 2022, 2025, and 2030 with bullet point annotations.
Financial Performance
Technology & Software
It illustrates SEA’s digital economy growth potential up to $1T GMV by 2030 and stresses the need for sustainable development.
digital economy, SEA, GMV, growth potential, sustainable
Mixed Chart
Bain
Saved
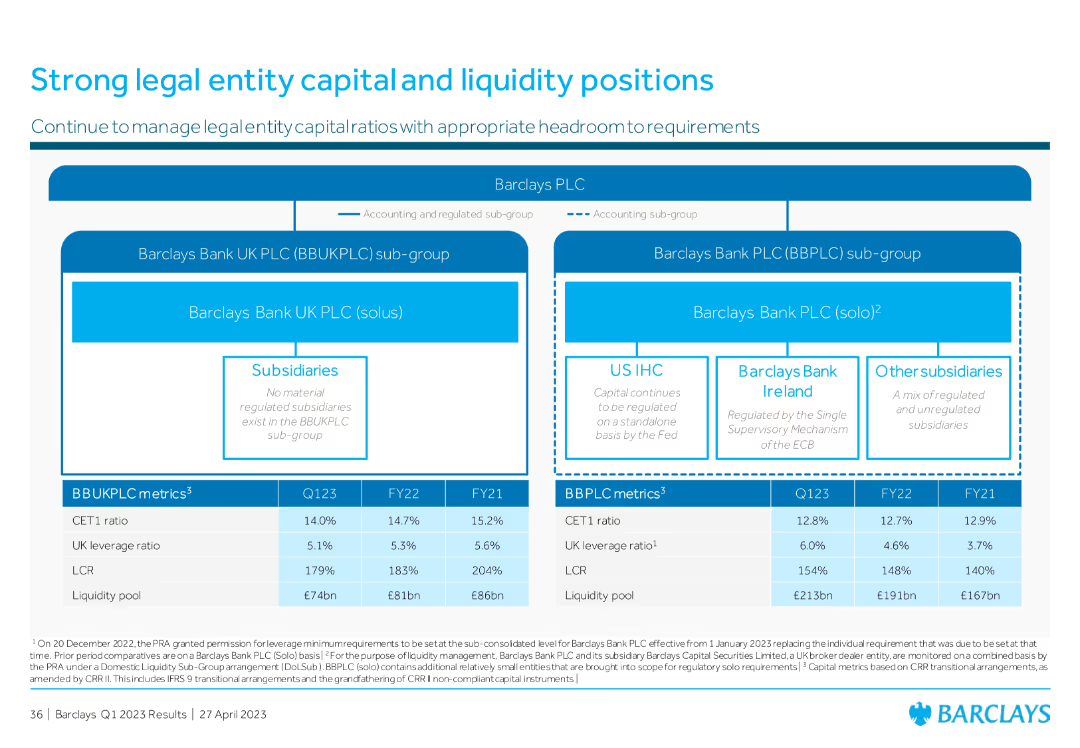
The slide includes a flowchart of legal entities and a table comparing key financial metrics across different periods.
Risk Assessment and Management
Financial Services
This slide details the capital and liquidity positions of legal entities within the bank, comparing metrics like CET1 ratio and leverage ratio across different timeframes, underscoring the strong financial health and regulatory compliance.
legal entities, capital, liquidity, financial metrics
Diagram
Barclays
Saved
Includes pie charts and a column chart detailing the distribution and composition of loans across different geographical regions and business segments.
Market Analysis and Trends
Financial Services
Used to analyze the credit distribution of a financial institution by region and segment, illustrating the focus on different markets and the types of loans dominating each area.
Credit, Loans, Markets, Distribution, Pie Charts, Regional Analysis, Banking, Financial Services, Portfolio
Multiple Chart
Citigroup
Saved
Bar chart showing the share of consumers by age who describe themselves as addicted to social media in 2019, and a column chart showing the average daily time spent on social media from 2012 to 2021.
Market Analysis and Trends
Media & Entertainment
The slide highlights the impact of social media addiction, particularly among younger age groups. It presents data on the percentage of users addicted to social media by age and the increasing amount of time spent on social media daily, raising concerns about the negative societal effects of pervasive social media use.
Social Media, Addiction, Time Spent, Age Groups
Multiple Chart
Roland Berger
Saved
The slide features icons representing methodology elements like interviews, data inputs, and research sources for the venture capital study.
Market Analysis and Trends
Financial Services
Details the methodology of the joint study on Indonesia’s venture capital outlook by Google and A.T. Kearney, highlighting data sources and research.
Venture Capital, Indonesia, Methodology, Research
Multiple Chart
Kearney
Saved
Features a circular ecosystem diagram with different industry roles such as Upgrader and Recycler, connected by arrows to indicate workflow, accompanied by descriptive text.
Operational Efficiency
Transportation & Logistics
Highlights the necessity for collaboration in the maritime industry to optimize resource use and enhance sustainability through a circular economic model.
maritime, collaboration, circular economy, sustainability, optimization
Diagram
Accenture
Saved
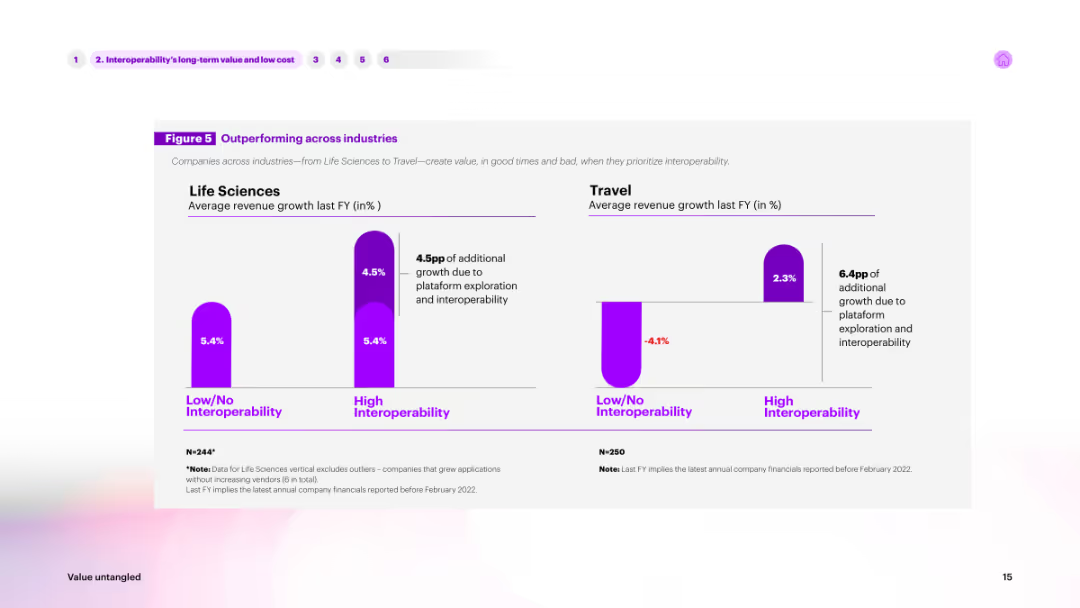
The slide features a column chart comparing average revenue growth across industries (Life Sciences, Travel) based on interoperability. High interoperability is shown in purple, while low/no interoperability is shown in a lighter shade.
Market Analysis and Trends
Technology & Software
Highlights how interoperability impacts revenue growth in different industries. The chart compares life sciences and travel sectors, showing significant growth advantages for companies with high interoperability.
interoperability, industry comparison, revenue, growth, life sciences
Multiple Chart
Accenture
Saved
Contains flow chart and icons illustrating three major market trends affecting the financial sector.
Strategic Planning
Financial Services
Outlines key trends shaping the market, such as the growth of B2B, competitive B2C environments, and alternative payments.
market shifts, B2B growth, competition, B2C, payments
Pillar
BCG
Saved
This slide presents a horizontal sequence of mobile app screens showing features of the Credit Journey service, including credit score access, historical scores, and tailored offers. Each screen is annotated with explanations of features.
Financial Performance
Financial Services
This slide outlines the Credit Journey service offered by Chase, showing various app functionalities aimed at enhancing customer engagement and providing value through tailored financial products and services.
credit score, customer engagement, app, Chase, financial products, tailored offers, identity protection, historical scores
Linear Flow
JP Morgan
Saved
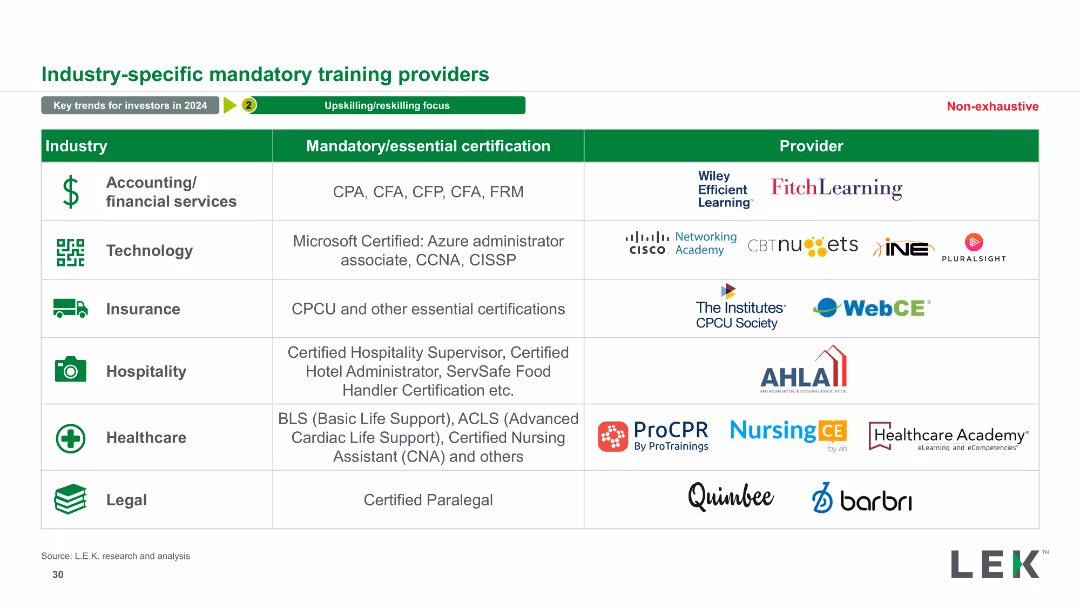
The slide presents a table with three columns: Industry, Mandatory/essential certification, and Provider. Various industries are listed along with corresponding certifications and providers. It includes logos of providers and icons for each industry.
Operational Efficiency
Professional Services
This slide details mandatory certifications for various industries and the corresponding providers. It serves as a resource for understanding industry-specific training requirements.
Mandatory, Certification, Provider, Industry, Training, Education, Professional Services, Qualifications, Skills, Compliance
Table
LEK
Saved
Features column charts illustrating credit loss provisions over several quarters. It uses color coding to differentiate between stages of credit, complemented by succinct explanatory notes.
Risk Assessment and Management
Financial Services
Focuses on the trends in credit loss provisions at Deutsche Bank, showing historical data and recent quarterly changes. It is valuable for risk management analysis and financial planning.
credit losses, risk management, quarterly trends, financial planning
Mixed Chart
Deutsche Bank
Saved
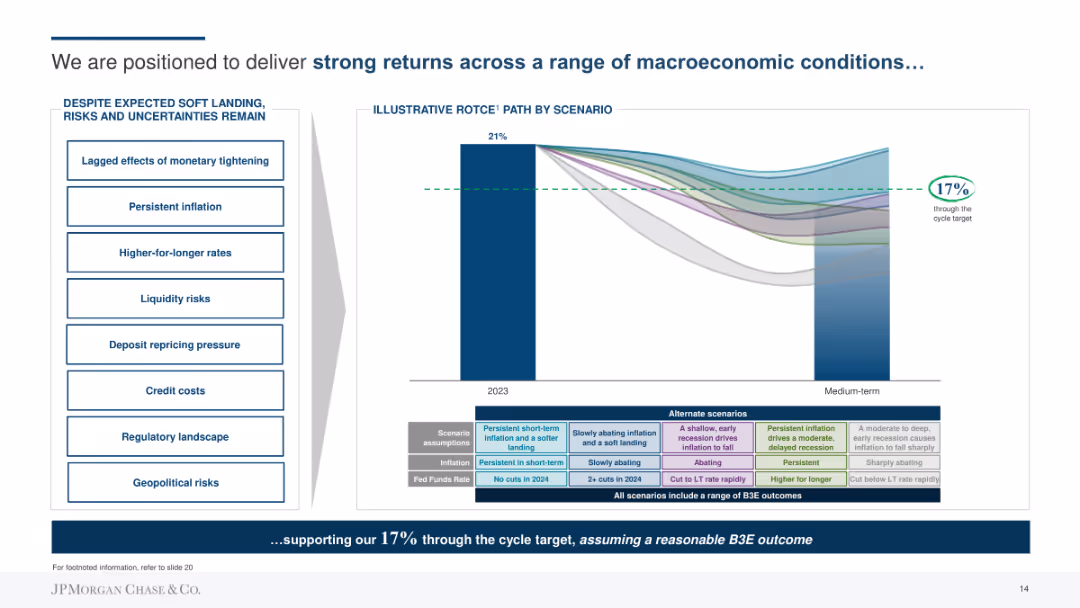
Combination of bar chart showing ROTCE by scenario and a side panel listing economic risks and uncertainties. Uses color-coded scenarios and a line to indicate the target return.
Strategic Planning
Financial Services
Outlines JP Morgan's strategy to deliver strong returns through different economic scenarios, emphasizing risk management and strategic planning. Shows ROTCE projections and lists potential risks like inflation and credit costs.
Returns, Strategy, Planning, ROTCE, Risks, Economic, Financial
Mixed Chart
JP Morgan
Saved
The slide features a bar chart with four categories and a key findings box. Colors differentiate levels of preparedness. Text is descriptive but minimal, creating a clean look.
Risk Assessment and Management
Technology & Software
The slide depicts corporate preparedness for generative AI across four domains: technology infrastructure, strategy, risk & governance, and talent. It highlights a disparity in readiness, with technology infrastructure being the most prepared aspect and talent the least.
generative AI, preparedness, technology, strategy, risk, governance, talent, infrastructure
Single Chart
Deloitte
Saved
Uses dual-line graphs to contrast online and offline retail trends. The layout is clean, with markers for the lockdown period.
Market Analysis and Trends
Retail & E-commerce
Evaluates the shift in retail sales channels due to COVID-19, emphasizing the growth of online retail and decline in offline sales.
retail shift, online sales, offline sales, COVID-19 impact
Single Chart
BCG
Saved
Slide with two column charts depicting cumulative gross cost reductions and integration-related expenses by year-end 2026.
Financial Performance
Financial Services
The slide outlines UBS's goal to achieve 13 billion in cumulative gross cost savings by the end of 2026 through various initiatives.
cost savings, cumulative reductions, integration expenses, UBS cost management
Multiple Chart
UBS
Saved
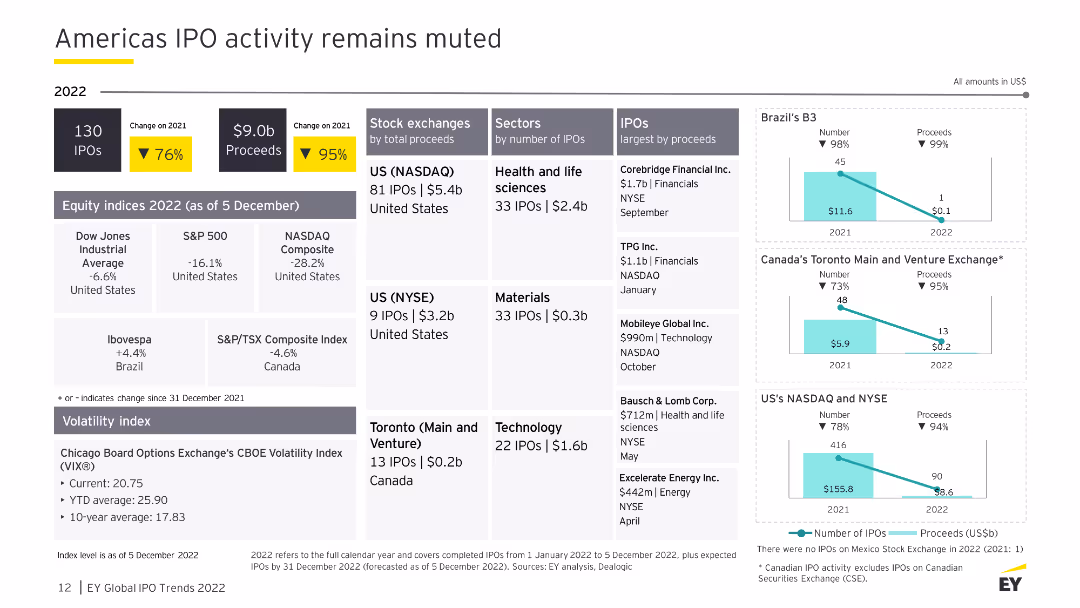
This slide uses multiple data points and small bar charts to summarize IPO activities, proceeds, and sector distributions for the Americas in 2022. The layout is data-heavy but organized clearly.
Market Analysis and Trends
Financial Services
The slide provides an overview of IPO activity in the Americas for 2022, showing a significant decline in the number of IPOs and proceeds compared to 2021. It includes detailed breakdowns by stock exchanges and sectors.
IPO, Americas, stock exchange, proceeds, 2022
Multiple Chart
EY
Saved
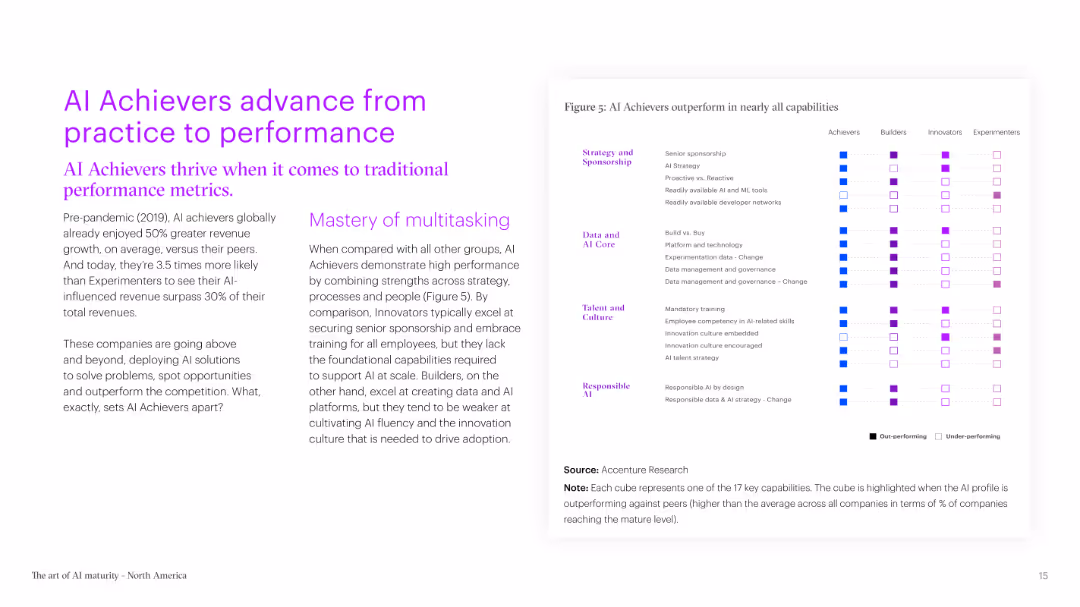
A two-column slide with text on the left and a matrix chart on the right. The matrix shows how AI Achievers outperform in various capabilities compared to other groups.
Strategic Planning
Technology & Software
The slide highlights the superior performance of AI Achievers in traditional performance metrics, emphasizing their ability to multitask and outperform competitors in nearly all key capabilities.
AI, performance, metrics, capabilities, multitasking, Achievers, comparison, traditional, superior, groups
Boxed
Accenture
Saved
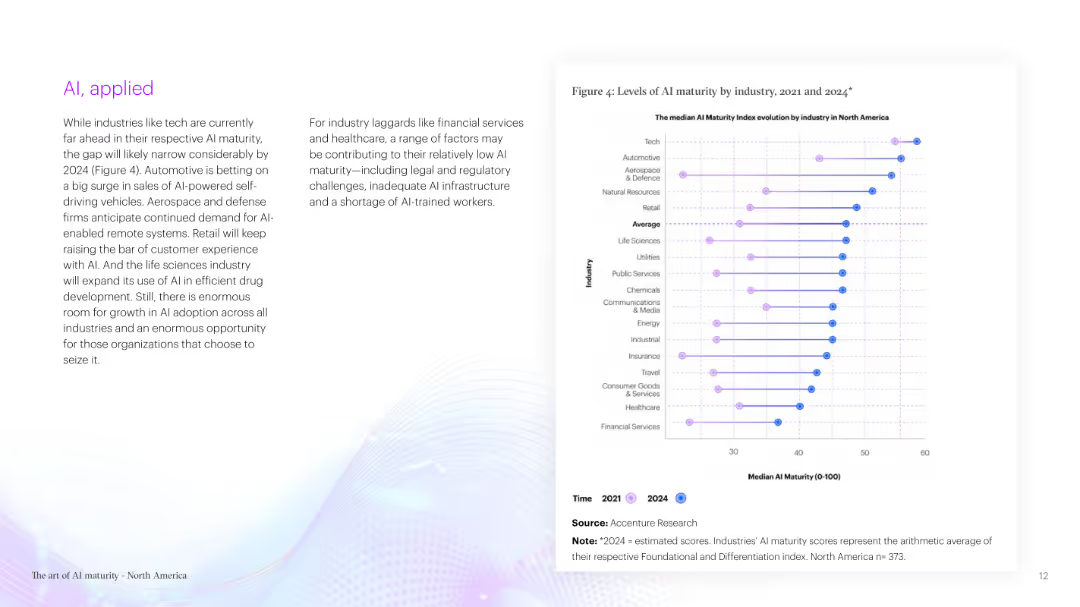
A two-column slide with text on the left and a column chart on the right. The column chart compares AI maturity levels across various industries from 2021 to 2024.
Technology and Digital Transformation
Technology & Software
The slide discusses AI maturity across industries, predicting a narrowing gap by 2024, with tech industries leading. It mentions the challenges faced by financial services and healthcare in adopting AI due to various factors.
AI, maturity, industries, technology, adoption, challenges, predictions, 2024, financial, healthcare
Mixed Chart
Accenture
Saved
Previous
Next
If nothing, comes up, please save your slides first
Create a FREE account to continue browsing
Receive Instant Access to 1,000+ slides from companies like McKinsey, Google, and Goldman Sachs
First Name
Last Name
Email
Password
I agree to all
Terms & Privacy Policy
Thank you! Your submission has been received!
Oops! Something went wrong while submitting the form.
Have an account?
Sign in
Column Chart
Heatmap
Chevron
Org Chart
Infographic
Callouts
Timeline
List
Graphic
Picture
Process Flow
Diagram
Paragraph
Map
Table
Framework
Subtitle
Takeaway Box
Icon
Other Chart
Radar Chart
Waterfall Chart
Mekko Chart
Pie Chart
Scatter Plot
Line Chart
Bar chart
Bullet points