My Account
My Slides
Search by Category
Templates
Leave Feedback
Login
Logout
Get Started
Browse all Slides
Browse all Slides
Create a FREE Account
Instant access to 1,000+ real slides from top companies like McKinsey, BCG, Goldman Sachs, Google and many more!
First Name
Last Name
Email
Password
I agree to all
Terms & Privacy Policy
Thank you! Your submission has been received!
Oops! Something went wrong while submitting the form.
Have an account?
Sign in
Saved Slides
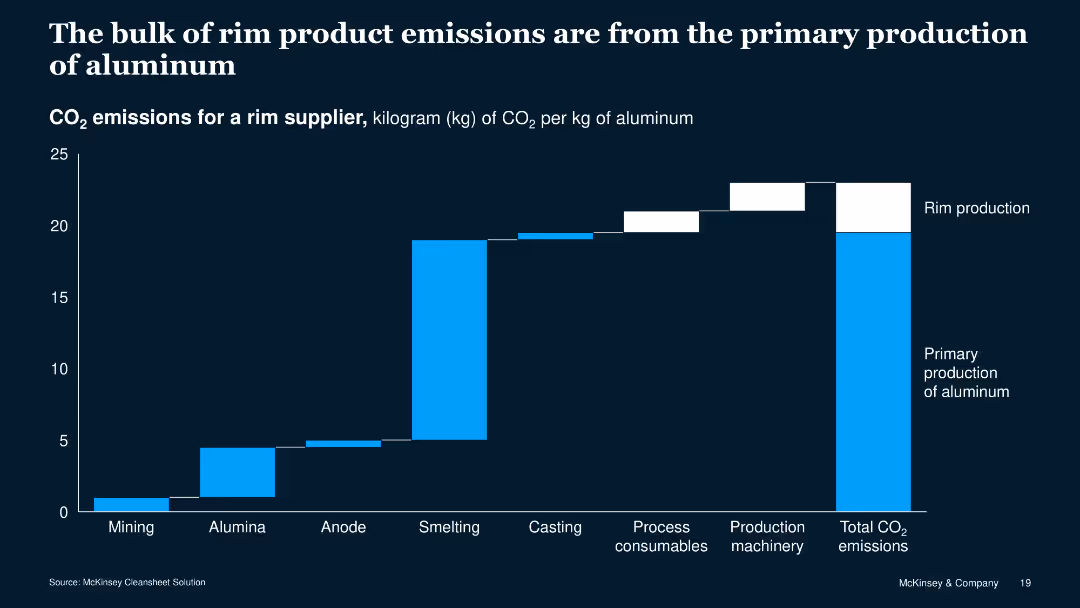
The slide features a column chart with blue and white bars showing CO2 emissions across different production stages of aluminum rims. The chart is against a dark blue background.
Risk Assessment and Management
Industrial & Manufacturing
This slide presents data on CO2 emissions from various stages of aluminum rim production, highlighting that primary production contributes most to the total emissions.
CO2 emissions, aluminum, production stages, data visualization, environment, manufacturing, risk, assessment, management, sustainability
Single Chart
McKinsey
Saved
Timeline from 1871 to 2020 showing major milestones for Handelsbanken, including restructures and financial crises, with a large image of a bank building, text annotations detailing each phase.
Strategic Planning
Financial Services
Chronicles the history and significant events in the development of Handelsbanken, emphasizing its stability and resilience through financial crises. Useful for corporate presentations and history lessons on banking.
Handelsbanken, banking, history, financial stability, crises, corporate resilience, timeline
Linear Flow
Bain
Saved
Features a column chart comparing cost base targets from 2022 to 2025 and bullet points summarizing key actions executed and priorities for 2023.
Operational Efficiency
Financial Services
Summarizes cost reduction measures taken in 4Q22 and outlines priorities for 2023 to maintain expense discipline and operational efficiency.
cost transformation, expense reduction, priorities, operational efficiency, financial targets
Mixed Chart
Credit Suisse
Saved
Slide shows column charts comparing GDP, IT & Business Services, and Accenture's CAGR across different fiscal years, using shades of purple.
Financial Performance
Technology & Software
This slide illustrates Accenture’s growth compared to general economic indicators like GDP and sector-specific growth in IT and Business Services, highlighting the company's strong market performance.
growth, GDP, IT, services, CAGR, Accenture, market performance, economic, sector-specific, comparison
Multiple Chart
Accenture
Saved
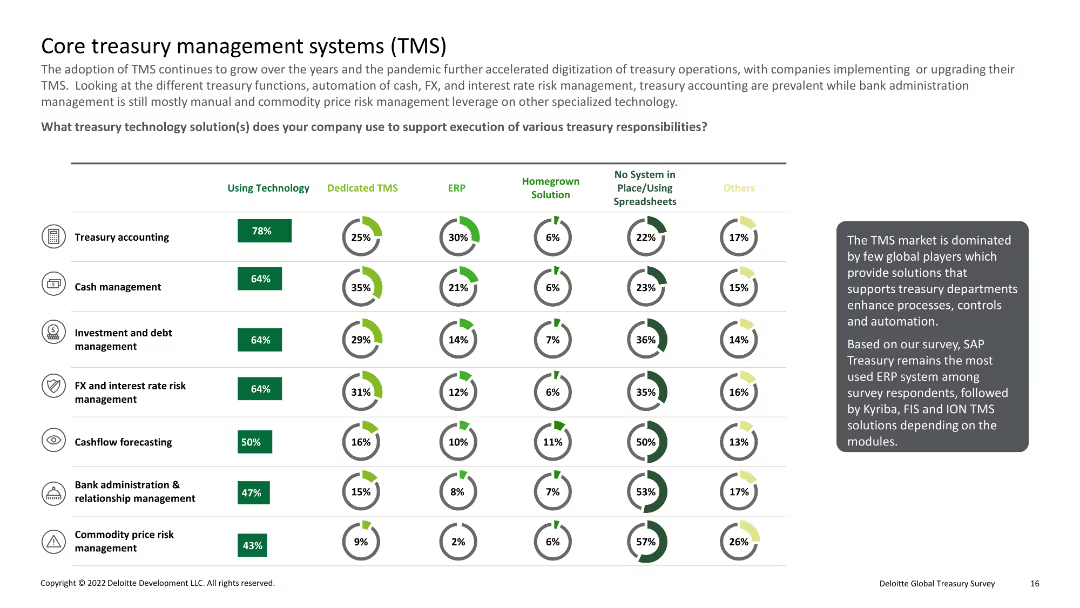
Column charts and pie charts showing usage of various treasury technology solutions such as TMS, ERP, and spreadsheets
Technology and Digital Transformation
Financial Services
Explains the adoption and use of treasury management systems (TMS) and other technologies in different treasury functions.
TMS, ERP, technology, treasury, solutions
Multiple Chart
Deloitte
Saved
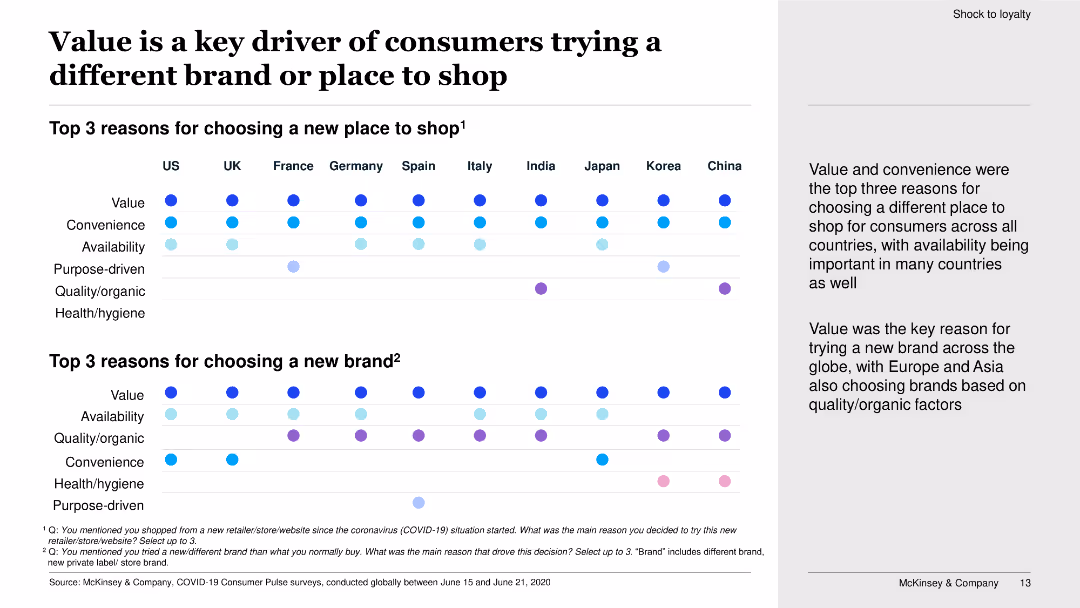
This slide features dot plots showing the top three reasons for choosing a new place to shop and a new brand in various countries.
Market Analysis and Trends
Retail & E-commerce
The slide explores the key reasons consumers choose different brands or places to shop, with value and convenience being primary factors across multiple countries.
value, convenience, new brand, new place to shop, consumer choice, dot plots, survey, shopping behavior
Boxed
McKinsey
Saved
Includes a pie chart showing the distribution of holiday shopping spend across different categories.
Market Analysis and Trends
Retail & E-commerce
Examines the average holiday spending per household, highlighting the significant portion allocated to experiences such as socializing and entertaining at home.
holiday, spending, experiences, socializing, categories, gifts
Single Chart
Deloitte
Saved
The slide displays a column chart showing the growth in digital consumption in India from 2019 to 2022, including television, digital video, and other media types. It also compares pay TV households and OTT SVoD subscriber growth in India, the US, and China.
Market Analysis and Trends
Media & Entertainment
This slide highlights the rapid growth of digital content consumption in India, driven by increases in television and digital video usage. It compares India's trends with those in the US and China, emphasizing India's entertainment market potential.
India, Entertainment, Digital Consumption, Television, OTT
Multiple Chart
BCG
Saved
Features icons and bullet points detailing specific AI investment areas and their impacts.
Strategic Planning
Technology & Software
Outlines how AI has been strategically utilized across various industries to optimize operations and enhance customer interactions.
AI Investment, Industry Optimization, Strategic Utilization, Customer Interaction, Operational Efficiency, AI Benefits
Table
BCG
Saved
Several column charts are used to demonstrate current trends and forecasts in digital financial services, with a focus on payments and investments.
Risk Assessment and Management
Financial Services
It offers a forward-looking analysis of digital financial services, predicting sustained growth and highlighting lending and remittance as key areas.
digital services, growth forecast, lending, remittance, investment trends, financial analysis
Multiple Chart
Bain
Saved
A detailed step-by-step diagram explaining the 7-step strategic sourcing process, with annotations for each step.
Strategic Planning
Professional Services
Illustrates how the Purchasing Chessboard® is applied in strategic sourcing projects, providing a structured process overview.
Purchasing Chessboard, strategic sourcing, process, steps, procurement, planning, structured process, annotations
Linear Flow
Kearney
Saved
Features a stepwise flowchart detailing the stages from assessment to sustainable improvement, clearly labeled for easy understanding.
Investment Analysis
Professional Services
Discusses the phased approach of A&M's Rapid Results service, focusing on quick implementation and long-term EBITDA improvements, structured in a clear step-by-step format.
Rapid, Results, EBITDA, Improvement, Approach
Table
Alvarez & Marsal
Saved
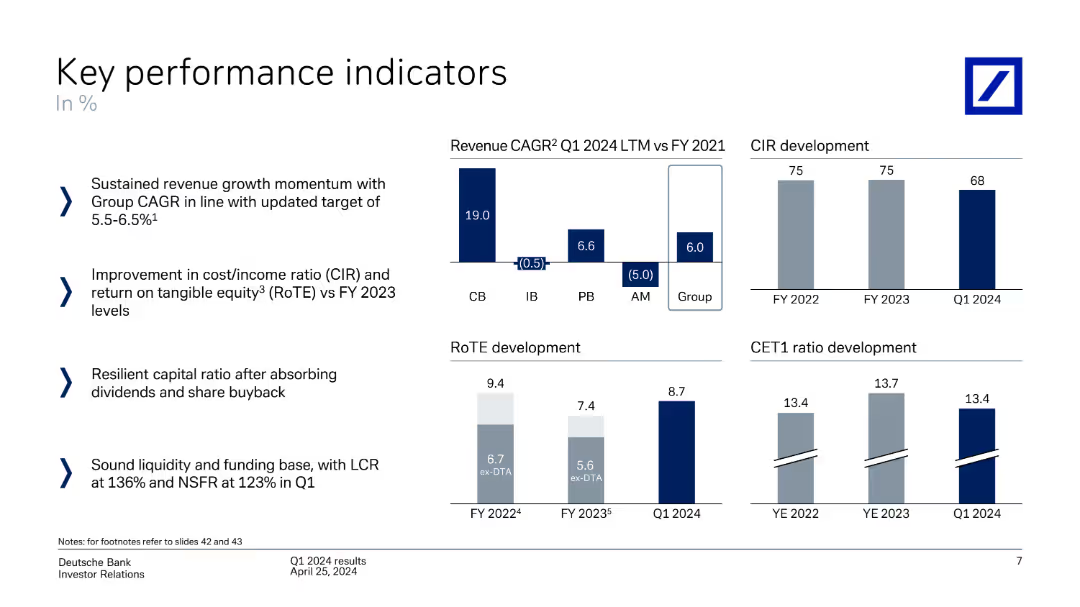
The slide presents several column charts comparing KPIs like revenue CAGR, CIR development, RoTE development, and CET1 ratio development across fiscal years and quarters.
Performance Metrics and KPIs
Financial Services
It highlights key performance indicators for Deutsche Bank, focusing on revenue growth, cost/income ratio, return on equity, and CET1 ratio over time.
key performance indicators, revenue CAGR, CIR, RoTE, CET1 ratio, Deutsche Bank, performance analysis
Multiple Chart
Deutsche Bank
Saved
The slide covers competition and advantages of Australia in FinTech through infographics and charts showing international competitiveness and revenue growth percentages.
Strategic Planning
Financial Services
The slide discusses the optimistic outlook for Australian FinTech, highlighting competitive advantages and significant revenue growth, alongside a comparison of local and international competition.
FinTech, outlook, optimism, competition, revenue growth, Australia
Mixed Chart
EY
Saved
The slide includes a horizontal bar chart listing various global issues that worry people the most, with percentages for each concern such as COVID-19, unemployment, and poverty.
Market Analysis and Trends
Environmental Services & Sustainability
This slide shows data from the Ipsos Global Advisor survey highlighting the top issues that worry people around the world, with increasing concern about climate change mentioned.
global concerns, COVID-19, unemployment, poverty, climate change, global survey, Ipsos, 2021, bar chart, percentages
Mixed Chart
IPSOS
Saved
Uses a clear, organized format with numbered sections, bullet points, and descriptive paragraphs, along with minimal iconography.
Strategic Planning
Financial Services
Outlines strategic priorities such as customer engagement, leveraging technology, risk management, talent cultivation, and financial performance.
strategy, customer engagement, technology, risk management, talent cultivation, financial performance, strategic priorities
Table
JP Morgan
Saved
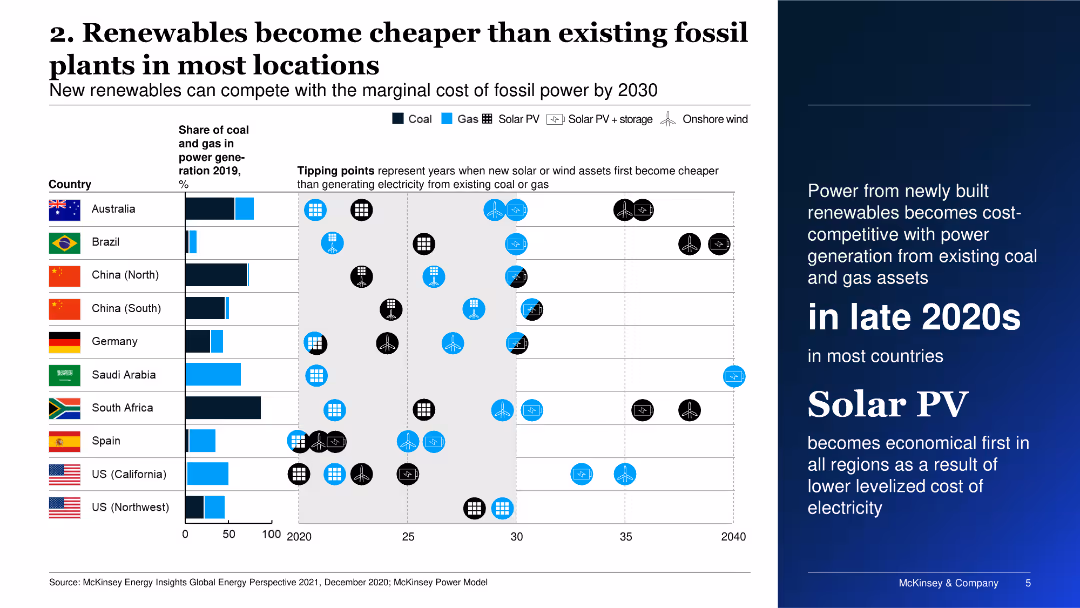
The slide includes a bar chart showing the break-even production cost of clean hydrogen versus incumbent technology across various sectors.
Technology and Digital Transformation
Energy & Utilities
The slide evaluates the cost-competitiveness of clean hydrogen in different sectors, emphasizing the potential for hydrogen to become competitive by 2030.
clean hydrogen, cost-competitive, sectors, 2030, energy
Mixed Chart
McKinsey
Saved
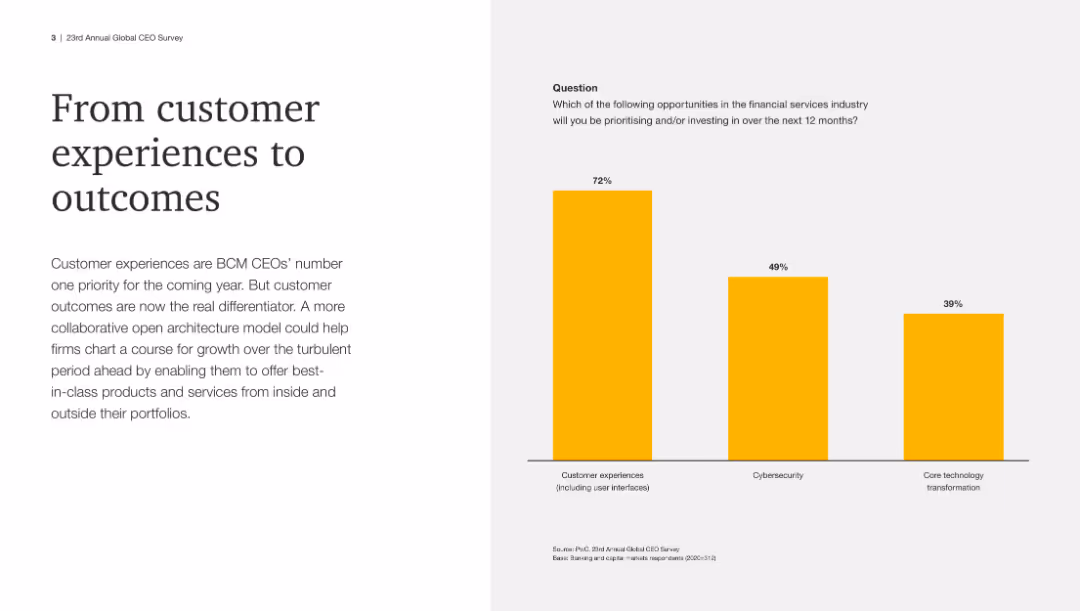
The slide contains text discussing the effectiveness of spending less than competitors, accompanied by a doughnut chart on the right. The chart compares the percentage of entrants, finalists, and winners who spend less than their competition.
Financial Performance
Media & Entertainment
This slide argues that spending less than competitors can be an effective strategy, supported by data showing the proportion of entrants, finalists, and winners who adopt this approach.
spending strategy, competition, cost efficiency, doughnut chart, marketing
Mixed Chart
IPSOS
Saved
A global map highlighted in purple shades with yield percentages for various countries prominently displayed, facilitates a geographical comparison of equity yields.
Market Analysis and Trends
Financial Services
This visual slide displays global equity yields, simplifying the comparison of investment returns across countries, which can guide international investment strategies.
global, equity yields, investment returns, geographical comparison, countries, map, strategy, finance
Graphic
Morgan Stanley
Saved
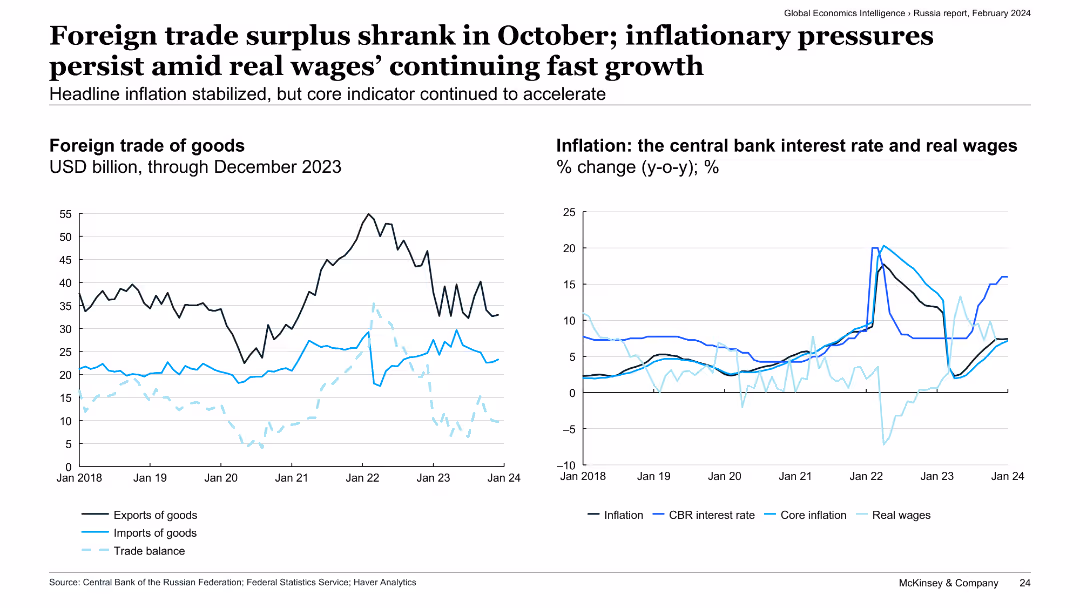
The slide includes two line charts: the left chart shows the foreign trade of goods in USD billion, while the right chart depicts the central bank interest rate, real wages, and inflation rates in Russia.
Market Analysis and Trends
Transportation & Logistics
The slide examines the shrinkage of Russia's foreign trade surplus in October, ongoing inflationary pressures, and real wage growth. It provides insights into economic conditions and policy responses in Russia.
foreign trade, surplus, inflation, real wages, economic conditions
Multiple Chart
McKinsey
Saved
This slide includes a table displaying compliance review results over several years. It includes percentages for compliant, non-compliant, and those requiring improvement, accompanied by a brief description of the audit process and results.
Client Case Studies
Professional Services
The slide reviews the compliance status of audit engagements, showing improvement trends and emphasizing PwC's commitment to audit quality and adherence to regulatory standards.
Compliance, audit, regulatory standards, engagement reviews, audit quality
Mixed Chart
PwC/Strategy&
Saved
The slide includes a bar chart illustrating the evolution of the oil and gas portfolio (illustrative) from 2022 to 2050. Segments include Synthetic Fuels, Hydrogen and Ammonia, Biofuels and Biogas, Renewable Power, Natural with CCUS offsets, and Crude Oil with CCUS offsets.
Strategic Planning
Energy & Utilities
This slide presents an illustrative forecast of the future energy portfolio of major oil and gas companies, showing a shift towards renewable and decarbonized energy sources by 2050. It emphasizes the diversification of energy sources to meet energy transition goals.
Oil, Gas, Portfolio, Evolution, Renewable, 2050, Decarbonization
Mixed Chart
EY
Saved
The slide shows a timeline with achievements for Q3 2023, key priorities for Q4 2023, and milestones for 2024.
Strategic Planning
Financial Services
This slide details the integration planning and execution process, highlighting achievements and future milestones.
integration planning, execution, key priorities, milestones, strategic plan
Header Horizontal
UBS
Saved
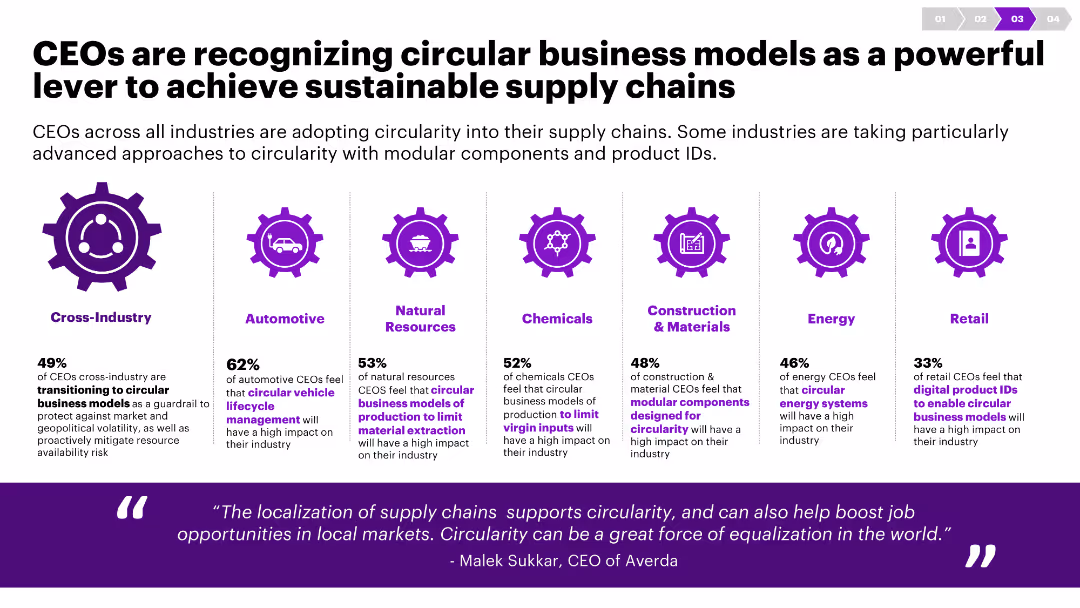
The slide uses icons and column charts to show data on the adoption of circular business models across various industries. It has a clean, balanced layout.
Strategic Planning
Environmental Services & Sustainability
This slide discusses how CEOs from different industries are integrating circular business models into their supply chains to enhance sustainability.
Circularity, CEOs, supply chain, sustainability, industry, business models, modular components, product IDs, transition, approach
Pillar
Accenture
Saved
Slide depicting the number of jobs supported by Ford USA, with a bar graph and a worker assembling a vehicle in the background.
Human Resources and Talent Management
Transportation & Logistics
This slide quantifies the impact of Ford USA on job creation, illustrating the multiplier effect of Ford employment on the broader economy.
Ford, employment, multiplier effect, American jobs, automotive industry, manufacturing, dealers, community impact
Single Chart
BCG
Saved
Previous
Next
If nothing, comes up, please save your slides first
Create a FREE account to continue browsing
Receive Instant Access to 1,000+ slides from companies like McKinsey, Google, and Goldman Sachs
First Name
Last Name
Email
Password
I agree to all
Terms & Privacy Policy
Thank you! Your submission has been received!
Oops! Something went wrong while submitting the form.
Have an account?
Sign in
Column Chart
Heatmap
Chevron
Org Chart
Infographic
Callouts
Timeline
List
Graphic
Picture
Process Flow
Diagram
Paragraph
Map
Table
Framework
Subtitle
Takeaway Box
Icon
Other Chart
Radar Chart
Waterfall Chart
Mekko Chart
Pie Chart
Scatter Plot
Line Chart
Bar chart
Bullet points