My Account
My Slides
Search by Category
Templates
Leave Feedback
Login
Logout
Get Started
Browse all Slides
Browse all Slides
Create a FREE Account
Instant access to 1,000+ real slides from top companies like McKinsey, BCG, Goldman Sachs, Google and many more!
First Name
Last Name
Email
Password
I agree to all
Terms & Privacy Policy
Thank you! Your submission has been received!
Oops! Something went wrong while submitting the form.
Have an account?
Sign in
Saved Slides
A world map highlighting regions with varying colors, pie charts detailing product types sold, and textual information about sales, margins, and operations.
Industry Overview
Consumer Goods
Outlines the sales distribution and product focus within the Asia, Oceania, and Africa regions, providing insights into market segmentation and operational scale. Helpful for regional strategic planning and resource allocation.
regional sales, market segmentation, operational scale, strategic planning, Nestlé
Multiple Chart
Deutsche Bank
Saved
Three columns aligned left to right showing 'Secular Forces', 'Impact', and 'Opportunities' with related bullet points in blue boxes.
Market Analysis and Trends
Financial Services
Analyzing market opportunities arising from changes such as regulation, technology, and competitive dynamics, and their impacts and opportunities.
Secular Change, Regulatory Changes, Technology, Market Opportunities, Risk Intermediation, Client Financing, Client Experience
Linear Flow
Goldman Sachs
Saved
The slide contains three charts. The top left line chart shows inflation and wage growth. The top right line chart shows nominal GDP. The bottom right line chart shows interest rate expectations based on 5y5y swaps.
Market Analysis and Trends
Financial Services
This slide examines Japan's economic indicators, including inflation, wage growth, nominal GDP, and interest rate expectations.
Inflation, Growth, Japan, GDP, Interest Rates
Multiple Chart
JP Morgan
Saved
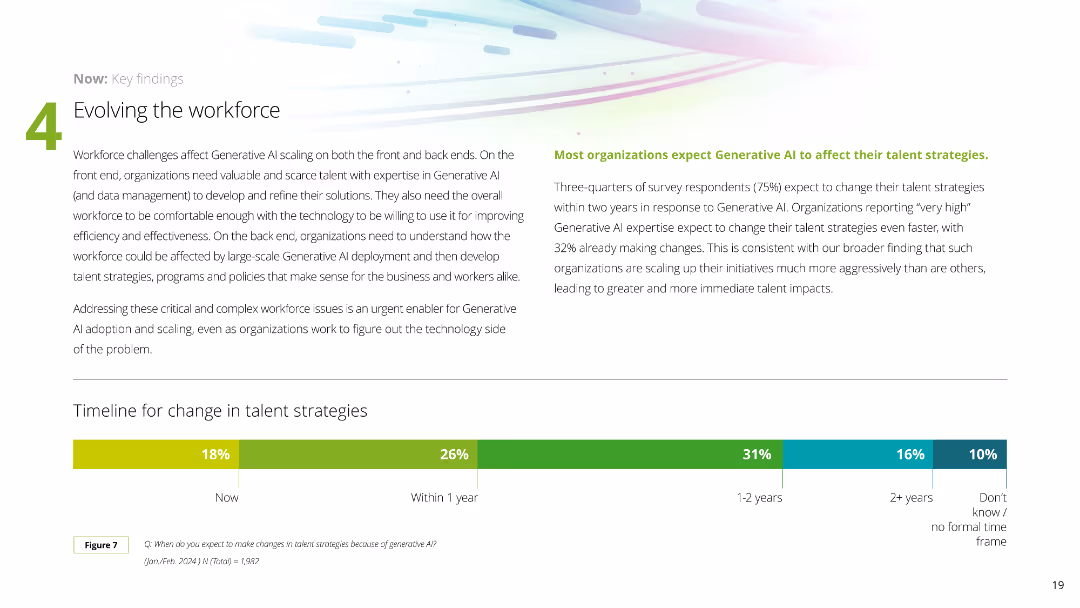
This slide features a timeline chart and supporting text to explain how workforce strategies are evolving in response to Generative AI. The design uses a clean layout with color-coded sections to indicate time frames for changes.
Human Resources and Talent Management
Technology & Software
It discusses how organizations are evolving their workforce strategies to address the challenges posed by Generative AI adoption, highlighting expected changes in talent strategies within various time frames.
workforce, AI, strategy, evolution, timeline
Mixed Chart
Deloitte
Saved
Includes stacked column chart illustrating capital ratios against regulatory requirements with detailed annotations explaining the data points.
Regulatory and Compliance
Financial Services
Provides a detailed review of capital ratios like CET1, AT1, and T2, showing how they stand against regulatory requirements at the end of Q4 2023. It focuses on the bank's financial health and capital strategy, ensuring compliance and buffer maintenance above the minimum required levels.
Capital Ratios, Regulatory Compliance, Financial Health, Banking, Capital Strategy
Mixed Chart
Deutsche Bank
Saved
This slide presents a complex layout with a mix of text boxes, icons, and background images, highlighting key mergers and acquisitions (M&A) activities and their strategic importance. It includes timeline elements and bullet-point lists to describe major deals and steps within the company's strategy. The slide has the Michelin logo and uses the company's color scheme.
Strategic Planning
Industrial & Manufacturing
This slide reviews major M&A activities and strategic steps taken by Michelin, focusing on enhancing its portfolio in line with the "Michelin in Motion 2030 strategy." It is likely used in strategic business meetings or investor relations presentations to discuss company growth and strategic direction.
M&A, strategy, Michelin, portfolio, deals, innovation, acquisition, growth, planning, management
Pillar
Morgan Stanley
Saved
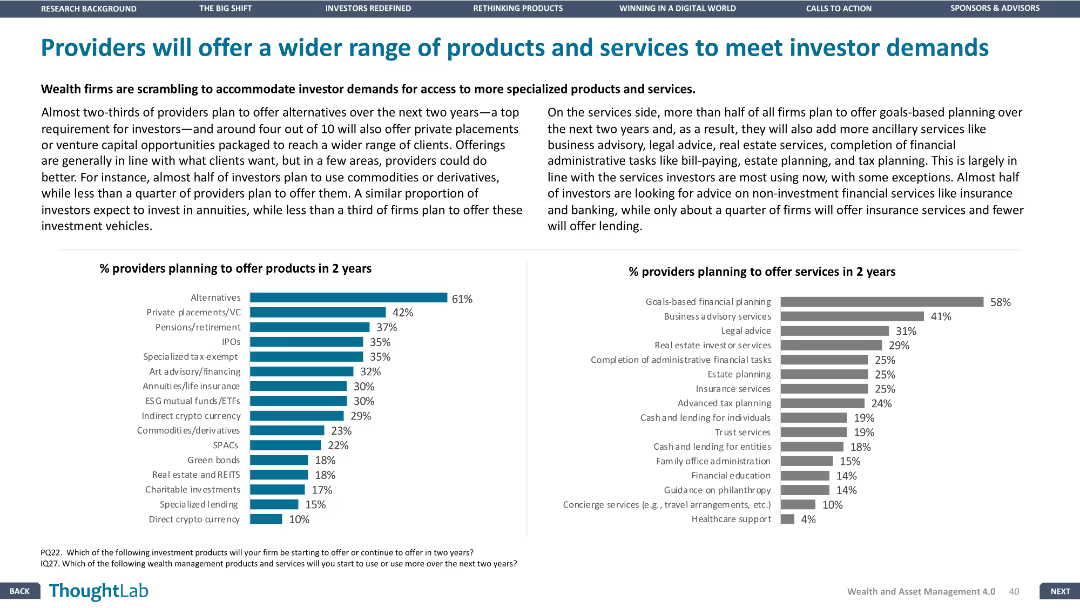
Column charts showing percentage of providers planning to offer new products and services in the next two years. Design is balanced, with clear data visualization.
Product and Service Analysis
Financial Services
Details plans of wealth firms to offer a broader range of products and services, with emphasis on specialized products and ancillary services to meet investor demands.
products, services, providers, investor, demands
Multiple Chart
Deloitte
Saved
Complex heat maps for yearly asset class returns, color-coded, with a key at the bottom. High data density with multiple time series.
Investment Analysis
Financial Services
Analysis of yearly performance of various asset classes, indicating potential investment decisions. Suitable for financial analysts or investors looking at market trends.
Performance, Assets, Heat Map, Financial, Analysis, Investment, Trends, Color-coded, Yearly, Data
Table
Morgan Stanley
Saved
Slide includes textual content with adjacent column chart comparing attitudes by age and location
Technology and Digital Transformation
Financial Services
Highlights variations in AI adoption attitudes across different generations and geographical locations.
AI adoption, generational differences, geographical differences, financial services
Mixed Chart
Deloitte
Saved
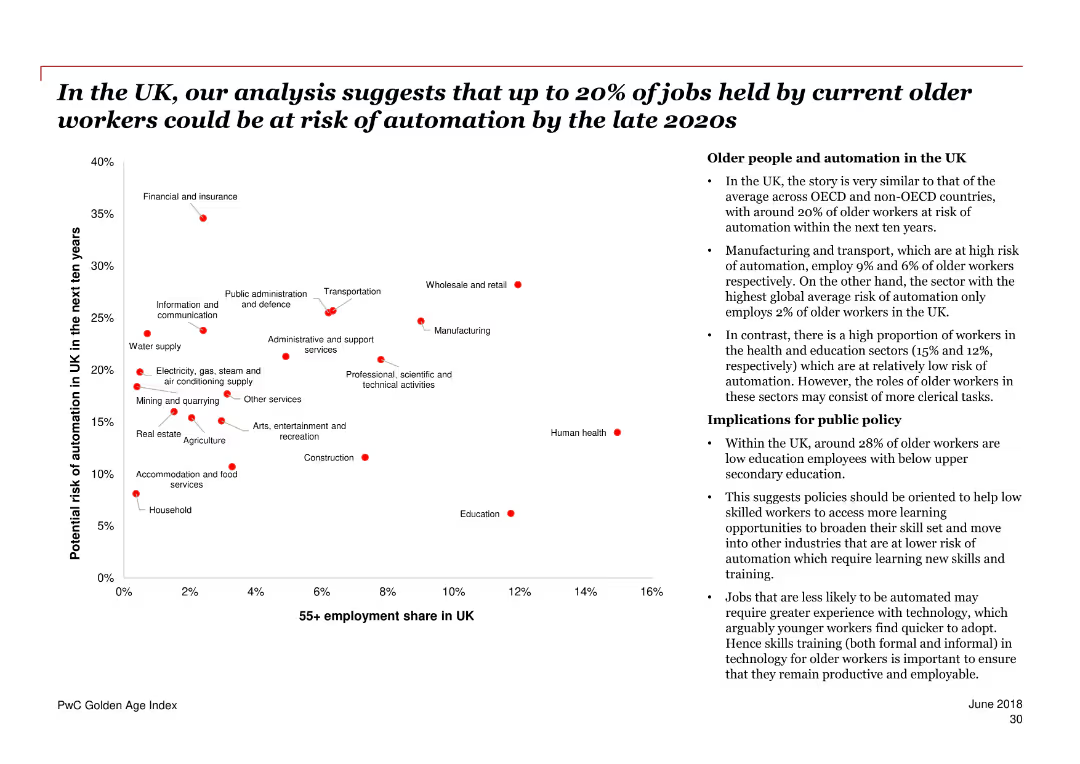
The slide features a scatter plot chart showing the potential risk of automation for older workers in various industries in the UK over the next ten years. A section of bullet points on the right provides additional context and implications.
Risk Assessment and Management
Government & Public Sector
The slide discusses the potential automation risk faced by older workers in the UK, with specific industry data and public policy implications. It highlights the proportion of older workers and their risk levels across different sectors.
automation, older workers, UK, risk, industries, public policy, employment, sectors, implications
Mixed Chart
PwC/Strategy&
Saved
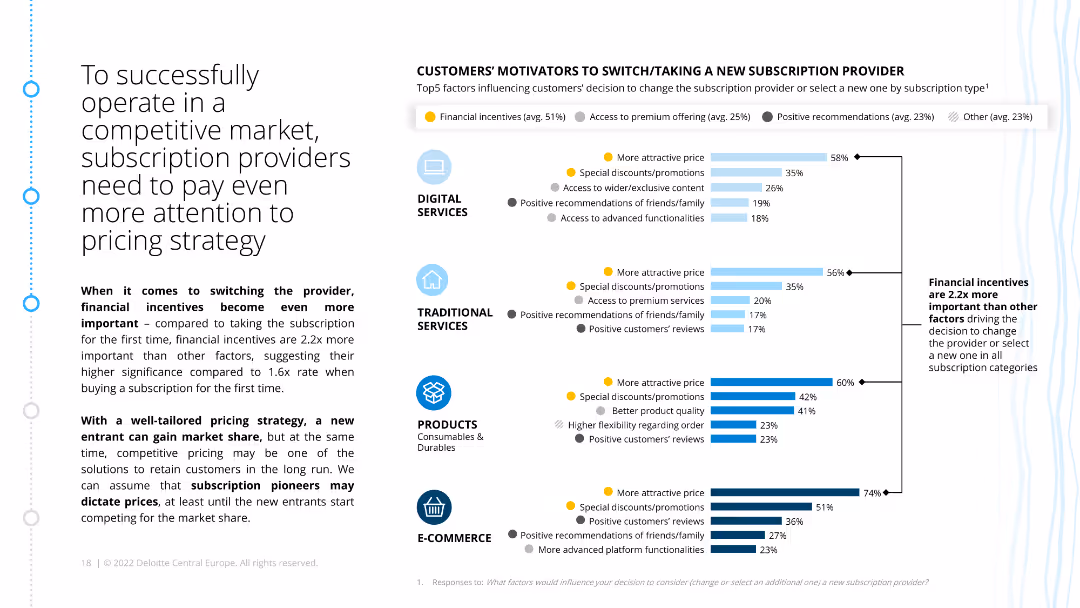
The slide has a column chart listing the top motivators for customers to switch subscription providers, categorized by type. It emphasizes financial incentives and their significance compared to other factors.
Market Analysis and Trends
Consumer Goods
This slide discusses the importance of pricing strategies for subscription providers in competitive markets. It details how financial incentives are crucial in influencing customer decisions to switch providers.
pricing strategy, financial incentives, competitive market, customer motivators, subscription providers, ecommerce, retail
Multiple Chart
Deloitte
Saved
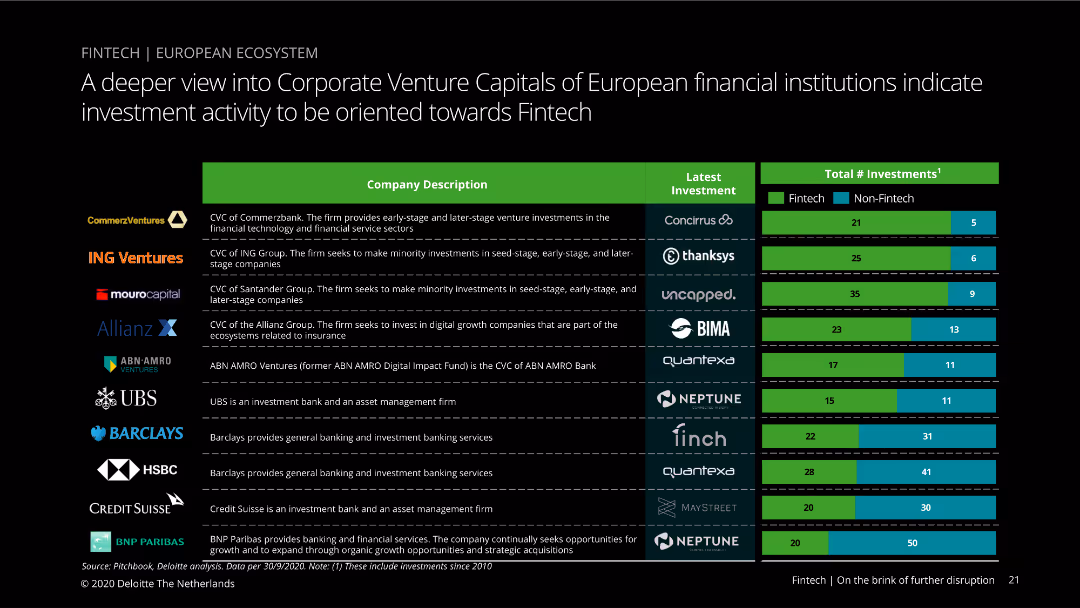
The slide shows a table with company descriptions, latest investments, and total number of investments divided into fintech and non-fintech categories. Visual complexity is moderate, with a clear color scheme and organized data presentation.
Investment Analysis
Financial Services
This slide provides insights into the venture capital investments by European financial institutions, focusing on the fintech sector. It compares the number of fintech versus non-fintech investments made by each institution.
Venture capital, investments, fintech, financial institutions, Europe
Mixed Chart
Deloitte
Saved
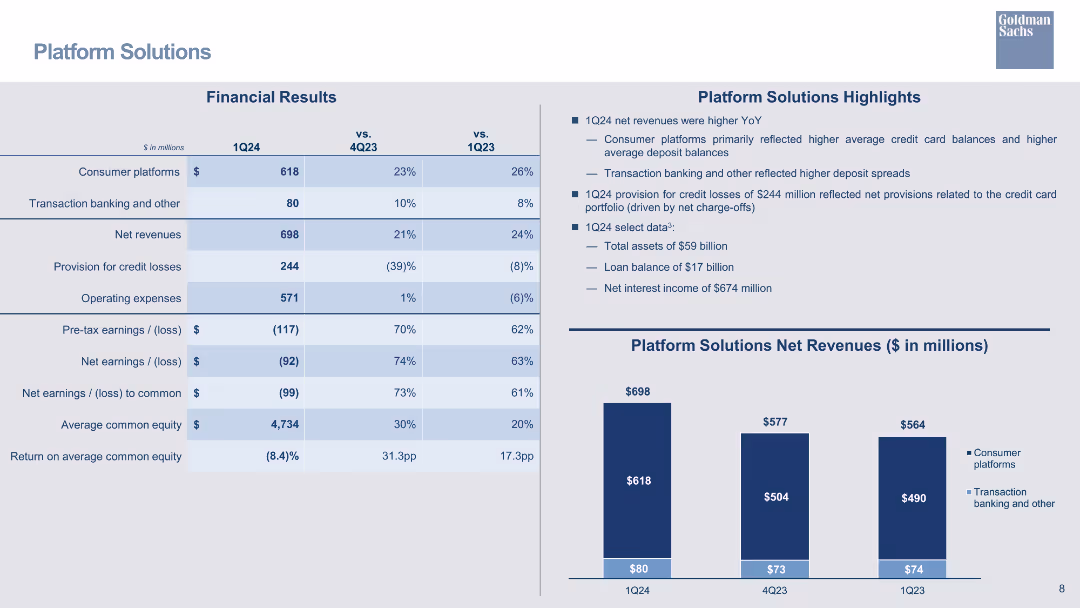
A table summarizing financial results for the Platform Solutions segment, including net revenues, operating expenses, and earnings, with bar charts.
Financial Performance
Financial Services
Reviews financial results for Platform Solutions, focusing on net revenues, credit losses, and net interest income.
platform solutions, financial results, net revenue, credit losses, operating expenses, bar chart
Mixed Chart
Goldman Sachs
Saved
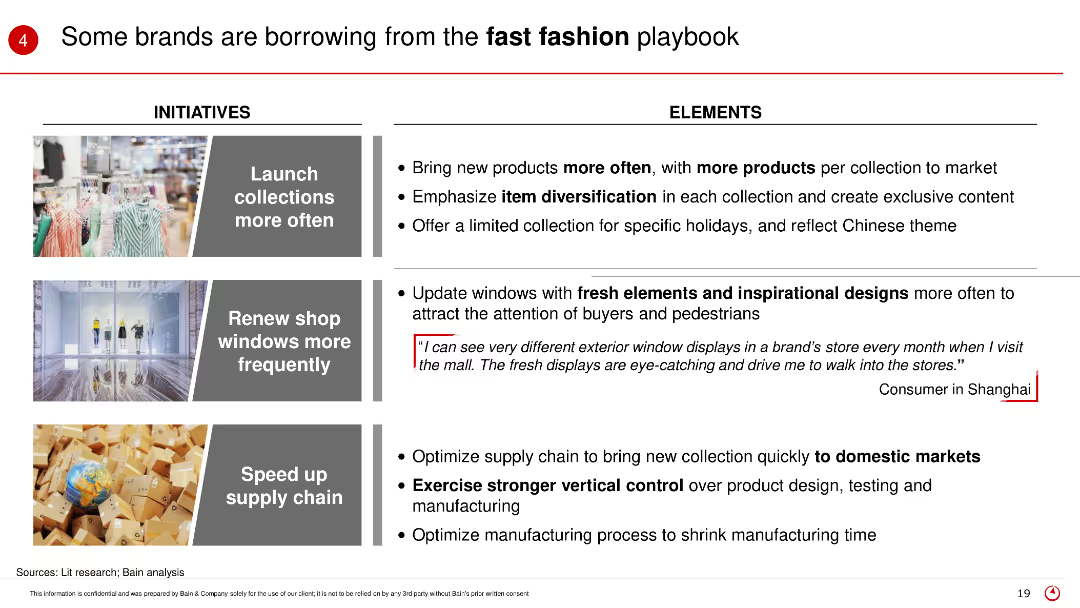
The slide presents initiatives and elements of the fast fashion strategy, including launching collections more often, updating shop windows, and speeding up supply chains, with corresponding images and consumer feedback.
Product and Service Analysis
Retail & E-commerce
This slide describes how some brands are adopting fast fashion tactics to remain competitive, focusing on frequent product launches, fresh window displays, and efficient supply chains.
Fast fashion, brand strategy, product launch, supply chain, retail trends
Table
Bain
Saved
Column chart showing the percentage of consumers who research content online before watching, across OTT, movie studios, and LTV.
Customer and Market Segmentation
Media & Entertainment
This slide presents data on consumer behavior, indicating that over 60% of consumers research content online before deciding to watch, with digital touchpoints.
consumers, research, content, digital, touchpoints
Mixed Chart
BCG
Saved
Utilizes bar charts to display projected vaccine production capacities by various manufacturers, highlighting planned figures for end-2020 and end-2021.
Regulatory and Compliance
Healthcare & Pharmaceuticals
Evaluates the global vaccine production capabilities and strategies, with emphasis on scaling up to meet anticipated demand.
vaccine, manufacturing, scale-up, capacity
Mixed Chart
BCG
Saved
Features a multi-line chart depicting responses on strategic intent for D&I, with specific focus differences by region and demographic, annotated for clarity.
Strategic Planning
Professional Services
Focuses on the perceptions of U.S. non-minority women regarding strategic intent in D&I, suggesting areas for improvement.
D&I, strategic intent, U.S., non-minority women, line chart, improvement areas, demographic focus
Mixed Chart
Accenture
Saved
The slide shows a vertical bar chart comparing the percentage of people agreeing with the statement about the importance of the internet across various countries.
Market Analysis and Trends
Technology & Software
The slide highlights global survey results indicating a widespread recognition of the importance of the internet in people's lives.
Internet, technology, global survey, public opinion, internet importance
Multiple Chart
IPSOS
Saved
Features a world map with export impacts and column charts detailing grain trade forecasts, focusing on geographic and quarterly variations.
Market Analysis and Trends
Transportation & Logistics
Discusses global grain trade dynamics influenced by geopolitical and environmental factors, with detailed forecasts and regional analysis.
grain trade, global market, export forecasts, geopolitical impact, environmental factors
Multiple Chart
Deutsche Bank
Saved
Circular flow diagram centralizing the key criteria for blockchain application, such as distributed ledger and economic benefits, each represented with an icon and brief description, set against a clean background.
Strategic Planning
Technology & Software
Discusses the critical considerations for applying blockchain technology, focusing on aspects like economic benefits and trust absence. Useful for strategic discussions on where blockchain can be effectively implemented.
blockchain, criteria, application, distributed ledger, trust
Linear Flow
McKinsey
Saved
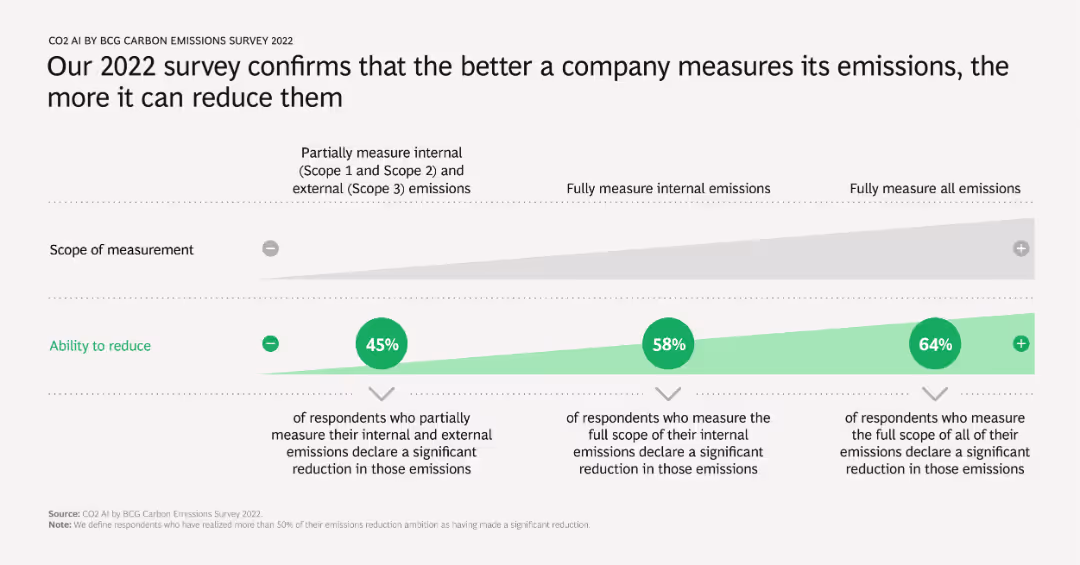
A column chart showing the correlation between the scope of emissions measurement and the ability to reduce emissions. It includes percentages of respondents who measure emissions to varying extents and their reported emission reductions.
Operational Efficiency
Environmental Services & Sustainability
Demonstrates that companies which comprehensively measure their emissions tend to achieve more significant reductions. Highlights the importance of thorough emissions tracking in achieving meaningful environmental impact.
emissions measurement, reduction, operational efficiency, scope, survey results
Table
BCG
Saved
Includes a mix of tables and bar charts comparing financial performance metrics across divisions, focusing on revenues and costs.
Financial Performance
Financial Services
Analyzes the financial outcomes for Deutsche Bank's Investment Banking division, highlighting key changes in revenue streams and cost management strategies.
investment banking, financial results, revenue, costs, performance analysis
Mixed Chart
Deutsche Bank
Saved
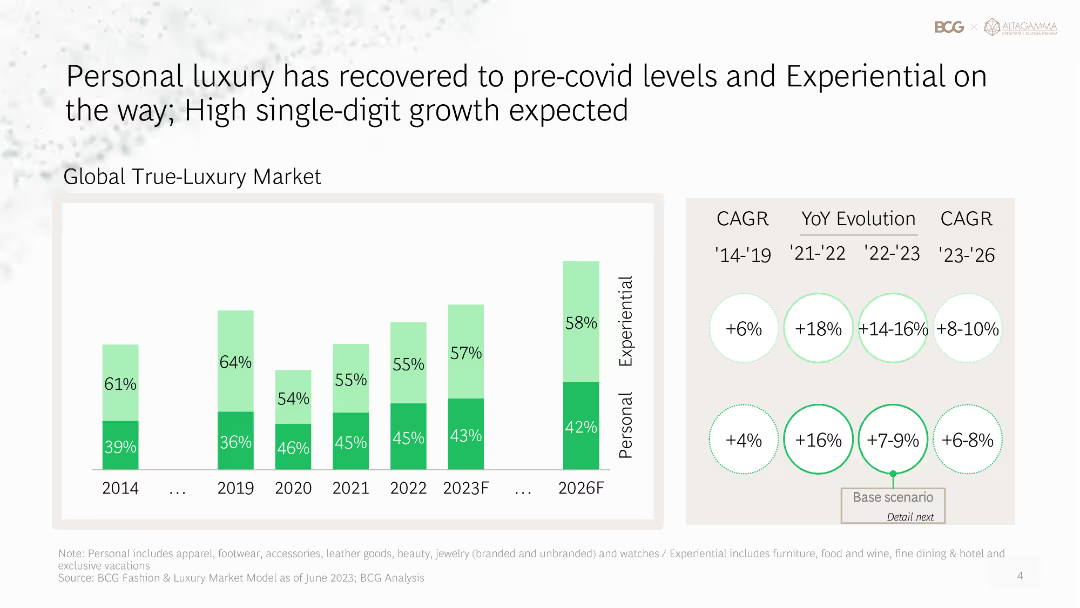
Column chart showing the recovery of the personal luxury market to pre-COVID levels, with projections for future growth in both personal and experiential categories.
Market Analysis and Trends
Consumer Goods
Analyzes the recovery of the personal luxury market post-COVID, providing growth projections for both personal and experiential luxury segments.
personal luxury, market recovery, post-COVID, growth projections, experiential
Mixed Chart
BCG
Saved
This slide features a combination of column chart and descriptive analyses focusing on the performance of luxury dining, fine art, and hospitality industries during 2020. Detailed performance metrics are displayed alongside the charts.
Market Analysis and Trends
Consumer Goods
Assessing the disparate impacts of the pandemic on luxury markets, this slide contrasts the sectors that showed resilience with those that experienced steep declines. It specifically highlights how luxury dining, art, and hospitality have been affected, offering insights into recovery prospects and market adjustments.
market performance, luxury markets, pandemic impact, recovery prospects, industry analysis
Mixed Chart
Bain
Saved
The slide features a title in a red banner, text boxes with detailed content, and a column chart illustrating the use of public services by adults. The layout is dense and informative.
Strategic Planning
Government & Public Sector
The slide discusses the benefits of public-private collaboration in enhancing public service delivery. It outlines the stress public sector institutions face and the potential of collaboration to address socio-economic challenges.
public-private collaboration, public service, operational control, government, institutions
Mixed Chart
PwC/Strategy&
Saved
Previous
Next
If nothing, comes up, please save your slides first
Create a FREE account to continue browsing
Receive Instant Access to 1,000+ slides from companies like McKinsey, Google, and Goldman Sachs
First Name
Last Name
Email
Password
I agree to all
Terms & Privacy Policy
Thank you! Your submission has been received!
Oops! Something went wrong while submitting the form.
Have an account?
Sign in
Column Chart
Heatmap
Chevron
Org Chart
Infographic
Callouts
Timeline
List
Graphic
Picture
Process Flow
Diagram
Paragraph
Map
Table
Framework
Subtitle
Takeaway Box
Icon
Other Chart
Radar Chart
Waterfall Chart
Mekko Chart
Pie Chart
Scatter Plot
Line Chart
Bar chart
Bullet points