My Account
My Slides
Search by Category
Templates
Leave Feedback
Login
Logout
Get Started
Browse all Slides
Browse all Slides
Create a FREE Account
Instant access to 1,000+ real slides from top companies like McKinsey, BCG, Goldman Sachs, Google and many more!
First Name
Last Name
Email
Password
I agree to all
Terms & Privacy Policy
Thank you! Your submission has been received!
Oops! Something went wrong while submitting the form.
Have an account?
Sign in
Saved Slides
The slide includes a line chart showing the maturity curve of CO₂ transport and storage technologies. The chart has labeled points along the curve indicating different stages.
Technology and Digital Transformation
Energy & Utilities
It outlines the maturity stages of CO₂ transport and storage technologies, from research to mature technology, with specific points for shipping, pipeline, and truck/rail transport methods.
CO₂ transport, maturity curve, storage technologies, shipping, pipeline, truck, rail, energy, utilities
Single Chart
Kearney
Saved
Moderate visual complexity with text sections and graphic elements delineating the three key subsectors of industrial automation and their end-industries. The design integrates visuals and texts seamlessly, with a color code for each subsector.
Technology and Digital Transformation
Industrial & Manufacturing
This slide provides a segmented overview of the industrial automation sector, detailing the key subsectors and relevant end industries. It helps in understanding the broad categories within industrial automation and how they are applicable across different market segments.
Industrial automation, Subsectors, Market segmentation, End-industries
Diagram
LEK
Saved
Features a column chart comparing yearly revenue figures from 2020 to 2023 and textual achievements on the right. Dominant use of blue tones and structured layout for clarity.
Financial Performance
Financial Services
Showcases the bank's year-on-year revenue growth, emphasizing achievements like CAGR improvements and enhancements in client engagement and business acquisitions, reflecting effective strategic and operational execution.
revenue growth, financial performance, CAGR, business achievements, strategic success
Mixed Chart
Deutsche Bank
Saved
Detailed column charts and informational boxes outline sustainability finance volumes and key milestones, using green accents and icons for visual emphasis.
Regulatory and Compliance
Environmental Services & Sustainability
The slide highlights Q4 2023 sustainability achievements, including financial volumes and strategic initiatives.
sustainability, finance volumes, environmental impact, Q4 2023, achievements
Mixed Chart
Deutsche Bank
Saved
Contains multiple infographics and text blocks detailing the components of Barclays' payment systems, including partnerships and technological capabilities.
Operational Efficiency
Financial Services
This slide explains the structure of Barclays' payments ecosystem, emphasizing its market leadership and partnerships in SME and large corporate sectors, detailing services like card issuing and merchant acquiring.
payments, ecosystem, SME, corporate, partnerships
Table
Barclays
Saved
A column chart compares the spread analysis of various financial securities, including aggregates, MBS, ABS, CMBS, and more, over different time periods.
Market Analysis and Trends
Financial Services
The slide analyzes spread history and current spreads across various security types. Useful for understanding risk and return in bond markets.
spread analysis, bonds, financial securities, risk, return
Single Chart
Morgan Stanley
Saved
The slide provides a breakdown of preparers responsible for dining and hotel sales journal entries, with detailed tables showing percentage of activity by preparer.
Regulatory and Compliance
Financial Services
This slide details the number of preparers for dining and hotel sales, analyzing their activity percentages to identify any discrepancies or patterns that warrant further investigation.
journal entries, preparers, dining sales, hotel sales, financial oversight
Mixed Chart
EY
Saved
The slide includes column charts in purple, analyzing workload impacts on underwriters across different business lines.
Human Resources and Talent Management
Financial Services
Analyzes the impact of technology on underwriters' workload by business line and account size, using historical data.
workload, technology, underwriters, business line, data
Multiple Chart
Accenture
Saved
Column chart depicting changes in CET1 capital ratio from 2Q22 to 3Q22 with annotations for key factors.
Financial Performance
Financial Services
Analyzes the changes in CET1 capital ratio over a period, highlighting significant contributors and their impacts.
CET1 capital, equity, financial performance, UBS, 3Q22, leverage ratio, share buybacks, net profit
Mixed Chart
UBS
Saved
Organizational chart of the SUB divisional management committee and ExB of Credit Suisse with individual roles.
Organizational Structure and Change
Financial Services
Displays the management structure of Credit Suisse’s SUB division, detailing the roles and responsibilities of each executive member.
Organizational structure, management committee, SUB, Credit Suisse, executives
Diagram
Credit Suisse
Saved
Moderate visual complexity with iconography linking megatrends to new applications in process automation, and the technologies enabling these applications. The layout is well-organized, using colors and icons to differentiate between elements.
Technology and Digital Transformation
Industrial & Manufacturing
This slide connects global megatrends to their corresponding new process automation applications and the digital technologies that enable them. It aims to demonstrate how advancing technology responds to and leverages megatrends to innovate within process automation.
Megatrends, Automation applications, Digital technology, Innovation
Header Vertical
LEK
Saved
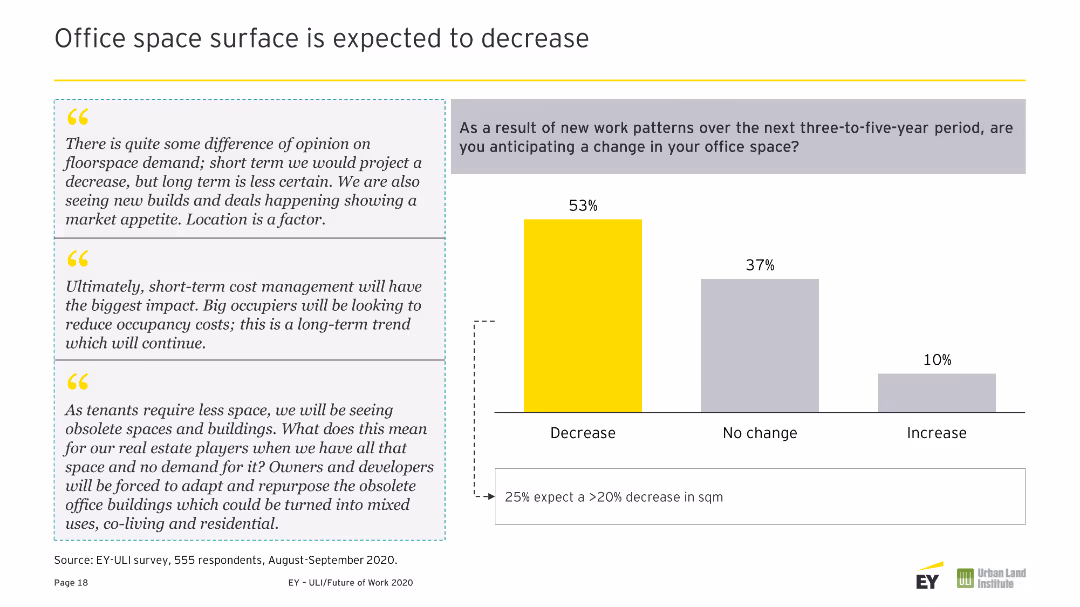
Column chart displaying changes expected in workspaces over the next three-to-five years. Contains three text quotes on the right in gray boxes. Colors used are yellow and gray.
Operational Efficiency
Real Estate & Construction
Predicts safer, healthier buildings with more collaboration spaces, advanced amenities, and services due to technological advancements and health-focused design.
Buildings, Safer, Healthier, Collaboration, Amenities, Services, Workspace, Changes, Future, Predictions
Mixed Chart
EY
Saved
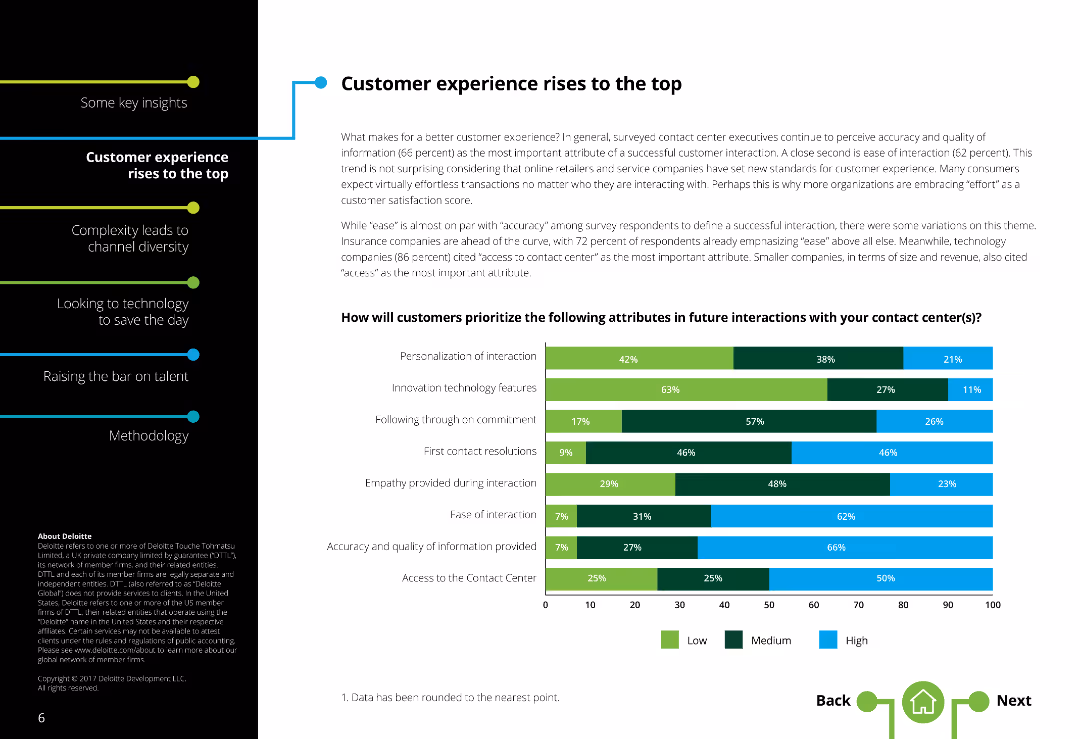
The slide has a two-column layout with text on the left and a horizontal bar chart on the right. There is moderate text density.
Market Analysis and Trends
Professional Services
The slide discusses the importance of customer experience in contact centers, highlighting attributes like ease, accuracy, and access.
Customer experience, Contact centers, Customer satisfaction, Service quality, Ease of interaction, Accuracy, Access, Personalization
Mixed Chart
Deloitte
Saved
Contains a process diagram of dark fermentation, supported by text descriptions of the biochemical reactions involved, along with pros, cons, and key feature estimates.
Technology and Digital Transformation
Energy & Utilities
Describes dark fermentation as a method of hydrogen production from organic matter, detailing the biochemical reactions, process steps, and advantages and disadvantages.
Hydrogen, dark fermentation, biochemical reactions, organic matter, production process
Diagram
Kearney
Saved
Line graph detailing quarterly podcast advertising revenue from Q1 2015 to Q4 2016, illustrating a steady increase. A compound quarterly growth rate (CQGR) is noted, showing the progression of growth.
Market Analysis and Trends
Media & Entertainment
Focuses on the detailed quarterly growth of podcast advertising revenue, highlighting consistent increases and providing a compound growth rate. Useful for detailed financial analysis and planning in media.
podcast, quarterly, revenue, CQGR
Single Chart
PwC/Strategy&
Saved
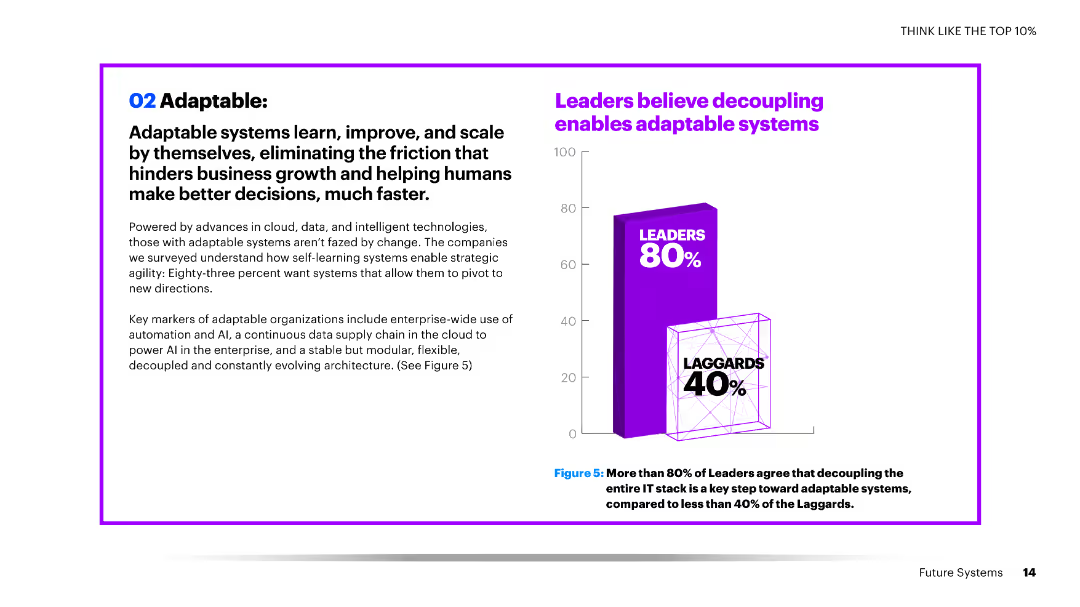
A slide with a large column chart showing the percentage of leaders and laggards who believe in the importance of decoupling IT systems for adaptability.
Technology and Digital Transformation
Technology & Software
The slide emphasizes the belief among leaders that decoupling IT systems is crucial for creating adaptable systems, which is less recognized among laggards, highlighting a key difference in strategic approaches.
decoupling, adaptable systems, leaders, laggards, IT systems, belief, importance, adaptability, strategy, approaches
Mixed Chart
Accenture
Saved
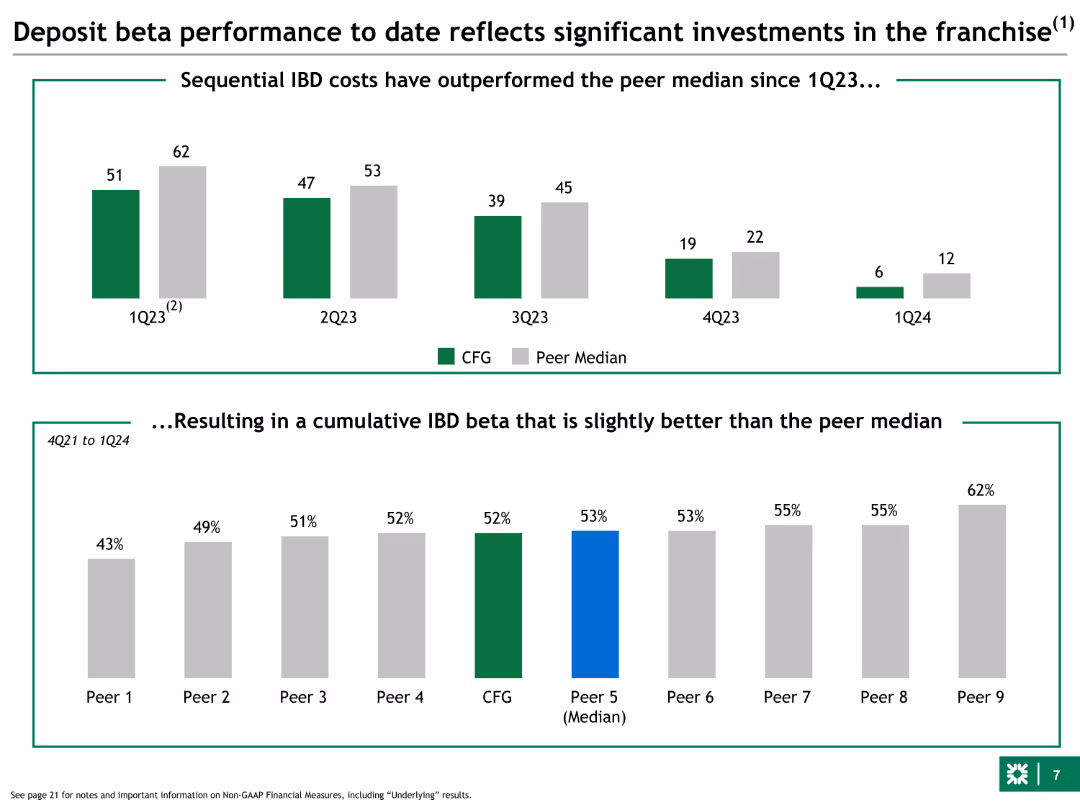
Column charts showing sequential IBD costs compared to peer median, and cumulative IBD beta. The slide uses green and grey colors for comparison.
Financial Performance
Financial Services
This slide shows the bank's deposit beta performance over time, comparing sequential costs with peers and demonstrating a cumulative beta slightly better than the median.
deposit, beta, performance, IBD, peer median
Multiple Chart
Barclays
Saved
Features line graphs contrasting S&P 500 and FAAMG revenues, and US healthcare vs autos spending.
Investment Analysis
Financial Services
Continuation from the previous slide, detailing revenue growth strategies, particularly within tech giants compared to the broader S&P 500 index.
FAAMG, revenue growth, S&P 500, healthcare spending, autos
Multiple Chart
Citigroup
Saved
The slide includes a main text section at the top, followed by two sets of data visuals. The left visual is a column chart showing the top concerns among Gen Zs, and the right visual for millennials.
Market Analysis and Trends
Consumer Goods
The slide highlights the top concerns for Gen Z and millennials, with cost of living being the primary issue. It includes survey data showing the percentages of respondents from both groups who are concerned about various issues like climate change and unemployment.
Gen Z, millennials, cost of living, survey, concerns
Multiple Chart
Deloitte
Saved
The slide includes icons on top of headers, describing major business and economic changes due to external factors.
Strategic Planning
Professional Services
Outlines various forces like metamorphosis of demand and altered workforce, impacting business strategies and operational resilience, with a focus on adapting to post-COVID realities.
Business, Strategy, COVID-19, Resilience, Adaptation
Pillar
McKinsey
Saved
A column chart showing expense trends over years with additional break-downs in investments, with a focus on blue tones.
Financial Performance
Financial Services
The slide tracks a company's expenses over time, highlighting investments and growth factors such as wage inflation.
expenses, investments, wage inflation, financial trend, operational efficiency
Single Chart
JP Morgan
Saved
A bar chart showing the percentage of companies planning to expand or establish operations in Europe, with an explanatory text box providing additional insights.
Strategic Planning
Financial Services
The slide discusses the priority of Europe for companies, indicating plans to establish or expand operations, and highlights the sectors with the highest expansion intentions.
investment, Europe, company plans, expansion
Mixed Chart
EY
Saved
Line chart and national flags illustrating expectations for a stronger economy in SEA.
Market Analysis and Trends
Financial Services
This slide indicates an upward trend in economic expectations among SEA respondents, highlighting future economic strength.
economy expectations, SEA, line chart, future, survey
Mixed Chart
IPSOS
Saved
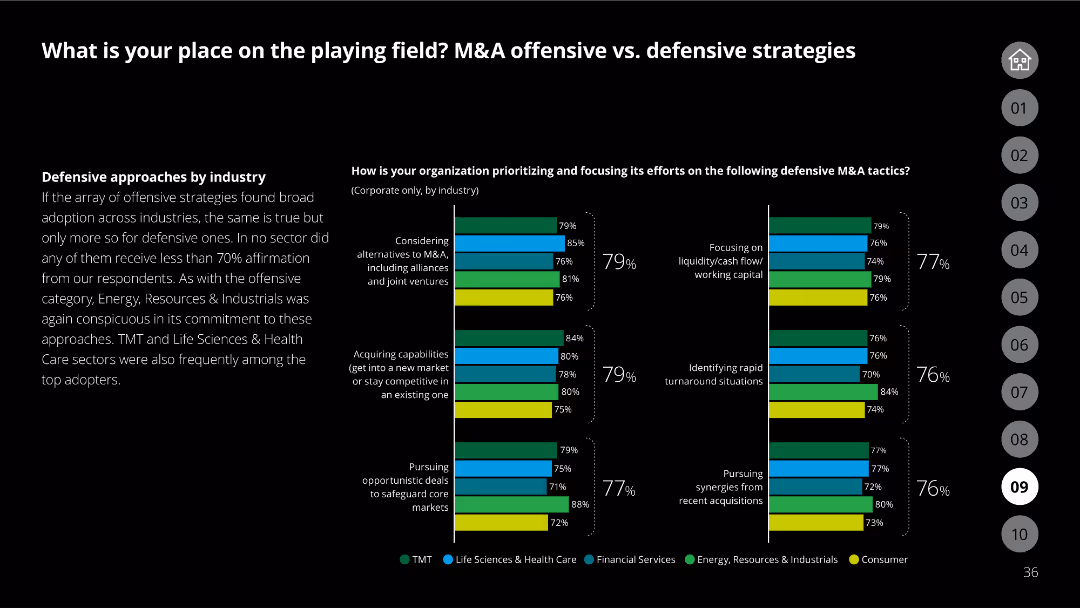
The slide contrasts offensive and defensive M&A strategies with bar charts showing how different industries prioritize various tactics, such as focusing on liquidity and acquiring capabilities.
Strategic Planning
Financial Services
Compares how different industries prioritize offensive and defensive M&A strategies, focusing on key tactics like liquidity management and acquiring new capabilities, supported by survey data.
offensive M&A, defensive M&A, industry comparison, survey data, strategies
Multiple Chart
Deloitte
Saved
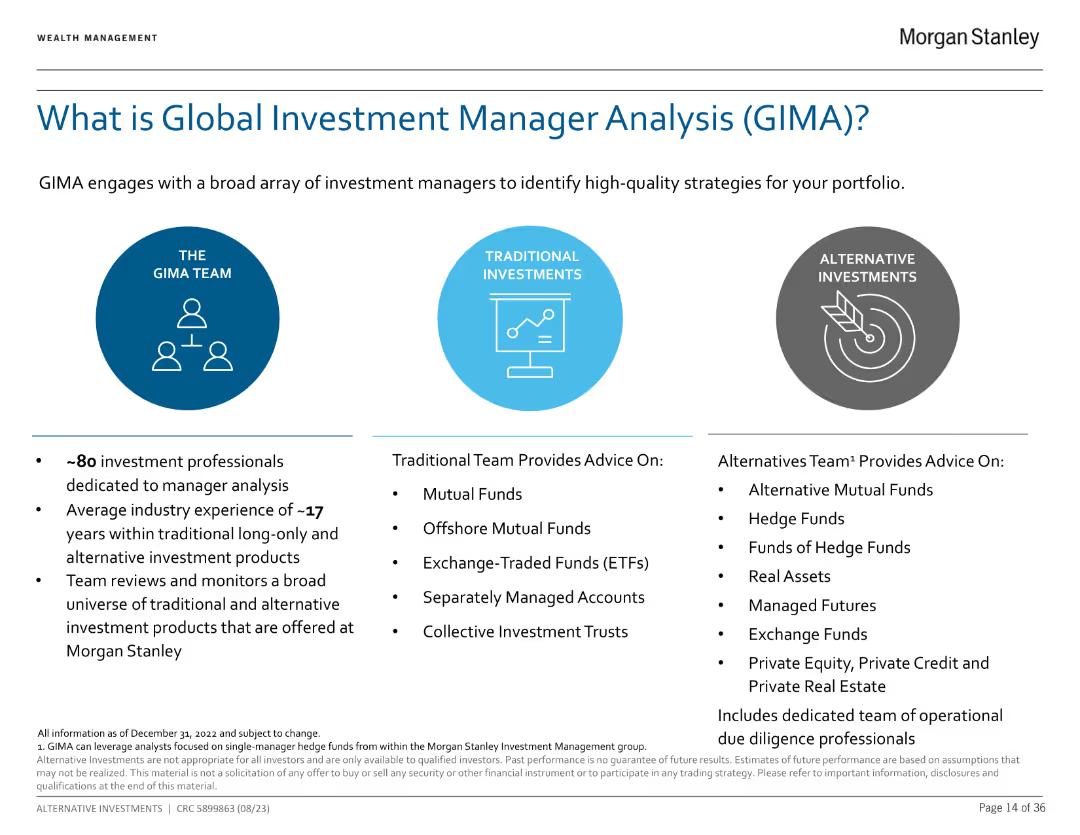
The slide is divided into three columns, describing the GIMA team, traditional investments, and alternative investments with bullet points and icons.
Market Analysis and Trends
Financial Services
This slide introduces GIMA and explains its role in investment manager analysis. It details the team's experience and the types of investments they manage, including traditional and alternative investments.
GIMA, Investment Analysis, Manager, Traditional, Alternative Investments
Pillar
Morgan Stanley
Saved
Previous
Next
If nothing, comes up, please save your slides first
Create a FREE account to continue browsing
Receive Instant Access to 1,000+ slides from companies like McKinsey, Google, and Goldman Sachs
First Name
Last Name
Email
Password
I agree to all
Terms & Privacy Policy
Thank you! Your submission has been received!
Oops! Something went wrong while submitting the form.
Have an account?
Sign in
Column Chart
Heatmap
Chevron
Org Chart
Infographic
Callouts
Timeline
List
Graphic
Picture
Process Flow
Diagram
Paragraph
Map
Table
Framework
Subtitle
Takeaway Box
Icon
Other Chart
Radar Chart
Waterfall Chart
Mekko Chart
Pie Chart
Scatter Plot
Line Chart
Bar chart
Bullet points