My Account
My Slides
Search by Category
Templates
Leave Feedback
Login
Logout
Get Started
Browse all Slides
Browse all Slides
Create a FREE Account
Instant access to 1,000+ real slides from top companies like McKinsey, BCG, Goldman Sachs, Google and many more!
First Name
Last Name
Email
Password
I agree to all
Terms & Privacy Policy
Thank you! Your submission has been received!
Oops! Something went wrong while submitting the form.
Have an account?
Sign in
Saved Slides
Features multiple column charts and tables. Charts compare luxury market growth by geography and consumer nationality from 2017 to 2018 with color coding for different regions.
Market Analysis and Trends
Retail & E-commerce
Analyzes the luxury goods market growth in 2018, highlighting the contributions from various geographies and consumer nationalities. It points to significant growth led by Chinese consumers.
Market Growth, Luxury Goods, Geography, Consumer, 2018
Multiple Chart
Bain
Saved
Timeline layout with key milestones from 2016 to 2021 and descriptions of each report edition.
Market Analysis and Trends
Technology & Software
Shows the progression of the e-Conomy SEA reports over the years, highlighting the evolution of Southeast Asia's internet economy.
e-Conomy SEA, internet economy, Southeast Asia, timeline, digital growth, market trends
Linear Flow
Bain
Saved
Complex slide with bar graphs, a percentage breakdown, and color differentiation. There is text explaining the importance of non-financial targets and a legend detailing indexed scores.
Market Analysis and Trends
Professional Services
Presents comparative data on non-financial performance measures, valuable for strategic planning and assessing the impact of enterprise reinvention on sustainability and innovation.
Enterprise, Reinvention, Performance, Non-Financial, Sustainability, Innovation, Talent, Diversity
Multiple Chart
Accenture
Saved
This slide displays a bar chart with the major limiting factors to providing antenatal care in primary healthcare centers, such as poor power supply and equipment issues. Each factor is distinctly colored for emphasis.
Risk Assessment and Management
Healthcare & Pharmaceuticals
Identifies critical barriers to healthcare service provision in primary centers, focusing on power supply issues, which is crucial for risk management and service improvement in healthcare.
healthcare barriers, power supply, risk management, PHC limitations, service improvement
Single Chart
BCG
Saved
Contains a series of bar charts displaying the impact of various factors on insurance underwriting over the next three years, differentiated by color for clarity.
Strategic Planning
Financial Services
Evaluates future factors affecting insurance underwriting, such as customer demands and new technologies, emphasizing their expected impact over the coming years.
underwriting, insurance, future impact, customer demands, new technologies
Mixed Chart
Accenture
Saved
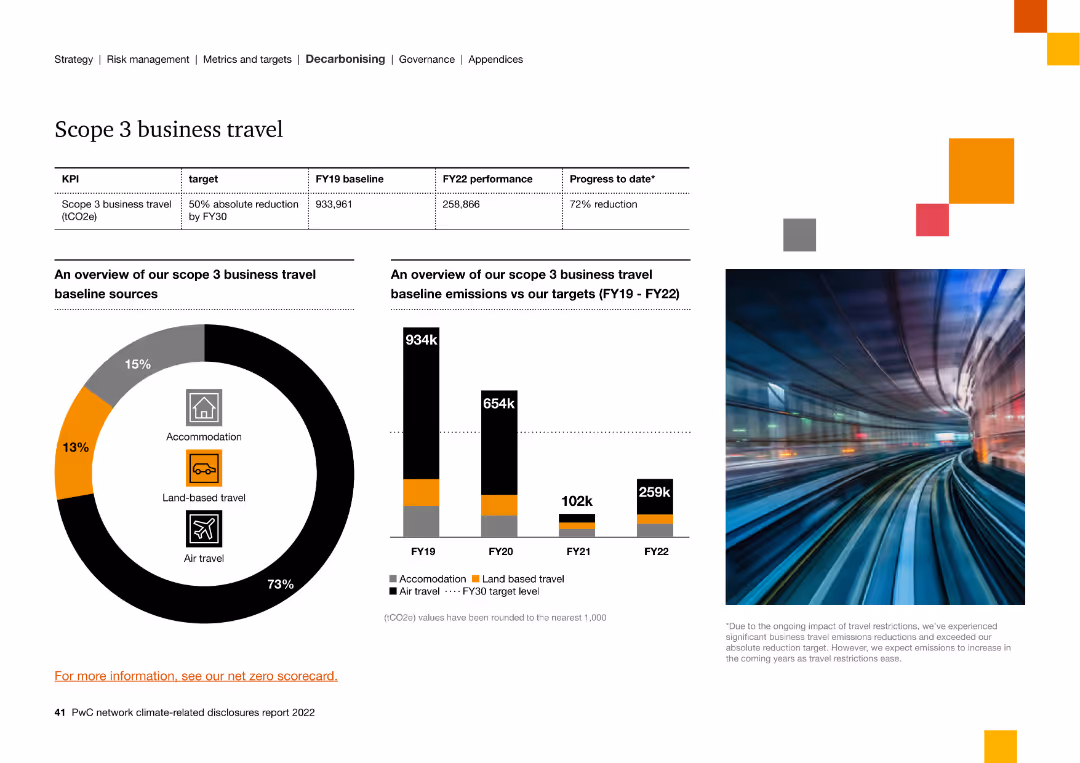
The slide features a circular graph and column charts, showing the sources and reductions of Scope 3 business travel emissions from FY19 to FY22.
Strategic Planning
Energy & Utilities
The slide provides an overview of Scope 3 business travel emissions, showing a 72% reduction target by FY30, and the breakdown of emission sources.
scope 3, business travel, emissions, reduction, sources, targets, overview
Multiple Chart
PwC/Strategy&
Saved
Split layout with text and bullet points detailing vaccine efficacy scenarios, complemented by quotes and regulatory considerations.
Regulatory and Compliance
Healthcare & Pharmaceuticals
Discusses the implications of different COVID-19 vaccine efficacy rates on public health strategy and vaccine adoption policies.
efficacy, vaccine, COVID-19, health policy
Header Vertical
BCG
Saved
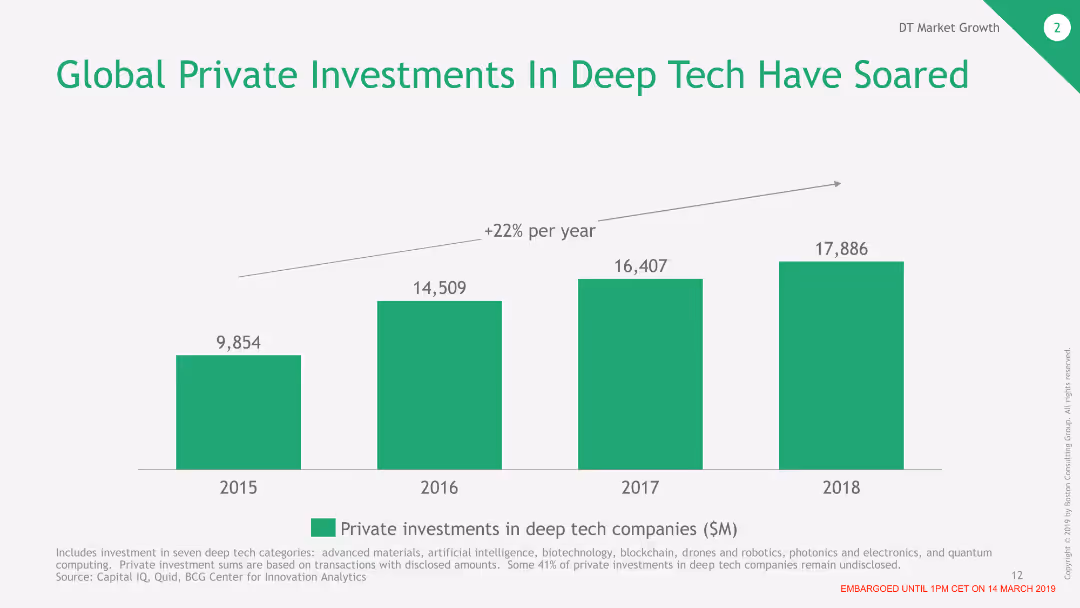
The slide features a column chart showing the increase in global private investments in deep tech from 2015 to 2018. The columns are color-coded and display the investment amounts in millions of dollars for each year.
Market Analysis and Trends
Financial Services
This slide presents data on the rising global private investments in deep tech companies over four years. It highlights a significant increase, indicating growing interest and confidence in deep tech sectors.
Deep Tech, Investment, Global, Private Investments, Growth, Financial Trends
Single Chart
BCG
Saved
Bar chart comparing 2030 green hydrogen production costs across six regions, emphasizing Chile's low costs relative to other global regions.
Market Analysis and Trends
Energy & Utilities
Compares the cost of producing green hydrogen in Chile with other regions by 2030, showcasing Chile's cost advantage.
Chile, hydrogen, cost comparison, 2030, global regions, production costs
Multiple Chart
McKinsey
Saved
The slide uses stacked column charts to compare the losses of perishable versus non-perishable foods in Nigeria, highlighting the disproportionately high losses of perishable foods.
Strategic Planning
Agriculture & Food Production
This slide analyzes food loss in Nigeria, emphasizing the greater vulnerability of perishable goods due to inadequate cold storage facilities. It suggests potential areas for infrastructural improvements to reduce these losses significantly.
Food Loss, Perishable Goods, Nigeria, Storage, Analysis
Multiple Chart
BCG
Saved
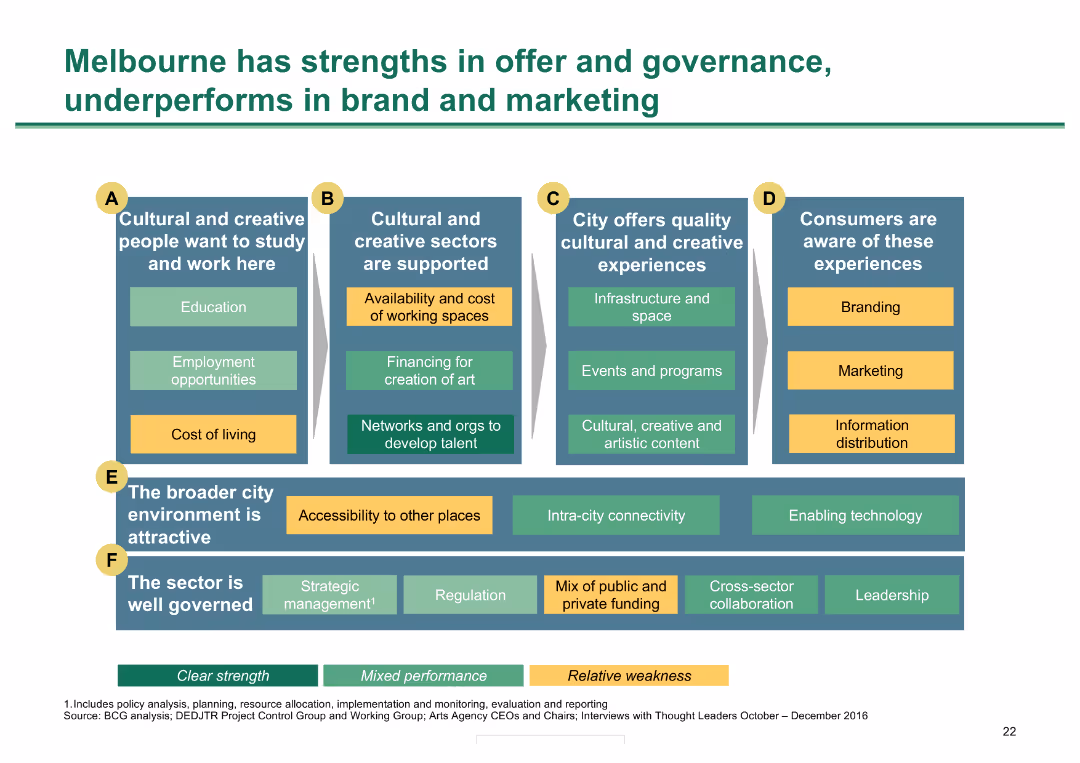
Grid with six categories of metrics; color-coded for strengths, mixed performance, and weaknesses
Market Analysis and Trends
Hospitality & Tourism
Analyzes Melbourne's strengths and weaknesses in various aspects of cultural and creative sector performance
Melbourne strengths, governance, cultural sectors, performance analysis, city metrics
Diagram
BCG
Saved
The slide features two line charts: one for European gas reserves from 2019 to 2023, and another for EU gas prices from Jan 2019 to Jan 2023.
Market Analysis and Trends
Energy & Utilities
The slide analyzes the levels of EU gas reserves and the trends in gas prices, focusing on supply pressures and rebuilding challenges.
EU gas, reserves, prices, energy, natural gas, market trends
Multiple Chart
Accenture
Saved
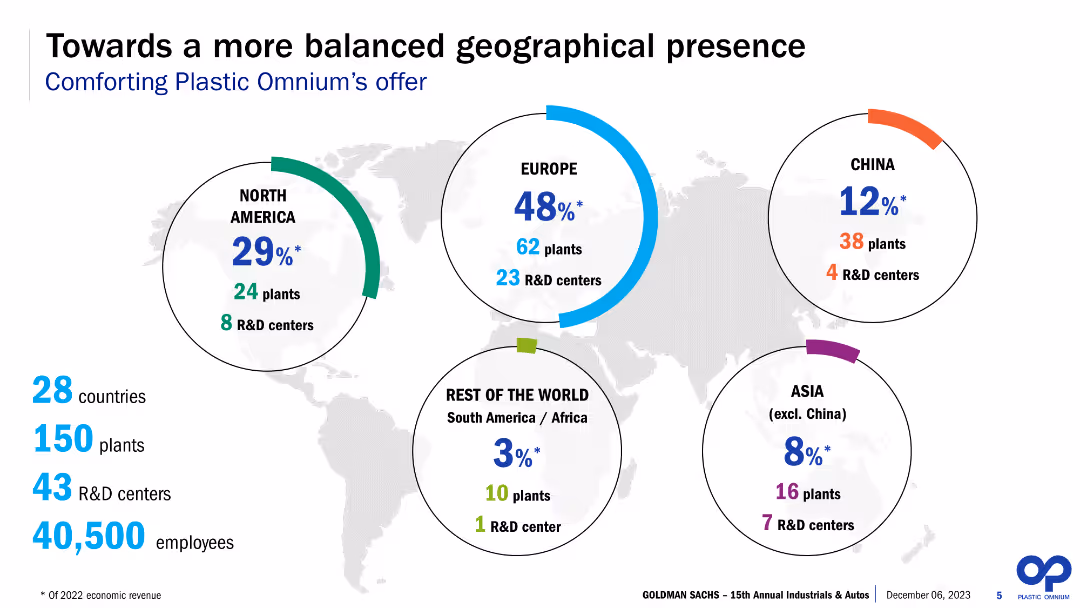
The slide features a world map with circular infographics representing various regions. It includes percentages, numbers of plants, and R&D centers across North America, Europe, China, Asia (excluding China), and the rest of the world. Text and numerical data are prominently displayed.
Strategic Planning
Industrial & Manufacturing
The slide presents Plastic Omnium’s geographical presence with detailed breakdowns of plants and R&D centers across different regions. It highlights the percentage of economic revenue each region represents, aiming to demonstrate the company’s balanced global footprint.
Global presence, plants, R&D centers, revenue, geographical distribution, Plastic Omnium, strategic planning, manufacturing, regional analysis, balanced presence
Multiple Chart
Goldman Sachs
Saved
A structured diagram categorizes the bank's divisions into five focused areas with additional descriptive text.
Organizational Structure and Change
Financial Services
This slide outlines the bank’s divisional reorganization into five focused areas, aimed at streamlining operations and enhancing efficiency.
restructuring, divisions, organizational, business model, efficiency
Diagram
Barclays
Saved
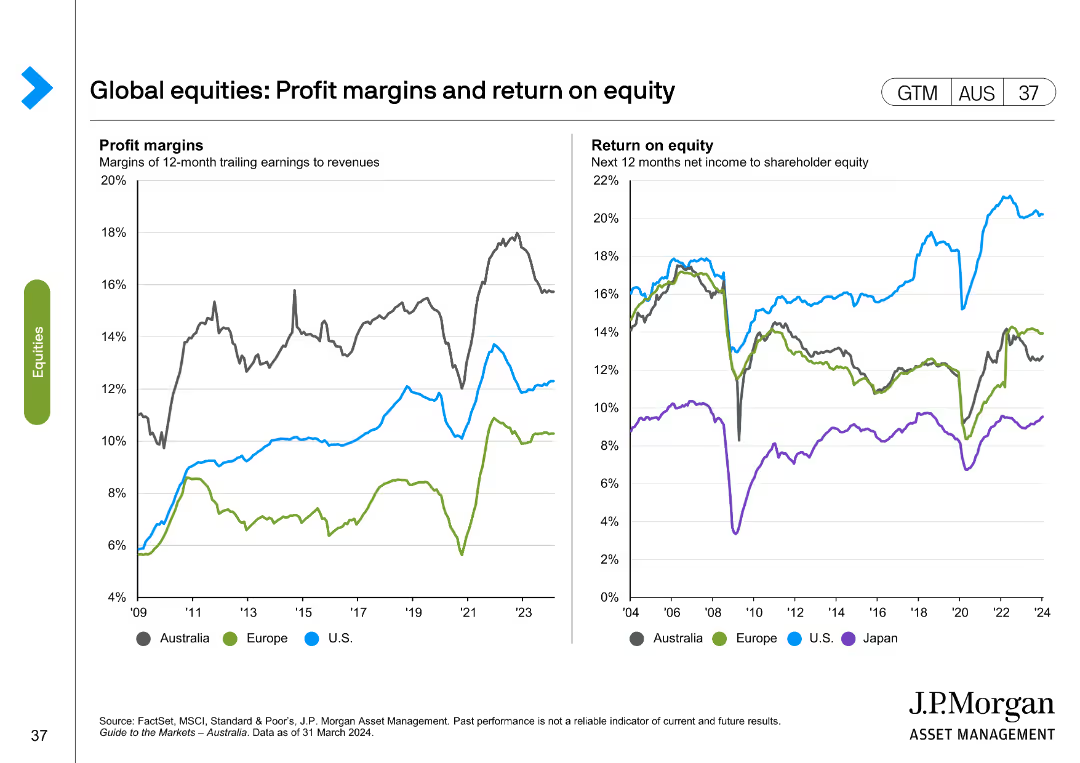
The slide includes two line charts; one shows profit margins of various regions, and the other depicts return on equity from 2004 to 2024 for different regions.
Financial Performance
Financial Services
This slide analyzes profit margins and returns on equity for different regions, offering a historical and predictive view.
profit margins, return on equity, regions, historical, predictive
Multiple Chart
JP Morgan
Saved
Features a column chart presenting commercial work put in place in New Zealand from FY07 to FY25, showcasing actual past data and future estimates under three economic scenarios. Includes a succinct title, annotations, and a color-coded legend.
Market Analysis and Trends
Real Estate & Construction
The slide forecasts commercial work trends in New Zealand, illustrating pre-pandemic levels and future expectations influenced by economic factors, useful for industry stakeholders to assess market conditions.
commercial, New Zealand, trends, forecasts, economic factors
Mixed Chart
Deloitte
Saved
The slide has a two-column format comparing supportive and opposing views on clean-energy trends. Each column contains bullet points and an icon at the top. The design is straightforward with a blue and black color scheme that provides a professional and clear presentation of information.
Strategic Planning
Energy & Utilities
This slide presents contrasting perspectives on the viability and future of clean-energy technologies. It's structured for strategic planning sessions, offering a platform for debate on the sustainability of traditional renewables, the feasibility of 100% renewable energy adoption, and the growth potential in clean tech markets. This is aimed at stakeholders who are formulating long-term strategies and considering the varying opinions and data points in the clean-energy discourse.
clean energy, renewables, debate, sustainability, technology viability, market growth, strategic planning, renewable adoption, contrasting views, business opportunities
Header Horizontal
McKinsey
Saved
This slide features pie charts showing the distribution of research participants globally across different industries and job levels. The layout is straightforward, focusing on the data.
Market Analysis and Trends
Professional Services
This slide details the demographic and market analysis of global research participants, categorizing them by industry, job level, and organizational size. It provides a comprehensive view of the participant pool, aiding in understanding the global scope of the research and its relevance across different sectors and professional standings.
Research, Global, Demographics, Industry, Job Levels
Multiple Chart
Deloitte
Saved
Includes a bar chart and detailed statistical breakdowns to illustrate job growth over periods due to broadband expansion. The slide uses color coding to differentiate between past and projected figures.
Market Analysis and Trends
Telecommunications
Highlights the employment impact of the nbn network, which has significantly increased job numbers nationwide, especially benefiting women's employment more than men's.
nbn, Jobs, Growth, Women, Projection
Multiple Chart
Accenture
Saved
Composed of a series of performance metric tables, the slide compares targets with actual results for different financial indicators over three years, using checkmarks and crosses to show if targets were met.
Financial Performance
Financial Services
The slide evaluates JPMorgan Chase's achievement against its long-term financial targets, useful for performance assessment and management discussions.
financial targets, performance assessment, JPMorgan Chase, long-term growth, revenue, profit margin, return on equity.
Table
JP Morgan
Saved
Details acquisition impacts with financial metrics and future growth opportunities.
Mergers and Acquisitions
Financial Services
Explains the strategic benefits of Tesco Bank acquisition for growth and market presence.
acquisition, Tesco Bank, growth, strategy, market presence
Linear Flow
Barclays
Saved
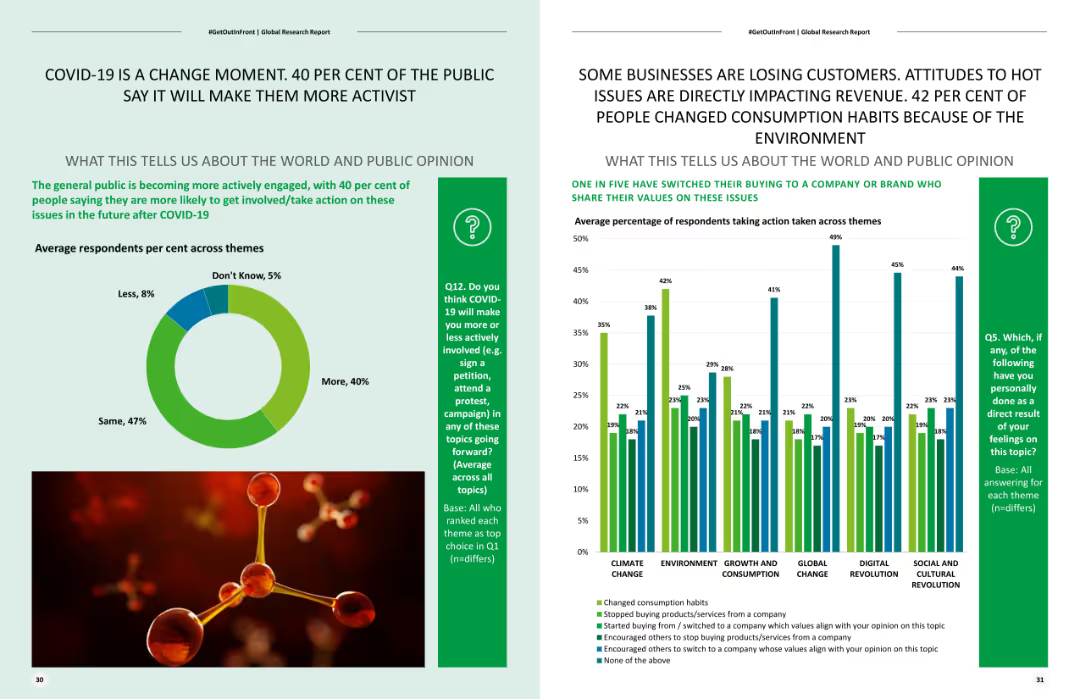
Includes a pie chart showing the distribution of expected future activism levels post-COVID-19 and a column chart on changes in consumption habits due to environmental concerns.
Risk Assessment and Management
Healthcare & Pharmaceuticals
Analyzes the impact of COVID-19 on future activism, illustrating how public sentiment towards activism has increased and affected consumer behavior.
COVID-19 impact, activism, consumer behavior, environmental concerns, future trends
Multiple Chart
Deloitte
Saved
The slide features a column chart forecasting shipping energy consumption by fuel type (oil, electricity, biofuels) from 2018 to 2040 under a stated scenario. It also includes a detailed analysis of the industry environment and bioenergy economic competitiveness.
Market Analysis and Trends
Transportation & Logistics
This slide projects energy consumption in the shipping industry, highlighting the role of biofuels as the only reliable alternative for decarbonization, and analyzing the economic competitiveness and industry environment.
shipping industry, energy consumption, fuel type, biofuels, 2018-2040, economic competitiveness, industry environment
Mixed Chart
Kearney
Saved
Multiple overlaid line charts showing projected changes in oil and gas production over time, based on data from IOC and IEA with a growth indicator.
Investment Analysis
Financial Services
Discusses oil and gas production forecasts, comparing different sources and highlighting growth expectations in the sector, suggesting ongoing investment viability despite broader market shifts.
oil, gas, production, forecasts, investment
Single Chart
BCG
Saved
Text and infographics on the adoption of sustainable procurement practices and market rewards.
Strategic Planning
Environmental Services & Sustainability
Discusses the impact and benefits of adopting sustainable procurement practices in companies.
procurement, sustainability, companies, practices, rewards
Multiple Chart
McKinsey
Saved
Previous
Next
If nothing, comes up, please save your slides first
Create a FREE account to continue browsing
Receive Instant Access to 1,000+ slides from companies like McKinsey, Google, and Goldman Sachs
First Name
Last Name
Email
Password
I agree to all
Terms & Privacy Policy
Thank you! Your submission has been received!
Oops! Something went wrong while submitting the form.
Have an account?
Sign in
Column Chart
Heatmap
Chevron
Org Chart
Infographic
Callouts
Timeline
List
Graphic
Picture
Process Flow
Diagram
Paragraph
Map
Table
Framework
Subtitle
Takeaway Box
Icon
Other Chart
Radar Chart
Waterfall Chart
Mekko Chart
Pie Chart
Scatter Plot
Line Chart
Bar chart
Bullet points