My Account
My Slides
Search by Category
Templates
Leave Feedback
Login
Logout
Get Started
Browse all Slides
Browse all Slides
Create a FREE Account
Instant access to 1,000+ real slides from top companies like McKinsey, BCG, Goldman Sachs, Google and many more!
First Name
Last Name
Email
Password
I agree to all
Terms & Privacy Policy
Thank you! Your submission has been received!
Oops! Something went wrong while submitting the form.
Have an account?
Sign in
Saved Slides
This slide presents an office meeting scene focusing on the theme of inclusive risk management. It combines textual content with an image showing a diverse group discussing risk strategies, illustrating the concept that risk management is a company-wide responsibility.
Organizational Structure and Change
Professional Services
The content highlights the importance of integrating risk management across all levels of an organization, not just within specialized risk teams. It argues for a holistic approach where everyone is empowered and informed to act on risk, enhancing the organization's overall risk culture and responsiveness to external and internal challenges.
inclusive, risk management, holistic approach, company-wide, empowerment, discussion, office
Mixed Chart
Accenture
Saved
The slide includes three line charts depicting US y/y real GDP (2005-25F), US unemployment rate (2005-25F), and US y/y CPI (2005-25F). The design is moderately complex with clear labels and projections marked with dashed lines. Text at the bottom explains key economic factors.
Market Analysis and Trends
Financial Services
The slide forecasts US economic activity in 2024, highlighting slower private sector activity, easing inflation, and a modest rise in unemployment. It discusses factors influencing these trends and implications for business leaders and consumers.
economic activity, GDP, unemployment, CPI, forecast
Multiple Chart
EY
Saved
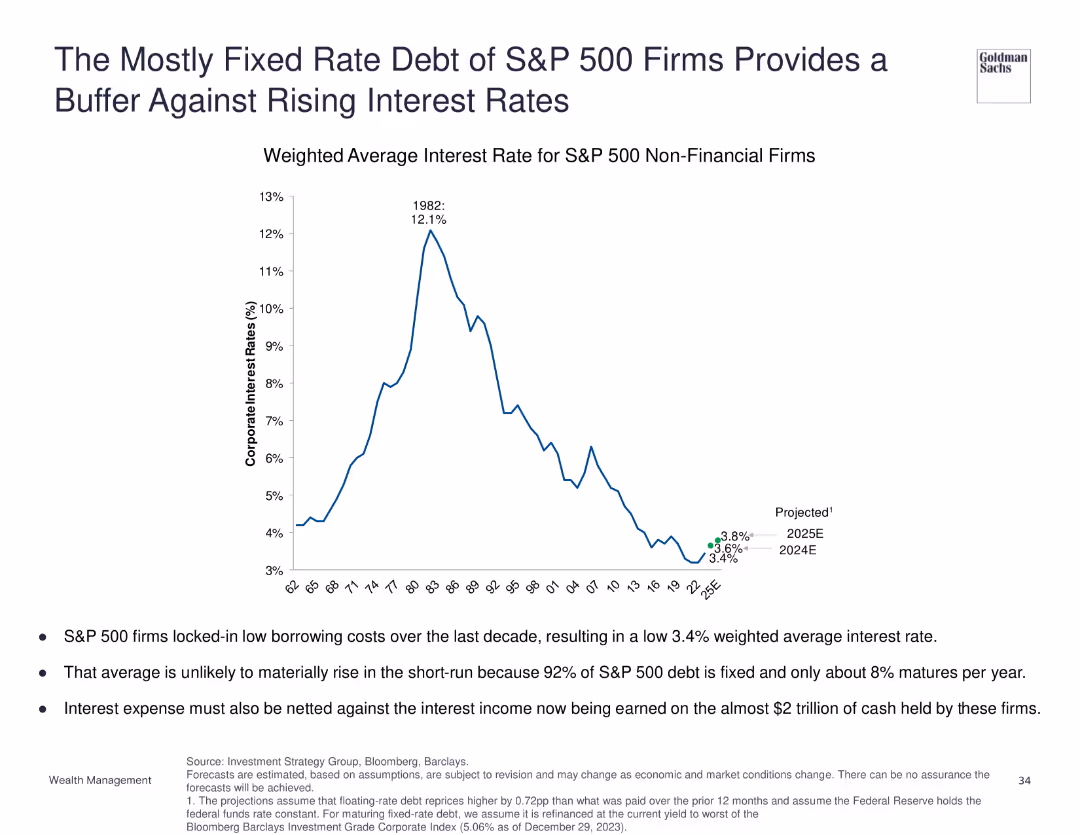
Line chart depicting the weighted average interest rate for S&P 500 non-financial firms from 1968 to projected rates in 2025.
Financial Performance
Financial Services
Discusses how the mostly fixed-rate debt of S&P 500 firms buffers against rising interest rates, with the weighted average interest rate expected to remain low in the short run.
fixed rate debt, interest rates, S&P 500, financial buffer
Mixed Chart
Goldman Sachs
Saved
A single column chart shows the resilient growth of Malaysia's internet economy GMV from 2015 to projected 2025.
Market Analysis and Trends
Technology & Software
Shows Malaysia's internet economy's resilient growth, reaching US $11B with future projections and growth rate.
Internet economy, Malaysia, GMV, Resilience, Growth, Projections, 2015, 2025
Single Chart
Bain
Saved
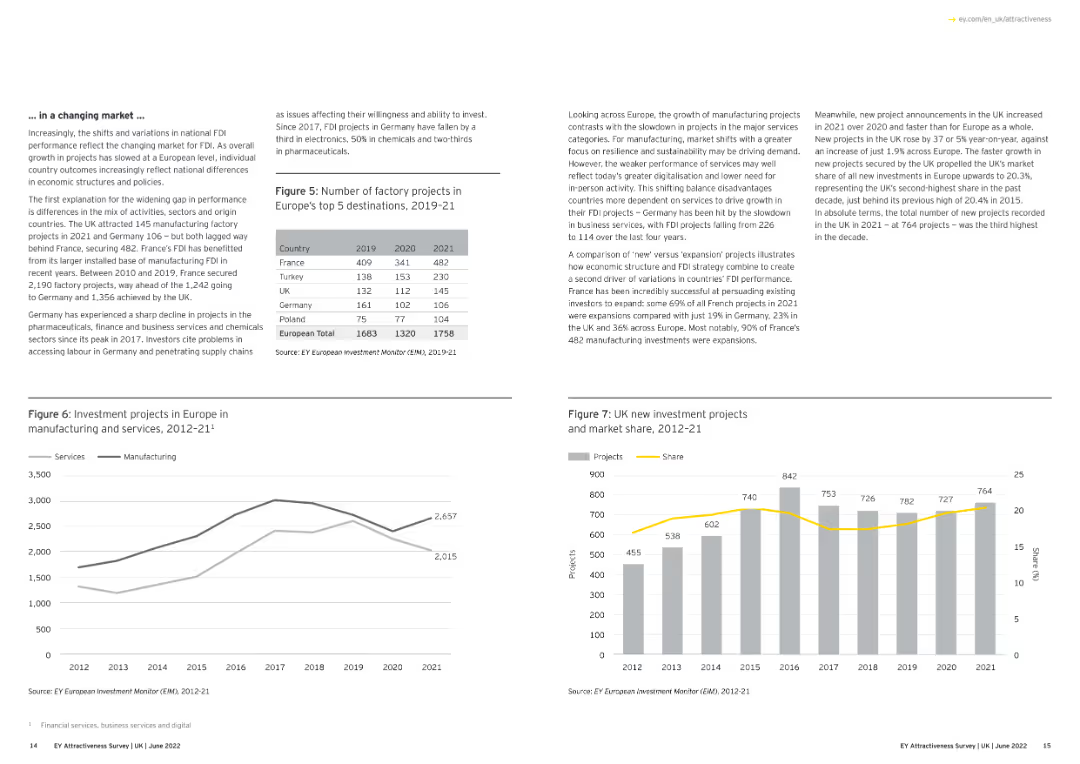
The slide features text and line charts illustrating FDI project trends in Europe.
Market Analysis and Trends
Financial Services
This slide analyzes FDI trends in Europe, emphasizing changes in national FDI performance, the impact of market shifts, and the variation in investment project types and numbers across major European countries.
FDI, Europe, Market Trends, Investment Projects
Multiple Chart
EY
Saved
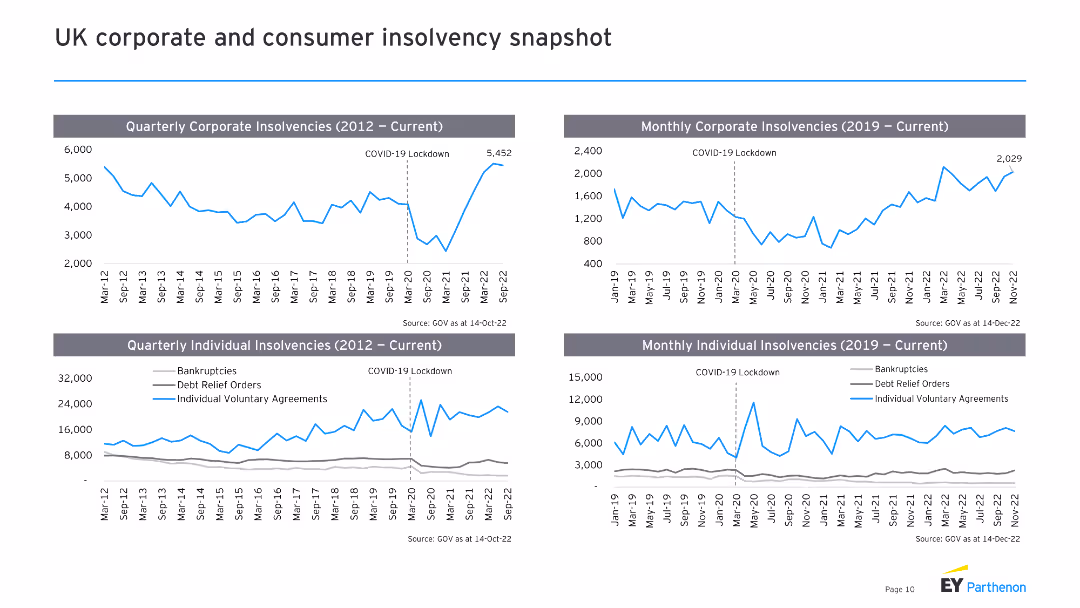
The slide includes four line charts, showing quarterly and monthly corporate and individual insolvencies in the UK over different time periods.
Market Analysis and Trends
Financial Services
This slide examines insolvency trends in the UK, comparing corporate and individual insolvencies, useful for assessing economic health and risk factors.
insolvency, corporate, individual, UK, trends
Multiple Chart
EY
Saved
Features a vertical column chart depicting liquidity coverage ratio and a text box outlining liquidity management strategies and goals.
Risk Assessment and Management
Financial Services
Discusses UBS Group AG's liquidity coverage ratio, efficiency, safety, and strategies to meet stringent Swiss liquidity requirements.
UBS, liquidity, coverage ratio, efficiency, safety, funding, management, requirements, Swiss
Mixed Chart
UBS
Saved
Donut chart showing the breakdown of loans and advances by type, with details on mortgages, lombard, corporates, and other categories.
Financial Performance
Financial Services
Overview of UBS's loan portfolio quality, detailing various loan categories and highlighting the composition and collateral.
Loans, portfolio, mortgages, lombard, corporates
Mixed Chart
UBS
Saved
The slide displays line charts and informational blocks showing trends in CET1 ratio, loan deposit ratios, and other liquidity measures.
Financial Performance
Financial Services
The slide provides an overview of the bank's financial stability over time through various financial metrics like CET1 ratio and liquidity coverage ratio.
financial stability, liquidity, metrics, CET1 ratio
Multiple Chart
Barclays
Saved
Features a line graph showing the growth in quarterly internet advertising revenues from 1996 to 2020, with a peak in Q4 2020 highlighted.
Market Analysis and Trends
Media & Entertainment
Highlights the upward trend in internet advertising revenues over decades, with a focus on the record-high revenues achieved in Q4 2020 due to political and holiday advertising.
advertising, revenue, quarterly, growth, record-high, internet, 2020, media, technology
Single Chart
PwC/Strategy&
Saved
Contains multiple column charts showing sector distribution over five years and bar charts displaying business stage distribution.
Strategic Planning
Technology & Software
Provides a comparative analysis of sectoral shifts and business stage distribution from 2015 to 2019, highlighting trends and changes.
sectoral, distribution, trends, business, analysis
Multiple Chart
Accenture
Saved
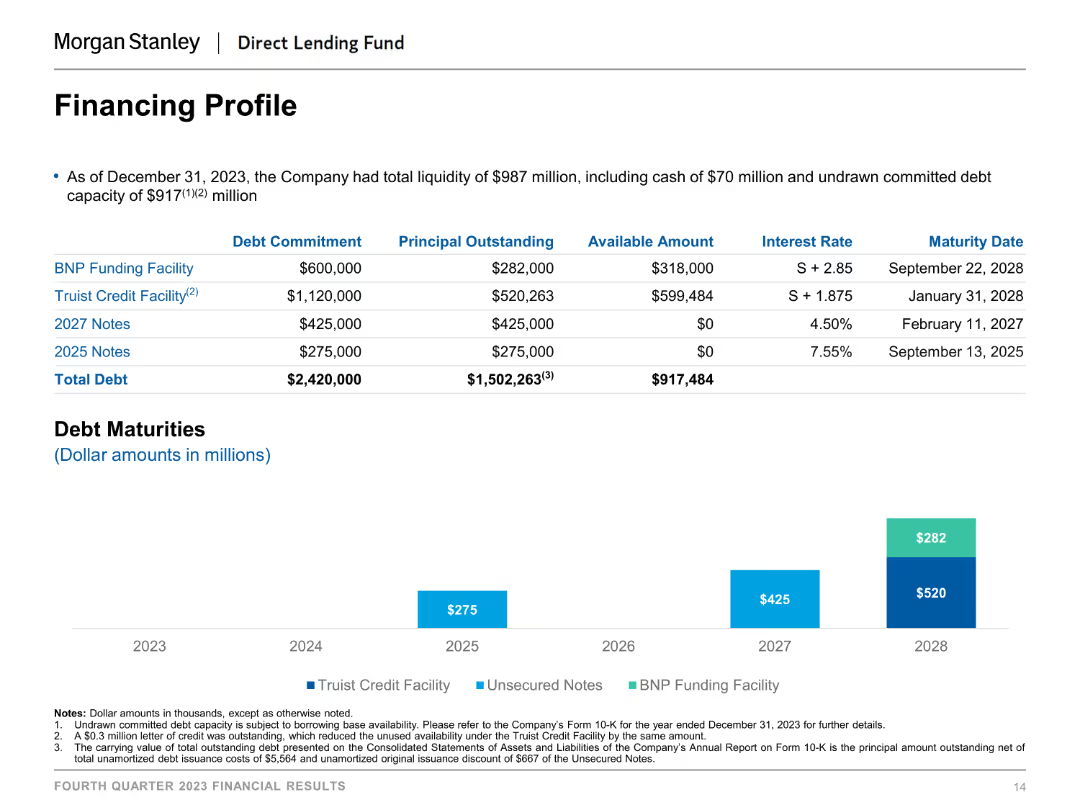
A table detailing debt commitments, principal outstanding, available amounts, interest rates, and maturity dates.
Financial Performance
Financial Services
This slide provides an overview of the company’s financing profile as of December 31, 2023, showing various funding facilities, notes, and debt maturities.
Debt, Financing, Interest Rates, Maturity Dates, Liquidity
Mixed Chart
Morgan Stanley
Saved
This slide features a large title at the top, a key financial indicator as a prominent column chart on the left, and a detailed table of financial metrics on the right. The column chart illustrates CCB Pretax Income from 2019 to 2022. The table lists metrics like average deposits and loans, revenue, and expense across three years, with certain figures highlighted to draw attention.
Financial Performance
Financial Services
The slide communicates financial performance over three years, showcasing pre-tax income and detailed banking metrics such as deposits, loans, and expenses. It emphasizes financial growth and profitability, indicating a healthy financial status. Intended for financial analysts or investors, it serves to convey the company's financial strength and effectiveness in managing assets and liabilities, highlighting favorable trends that signify sound financial management and potential for sustained growth.
Financial, Performance, Deposits, Loans, Revenue, Expense, Growth, Profitability, Banking, Analysis
Single Chart
JP Morgan
Saved
Column charts showing profitability metrics and PBT details
Financial Performance
Financial Services
Shows return to profitability with key metrics such as PBT, net profit, and cost/income ratio
profitability, net, profit, metrics
Mixed Chart
UBS
Saved
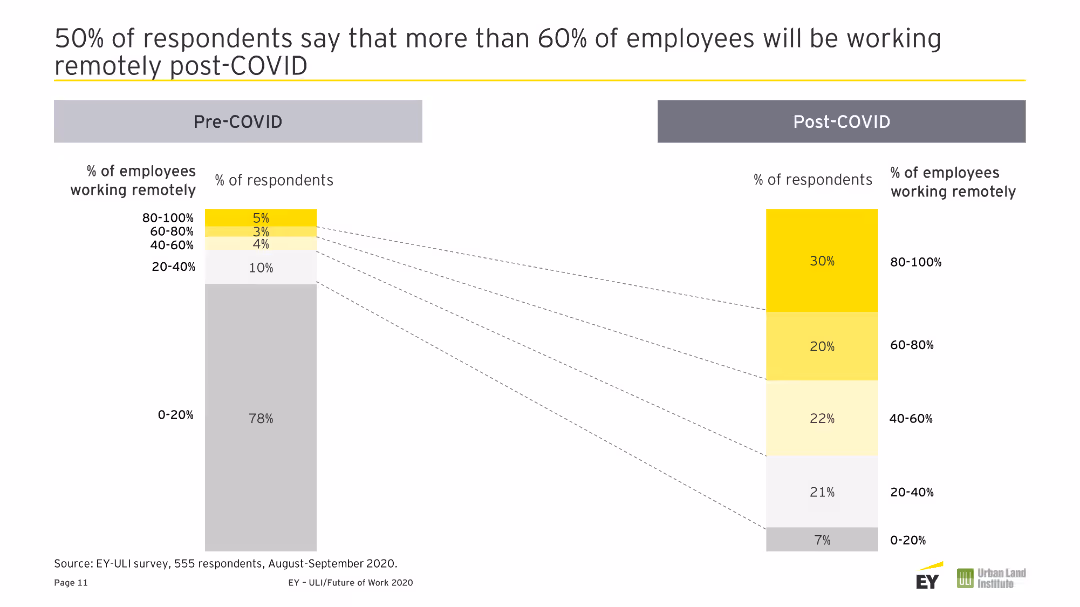
A column chart comparing pre and post-COVID percentages of employees working remotely across different timeframes.
Human Resources and Talent Management
Technology & Software
This slide highlights survey results indicating that a significant portion of employees are expected to work remotely most of the time post-COVID-19.
Remote Work, Post-COVID, Workforce, Survey, Employee Expectations
Multiple Chart
EY
Saved
The slide includes a stacked column chart displaying unlinked bus and rail rides annually, with distinct colors for each mode of transport and a trend line indicating changes.
Industry Overview
Transportation & Logistics
Presents data on declining ridership in public transportation, identifying trends and potential areas for operational improvements to enhance service efficiency.
public transportation, ridership decline, operational efficiency, data analysis
Multiple Chart
Deutsche Bank
Saved
It features tables and a column chart summarizing legacy franchises' results, with blue accents. It presents net income, revenues, and loans and deposits statistics.
Operational Efficiency
Financial Services
Outlines financial and operational results for legacy franchises, detailing revenues, credit costs, and changes in loans and deposits. Suitable for discussions on operational efficiency or historical performance analysis in financial reviews.
Legacy, Franchises, Financial Results, Revenues, Credit Costs, Operational Efficiency
Mixed Chart
Citigroup
Saved
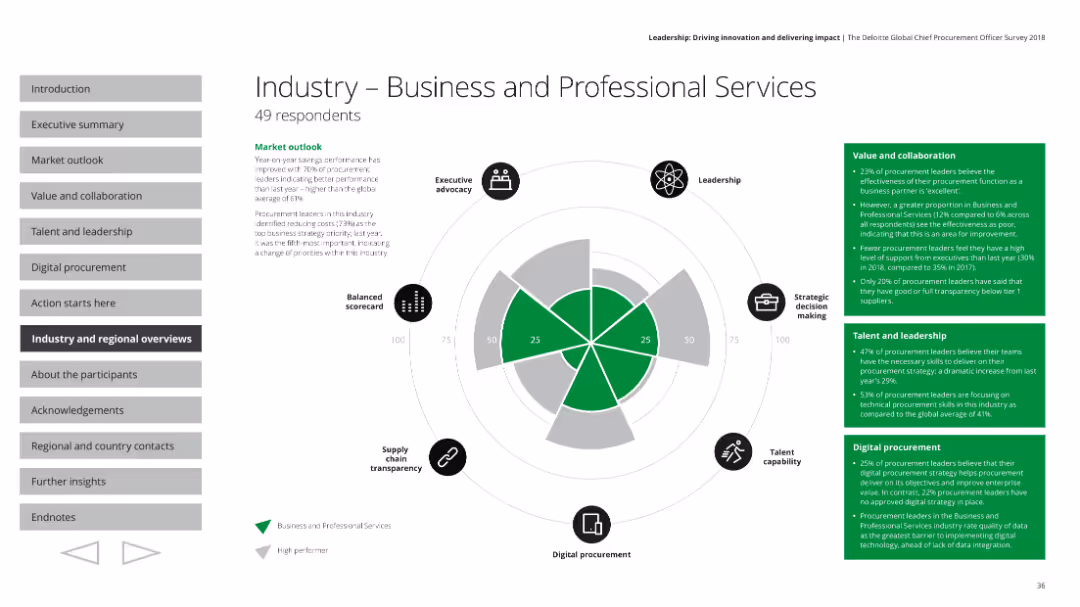
Includes a radar chart and text blocks summarizing key performance areas like market outlook, value and collaboration, and leadership in the industry.
Industry Overview
Professional Services
Provides an overview of the business and professional services industry, detailing performance metrics, strategic priorities, and leadership challenges.
Industry overview, performance, strategy, leadership
Mixed Chart
Deloitte
Saved
Slide presents bullet points, check marks for progress, and four circular icons with financial figures for different strategic priorities.
Strategic Planning
Financial Services
Communicates strategic priorities and the progress made in different financial sectors, including international expansion and carbon transition.
Strategic Priorities, Financial Sponsors, Capital, International, Carbon Transition, Progress
Table
JP Morgan
Saved
Features two column charts comparing the underlying TOP margin over time and a circle representing ROIC comparison, along with text annotations detailing financial strategies.
Financial Performance
Consumer Goods
Provides an overview of financial performance in emerging markets, emphasizing improvements in margins and returns. Useful for financial analysis and understanding the impact of operational efficiencies on profitability.
financial performance, margins, ROIC, profitability, operational efficiency
Mixed Chart
Deutsche Bank
Saved
This slide visually compares expenses between 2022 and 2023 using column charts, with additional details on drivers of expenses and the impact of divestitures. The design is straightforward, focusing on clarity and comparison.
Operational Efficiency
Financial Services
A detailed comparison and analysis of expected expenses, this slide is used to inform on financial planning, cost management, and operational budgeting. It highlights the influence of market factors on expense trends and is likely used in management meetings, financial reviews, and planning sessions to optimize cost-efficiency.
Expenses Comparison, Cost Management, Financial Planning, Divestiture Impact
Mixed Chart
Citigroup
Saved
A text-heavy slide with numbered points outlining strategic actions for risk management, with a focus on organizational tone and risk culture.
Strategic Planning
Professional Services
Provides a detailed action plan for improving risk management, including setting organizational tone, aligning risk with strategy, and developing risk reporting.
Risk management, strategic planning, organizational tone, risk culture, action plan, reporting, alignment
Vertical Flow
PwC/Strategy&
Saved
The slide compares the economic effects of traditional market dominance with zero marginal cost and open access through blockchains. Diagrams and text highlight how blockchains enable real competition versus market dominance.
Technology and Digital Transformation
Technology & Software
This slide discusses how blockchains can transform the global competitive landscape by reducing marginal costs, fostering network effects, and enabling open access, contrasting it with traditional vendor lock-in and market dominance scenarios.
Blockchain, economy, competition, market dominance, open access
Mixed Chart
EY
Saved
Includes a percentage bar chart with a purple theme. Each bar represents consumer agreement levels with statements about business responsibility.
Strategic Planning
Professional Services
Discusses expectations for businesses to act responsibly post-event, emphasizing the high consumer agreement on sustainable and fair solutions.
Corporate responsibility, Business ethics, Consumer expectations, Agreement levels, Sustainable solutions, Fair practices, Bar chart
Single Chart
Accenture
Saved
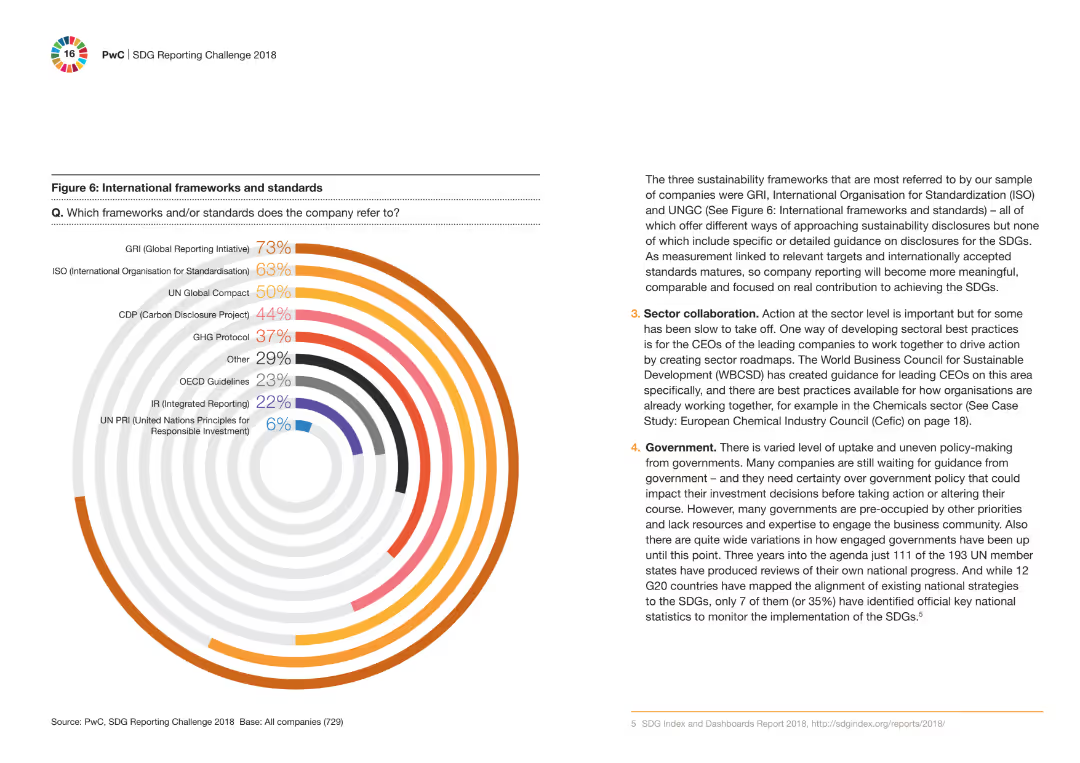
A circular bar chart displaying the percentage of companies referring to different international frameworks and standards. Accompanying text explains the importance of these frameworks in sustainability reporting.
Regulatory and Compliance
Financial Services
The slide showcases the international frameworks and standards most referred to by companies for sustainability reporting, with a circular bar chart highlighting the key standards like GRI, ISO, and UNGC.
frameworks, standards, sustainability, reporting, companies
Mixed Chart
PwC/Strategy&
Saved
Previous
Next
If nothing, comes up, please save your slides first
Create a FREE account to continue browsing
Receive Instant Access to 1,000+ slides from companies like McKinsey, Google, and Goldman Sachs
First Name
Last Name
Email
Password
I agree to all
Terms & Privacy Policy
Thank you! Your submission has been received!
Oops! Something went wrong while submitting the form.
Have an account?
Sign in
Column Chart
Heatmap
Chevron
Org Chart
Infographic
Callouts
Timeline
List
Graphic
Picture
Process Flow
Diagram
Paragraph
Map
Table
Framework
Subtitle
Takeaway Box
Icon
Other Chart
Radar Chart
Waterfall Chart
Mekko Chart
Pie Chart
Scatter Plot
Line Chart
Bar chart
Bullet points