My Account
My Slides
Search by Category
Templates
Leave Feedback
Login
Logout
Get Started
Browse all Slides
Browse all Slides
Create a FREE Account
Instant access to 1,000+ real slides from top companies like McKinsey, BCG, Goldman Sachs, Google and many more!
First Name
Last Name
Email
Password
I agree to all
Terms & Privacy Policy
Thank you! Your submission has been received!
Oops! Something went wrong while submitting the form.
Have an account?
Sign in
Saved Slides
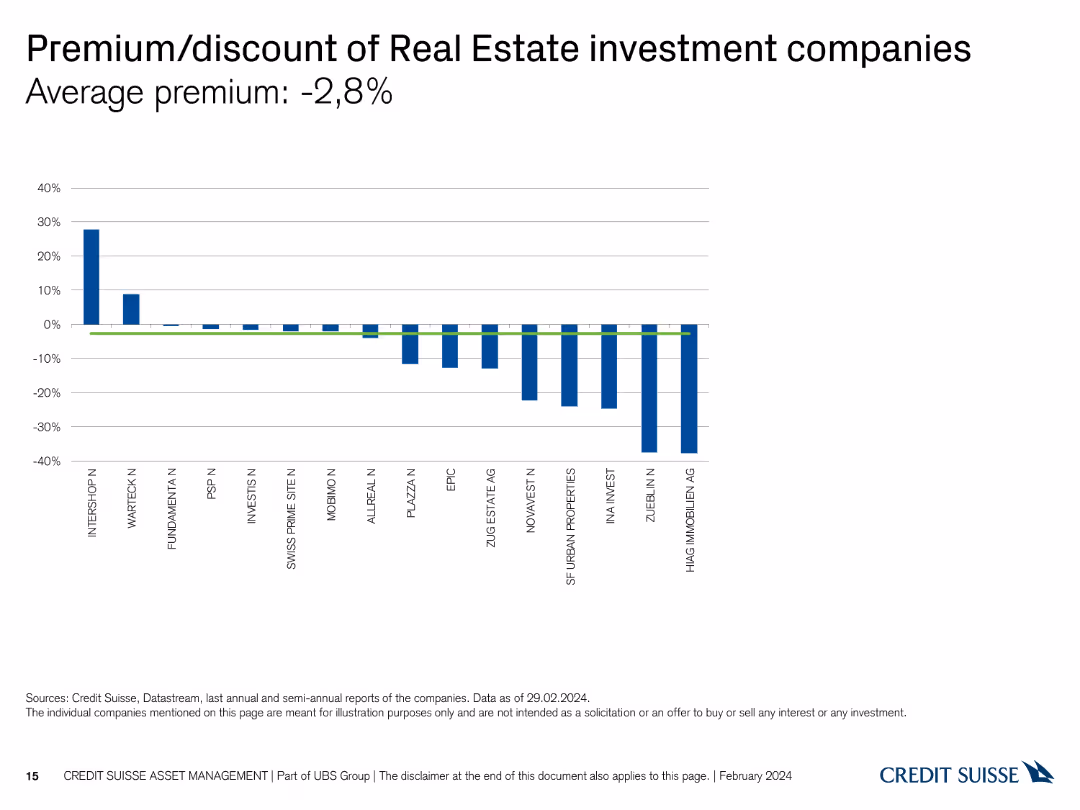
The slide shows a column chart comparing the premium/discount rates of various Real Estate investment companies.
Market Analysis and Trends
Real Estate & Construction
It highlights the average premium and discount rates, allowing for the analysis of investment values in Real Estate companies.
premium, discount, Real Estate, investment, companies
Single Chart
Credit Suisse
Saved
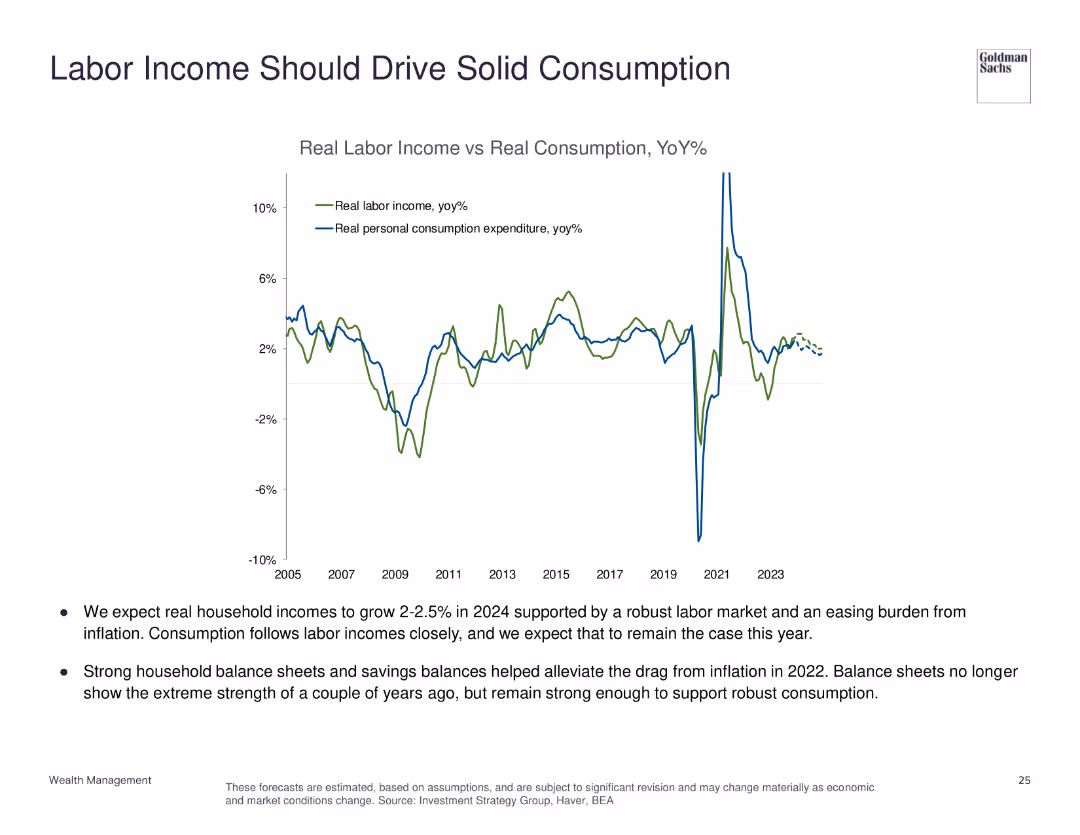
The slide features a line chart comparing real labor income vs. real personal consumption expenditure from 2005 to 2023, with annotations for key trends.
Market Analysis and Trends
Financial Services
This slide examines the relationship between labor income and consumption, predicting robust household income growth and solid consumption.
labor income, personal consumption, economic analysis, household income, consumption trends
Mixed Chart
Goldman Sachs
Saved
Line chart showing DM unemployment rate from 1971 to 2021 with a notable spike and grey shading indicating recent uncertainty. The design is clean with a single blue line and minimal text annotations.
Market Analysis and Trends
Financial Services
Analyzes unemployment trends over five decades, highlighting uncertainties due to recent global events. Useful for economic forecasting and labor market analysis.
Unemployment rate, DM, economic analysis, labor market trends, historical data, pandemic impact, line chart, J.P. Morgan.
Single Chart
JP Morgan
Saved
This slide visually maps out how employee needs evolve over time, with specific focus on various career stages. It uses a timeline format, complemented by icons representing different workforce segments. The layout includes side texts and a central illustrative panel that details the changing priorities and expectations of employees at each career phase.
Human Resources and Talent Management
Professional Services
Highlights the importance of recognizing the dynamic and diverse needs of employees throughout their careers, suggesting tailored approaches to DEI that address these varying requirements. It encourages companies to adopt flexible and inclusive strategies that acknowledge the unique challenges and aspirations of different employee groups.
DEI, career development, employee needs, workforce diversity, talent management, inclusive strategies
Linear Flow
BCG
Saved
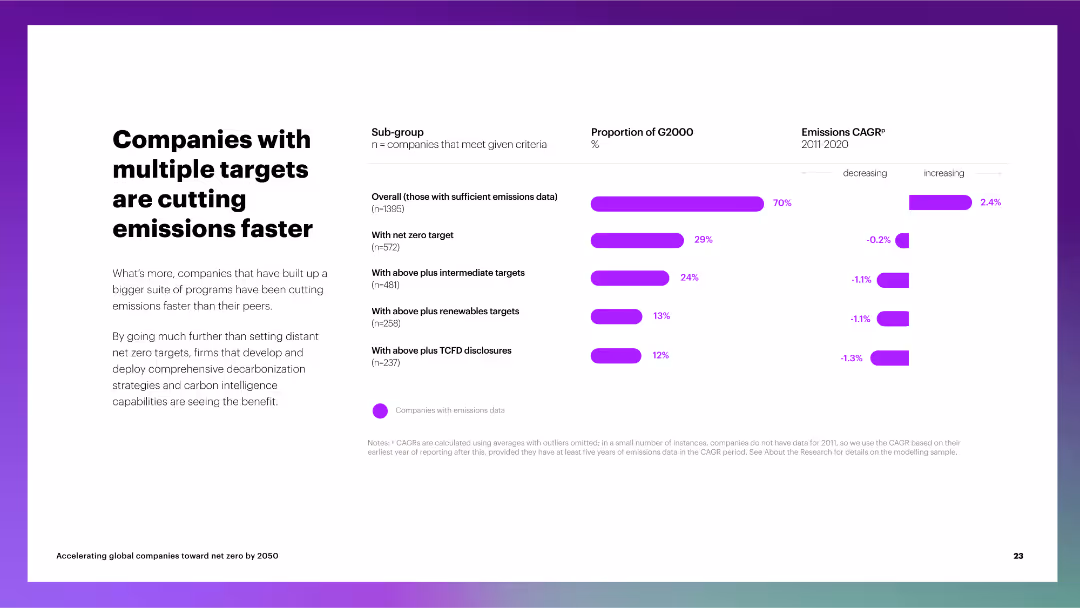
The slide includes a column chart depicting the proportion of G2000 companies with multiple emissions targets and their CAGR for emissions reduction.
Performance Metrics and KPIs
Environmental Services & Sustainability
The slide discusses the impact of multiple net zero targets on emissions reduction, showing that companies with comprehensive strategies perform better than their peers.
multiple targets, emissions reduction, G2000, net zero, intermediate targets, renewable targets, TCFD disclosures, CAGR
Multiple Chart
Accenture
Saved
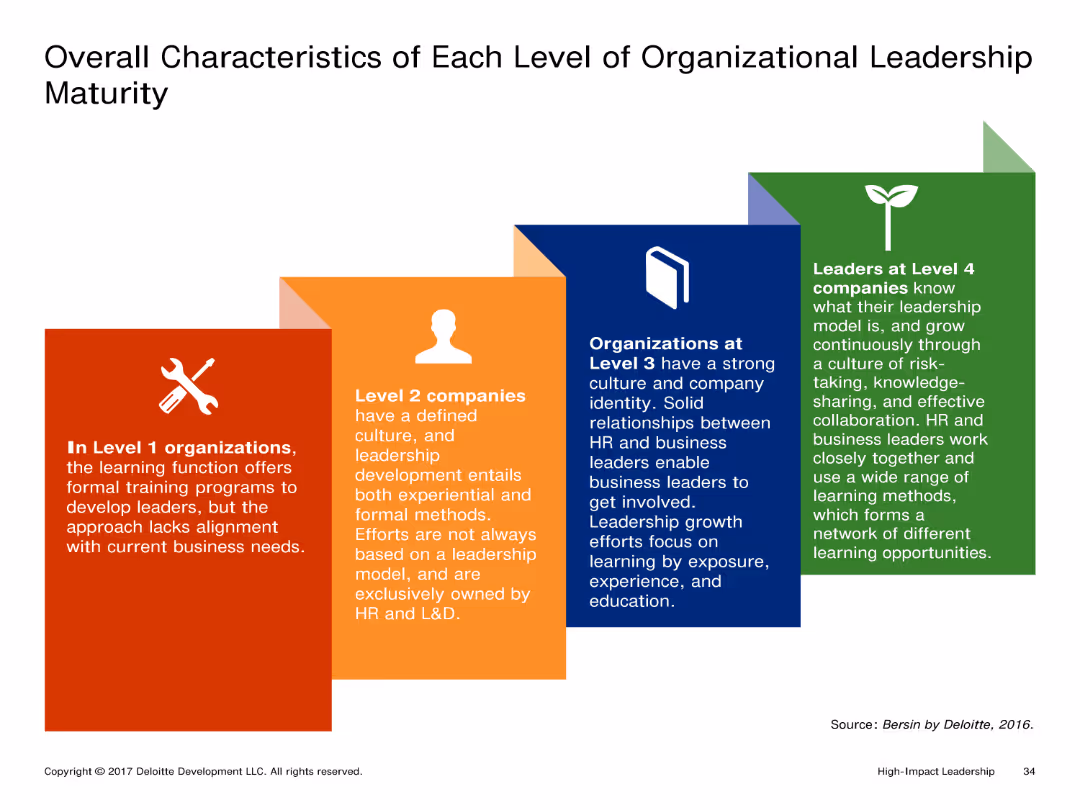
The slide shows a visual representation of different levels of organizational leadership maturity with distinct boxes for each level. Each box contains detailed text describing the characteristics of that level.
Market Analysis and Trends
Professional Services
It outlines the characteristics of organizations at different levels of leadership maturity, from Level 1 to Level 4. Each level's description highlights the leadership development approach and involvement of HR and business leaders.
Leadership, Organizational Maturity, Levels, Characteristics, Development
Pillar
Deloitte
Saved
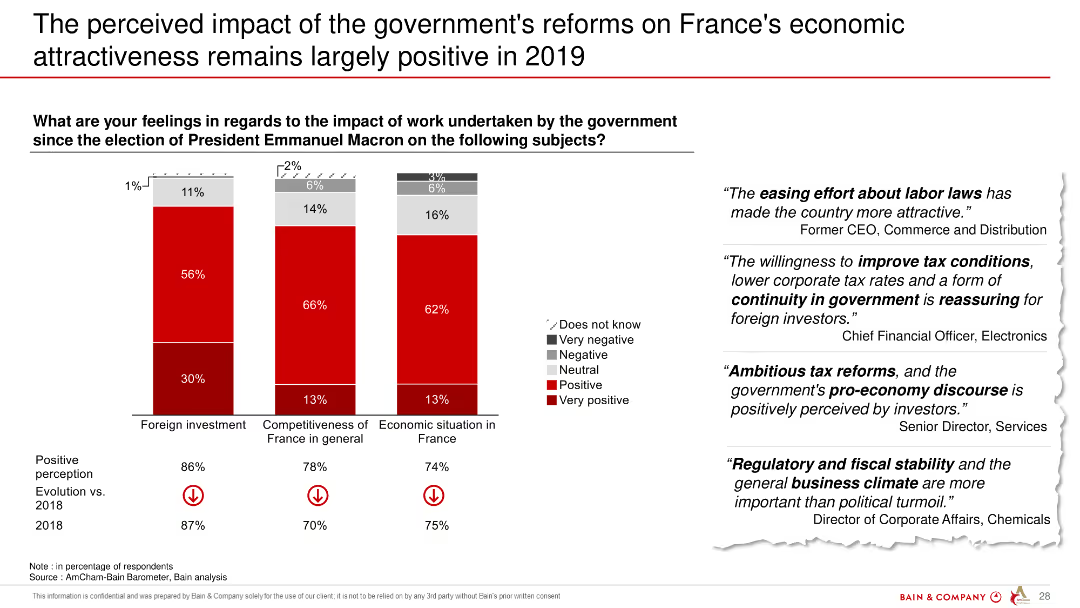
The slide includes three column charts depicting respondents' perceptions of government reforms' impact on foreign investment, competitiveness, and economic situation in France. Red and grey colors highlight positive and negative responses.
Market Analysis and Trends
Government & Public Sector
The slide highlights that most respondents view the government's reforms positively, with significant improvements in foreign investment and economic situation.
economic attractiveness, government reforms, foreign investment, competitiveness, France, 2019
Mixed Chart
Bain
Saved
A structured slide with headers and a linear array of hexagons indicating financial services such as "Risk" and "Payments", with arrows pointing downwards, signifying the translation into a platform service with the assistance of "VOICE and APIs".
Technology and Digital Transformation
Financial Services
Transitioning Goldman Sachs' financial services into a more accessible platform, integrating technology like APIs to streamline services such as risk management, data analytics, and payments for better client engagement and operational efficiency.
platform, APIs, financial services, transformation, efficiency
Diagram
Goldman Sachs
Saved
Includes column charts showing the expected impact of GenAI on workforce productivity and cost savings across front and back office functions, with a large textual explanation below the charts.
Operational Efficiency
Financial Services
The slide analyzes the expected impacts of GenAI on workforce productivity and cost savings, particularly highlighting the differences between front office and back office functions in banks.
GenAI, workforce, productivity, cost savings, banks
Multiple Chart
EY
Saved
The slide includes a title, a column chart with net revenues, a table detailing financial results, and bullet points summarizing the highlights. The slide is well-organized with moderate visual complexity.
Financial Performance
Financial Services
Aimed at displaying detailed financial results for the global banking and markets sector of a company. It includes revenue from various services like investment banking and equities. The data is probably used to analyze market positions and inform strategy meetings or investor updates.
Investment Banking, Equities, Net Revenues, Financial Results
Mixed Chart
Goldman Sachs
Saved
Displays column charts detailing assets under management by business unit and product group, with clear textual annotations.
Financial Performance
Financial Services
Details the growth and distribution of assets under management within the private banking sector, highlighting net flows and product distribution.
assets, management, banking, financial, growth, distribution, private, investment
Multiple Chart
Deutsche Bank
Saved
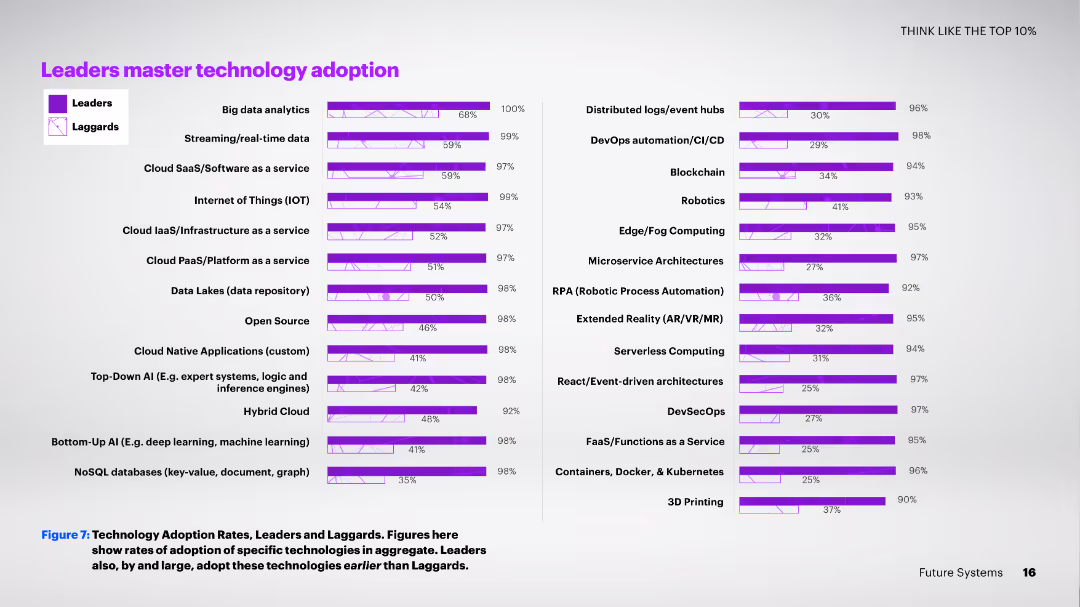
A two-column slide with horizontal bar charts showing the adoption rates of various technologies among leaders and laggards.
Technology and Digital Transformation
Technology & Software
This slide details the high adoption rates of advanced technologies among leaders compared to laggards, showcasing a broad range of technologies from big data analytics to 3D printing.
technology adoption, leaders, laggards, comparison, advanced technologies, big data, 3D printing, rates, broad range
Multiple Chart
Accenture
Saved
The slide includes text boxes comparing consulting, testing/analytics, and remediation services with icons and demand outlook descriptions.
Market Analysis and Trends
Environmental Services & Sustainability
It discusses the potential delays in remediation projects due to temporary job access while highlighting stable demand in consulting services.
Remediation, consulting, analytics, project delays, demand, services, engagement cycles, temporary job
Table
LEK
Saved
Slide contains a column chart showcasing the types of deposits and their respective values in loss-absorbing capacity terms.
Regulatory and Compliance
Financial Services
Explains the bank's loss-absorbing capacity with detailed breakdowns of liability categories and regulatory implications, highlighting financial resilience strategies.
loss-absorbing, regulatory, capacity, liabilities, banking, financial resilience, strategy
Mixed Chart
Deutsche Bank
Saved
Title at the top, three-column format with text and checkmarks. The first column lists monetary targets, the second lists client propositions with checkmarks, and the third outlines progress with investment platforms.
Investment Analysis
Financial Services
Highlights the 5-year opportunity and strong client value propositions in third-party alternative investments, including capital reduction, franchise development, and capital efficiency optimization.
Investments, Capital, Alternatives, Efficiency, Multi-Asset Class
Table
Goldman Sachs
Saved
A two-column slide with rounded rectangles in shades of blue showing a timeline split between '2H23' and '4Q23 Earnings', each column contains bulleted lists describing future operational and financial strategies.
Strategic Planning
Financial Services
This slide is designed to communicate the future strategic actions and deadlines Citigroup intends to take, such as aligning operations with a new structure and providing financial guidance. It can be used to set expectations for the implementation phases of organizational changes.
Timeline, Strategy, Citigroup, Organizational Change, Financial Guidance, Operations, Deadlines, Earnings
Header Horizontal
Citigroup
Saved
Features a complex set of bullet points and a column charts to depict financial risk metrics and regulatory requirements.
Risk Assessment and Management
Financial Services
Details on the bank's capacity to absorb losses, essential for risk management strategies and regulatory compliance.
risk management, regulatory compliance, financial safety, TLAC, MREL
Multiple Chart
Deutsche Bank
Saved
Three line charts comparing cumulative real wage gaps between nominal wages and consumer prices (CPI) for the US, UK, and Euro area, showing persistent inflation outpacing wage growth and resulting in wage catchup pressures.
Market Analysis and Trends
Professional Services
This slide highlights the persistent real pay gaps over the past two years in the US, UK, and Euro area, suggesting ongoing labor cost pressures as workers seek to restore lost purchasing power due to inflation.
Wage Gap, Inflation, Labor Costs, Real Wages, Purchasing Power
Multiple Chart
Accenture
Saved
The slide displays a column chart depicting net profit contribution over five years, paired with a pie chart outlining net operating income by category. The visuals are paired with clear descriptive texts.
Market Analysis and Trends
Financial Services
It outlines the company's profit growth over time and breaks down income by category. The pie chart shows the distribution of operating income, providing insights into the financial structure of the company’s commodities and global markets segment.
Net Profit, Operating Income, Commodities, Financial Analysis, Growth
Multiple Chart
Goldman Sachs
Saved
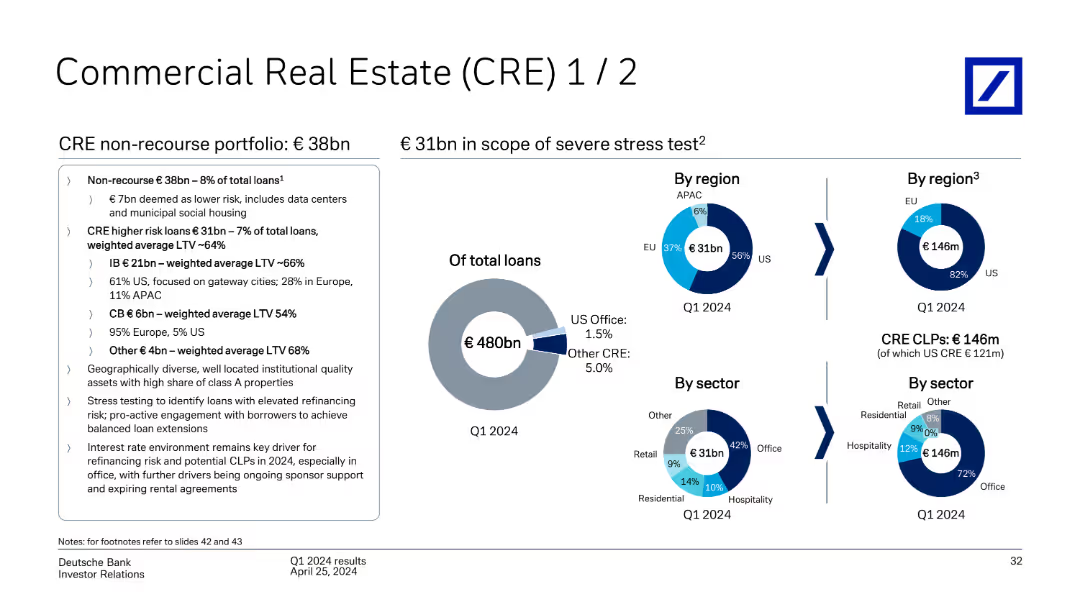
This slide contains pie charts and text detailing Deutsche Bank's CRE portfolio, including non-recourse loans and higher risk loans, segmented by region (US, EU, APAC) and sector (Office, Retail, etc.) as of Q1 2024.
Market Analysis and Trends
Real Estate & Construction
The slide provides an overview of Deutsche Bank's commercial real estate portfolio as of Q1 2024, highlighting non-recourse and higher risk loans, and breaking down the portfolio by region and sector.
commercial real estate, CRE, non-recourse loans, higher risk loans, region, sector, Deutsche Bank, Q1 2024
Multiple Chart
Deutsche Bank
Saved
The slide features a vertical column chart detailing the loss-absorbing capacity in various capital tiers, complemented by bullet points explaining the relevance and regulatory implications. The design is straightforward with a clear focus on data presentation.
Regulatory and Compliance
Financial Services
Explains the protective measures in place for depositors and counterparties through loss-absorbing capacity in financial contexts, crucial for discussions on financial stability and regulatory compliance.
financial protection, compliance, banking, capital
Mixed Chart
Deutsche Bank
Saved
The slide is divided into three sections: a left section with general statistics, a middle section with role distributions, and a right section with jurisdiction data, represented by bar charts.
Market Analysis and Trends
Financial Services
This slide summarizes the demographics of the survey respondents, including the size of family offices, their roles, and the jurisdictions they operate in within the APAC region.
demographics, APAC, survey, roles, jurisdictions
Multiple Chart
EY
Saved
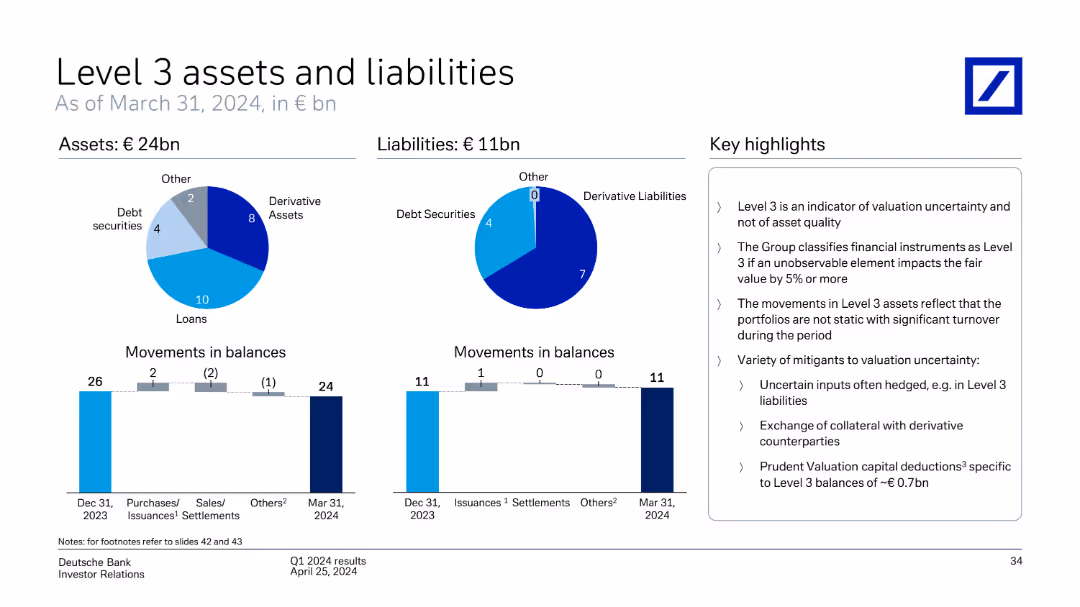
This slide includes pie charts and bar charts showing Deutsche Bank's Level 3 assets and liabilities, movements in balances, and key highlights as of March 31, 2024.
Financial Performance
Financial Services
The slide provides an overview of Deutsche Bank's Level 3 assets and liabilities as of March 31, 2024, detailing movements in balances and key highlights of the valuation and uncertainty of these assets.
Level 3 assets, liabilities, movements, balances, valuation, uncertainty, Deutsche Bank, March 31, 2024
Multiple Chart
Deutsche Bank
Saved
A bar chart with horizontal bars showing the importance of various macro risk factors to investors, including Federal Reserve policies and inflation. Includes percentage labels and change indicators.
Risk Assessment and Management
Financial Services
Summarizes investor perspectives on critical macroeconomic risks impacting investment decisions, highlighting the prominence of interest rates, inflation, and geopolitical concerns as top factors.
macro risks, investments, inflation, Federal Reserve
Single Chart
BCG
Saved
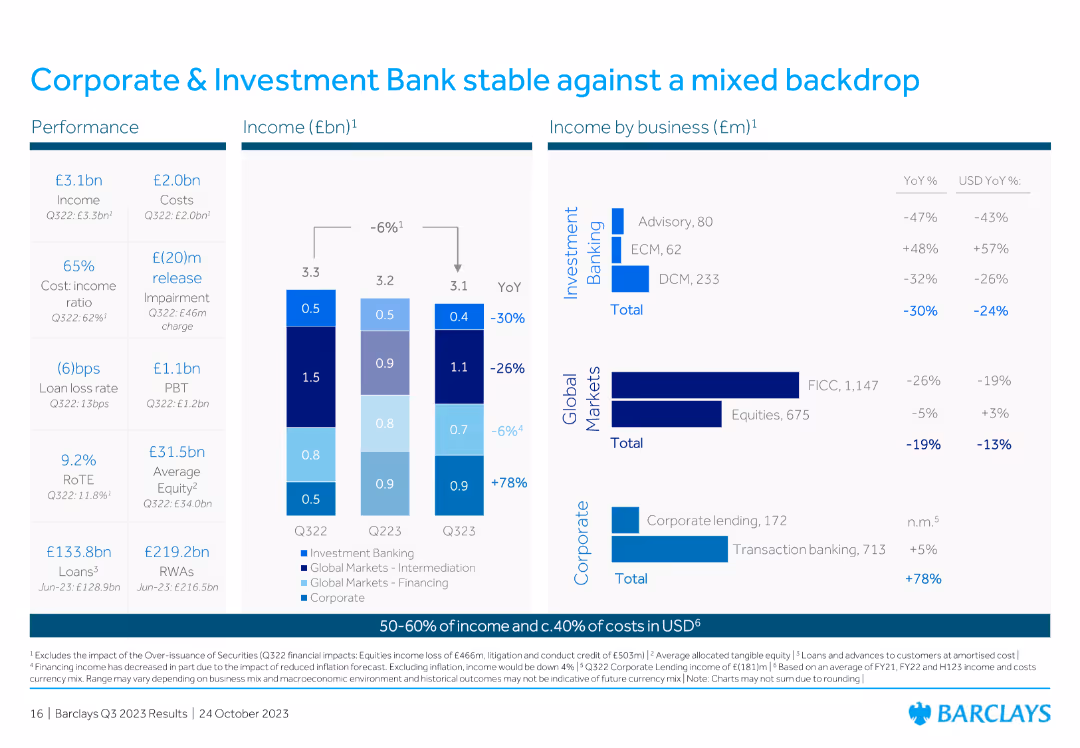
This slide contains a column chart showing income (£bn) and financial performance metrics for Corporate & Investment Bank from Q322 to Q323. It includes income by business segments such as investment banking and global markets.
Financial Performance
Financial Services
The slide reports on the stability of Barclays' Corporate & Investment Bank against a mixed backdrop for Q323, providing financial performance metrics and income breakdowns by business segments like investment banking and global markets.
stability, Q323, Corporate, Investment Bank, performance
Multiple Chart
Barclays
Saved
Previous
Next
If nothing, comes up, please save your slides first
Create a FREE account to continue browsing
Receive Instant Access to 1,000+ slides from companies like McKinsey, Google, and Goldman Sachs
First Name
Last Name
Email
Password
I agree to all
Terms & Privacy Policy
Thank you! Your submission has been received!
Oops! Something went wrong while submitting the form.
Have an account?
Sign in
Column Chart
Heatmap
Chevron
Org Chart
Infographic
Callouts
Timeline
List
Graphic
Picture
Process Flow
Diagram
Paragraph
Map
Table
Framework
Subtitle
Takeaway Box
Icon
Other Chart
Radar Chart
Waterfall Chart
Mekko Chart
Pie Chart
Scatter Plot
Line Chart
Bar chart
Bullet points