My Account
My Slides
Search by Category
Templates
Leave Feedback
Login
Logout
Get Started
Browse all Slides
Browse all Slides
Create a FREE Account
Instant access to 1,000+ real slides from top companies like McKinsey, BCG, Goldman Sachs, Google and many more!
First Name
Last Name
Email
Password
I agree to all
Terms & Privacy Policy
Thank you! Your submission has been received!
Oops! Something went wrong while submitting the form.
Have an account?
Sign in
Saved Slides
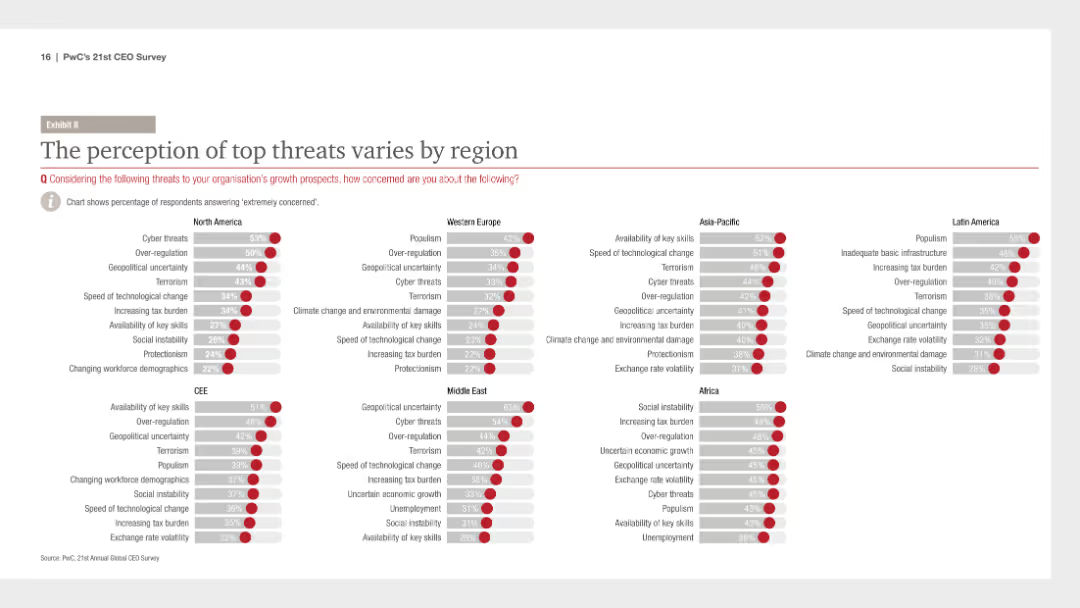
The slide uses a comparative layout with multiple charts to show the regional variations in the perception of top threats to organizational growth, with each region's top threats listed in a column chart.
Risk Assessment and Management
Financial Services
It highlights regional differences in threat perception, showing that CEOs in different regions prioritize different risks, useful for tailoring regional risk management strategies.
regional threats, perception, risk management, comparative analysis, regional variations, PwC, CEO Survey, top threats
Multiple Chart
PwC/Strategy&
Saved
The slide includes text on the left and a line graph on the right showing the revenue growth gap between leaders and laggards over several years.
Market Analysis and Trends
Financial Services
This slide contrasts the growth rates of leading and lagging organizations, illustrating how leaders have extended their revenue growth advantage over laggards.
revenue growth, leaders, laggards, financial performance, growth rates, post-pandemic recovery
Mixed Chart
Accenture
Saved
A three-column comparison of optical fiber, LPWAN, Wi-Fi 6, and 5G/6G cellular, contrasting current and previous generations.
Technology and Digital Transformation
Technology & Software
This slide compares current advanced connectivity technologies with previous generations, highlighting the advancements.
Connectivity, Optical Fiber, LPWAN, Wi-Fi 6, 5G, 6G, Technology Comparison
Header Vertical
McKinsey
Saved
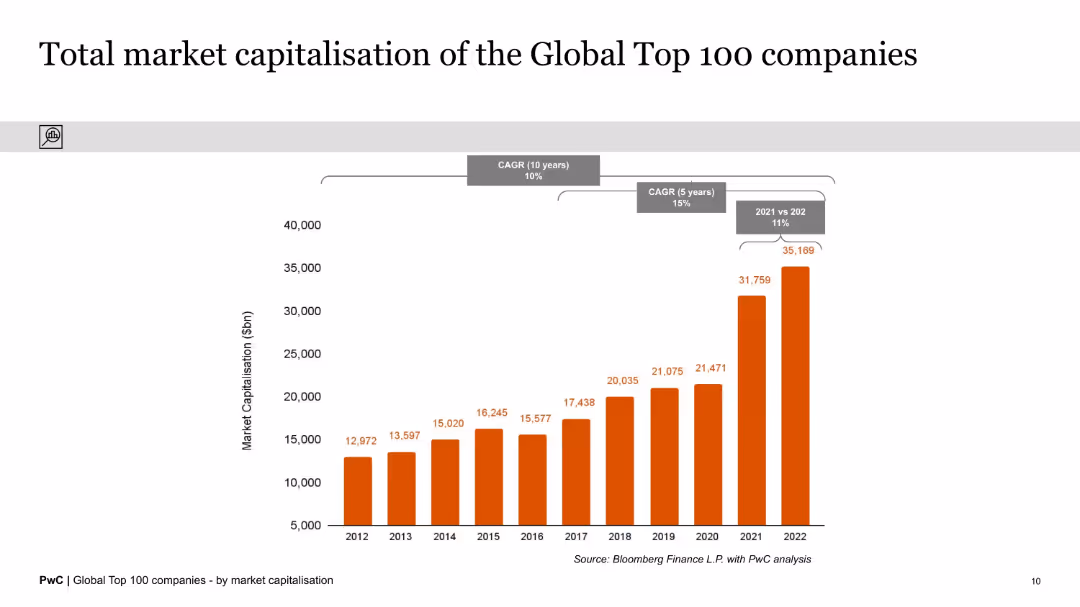
The slide features a column chart displaying the total market capitalization of the Global Top 100 companies from 2012 to 2022. The chart highlights significant growth over the period, with key CAGR figures noted.
Market Analysis and Trends
Financial Services
This slide illustrates the substantial increase in the total market capitalization of the Global Top 100 companies over a decade, emphasizing a 10-year CAGR of 10% and a 5-year CAGR of 15%. It provides a clear historical growth perspective.
Market Capitalization, Global Top 100, Growth, Historical Data, CAGR, Financial Analysis, Column Chart, Trends, Decade, Performance
Single Chart
PwC/Strategy&
Saved
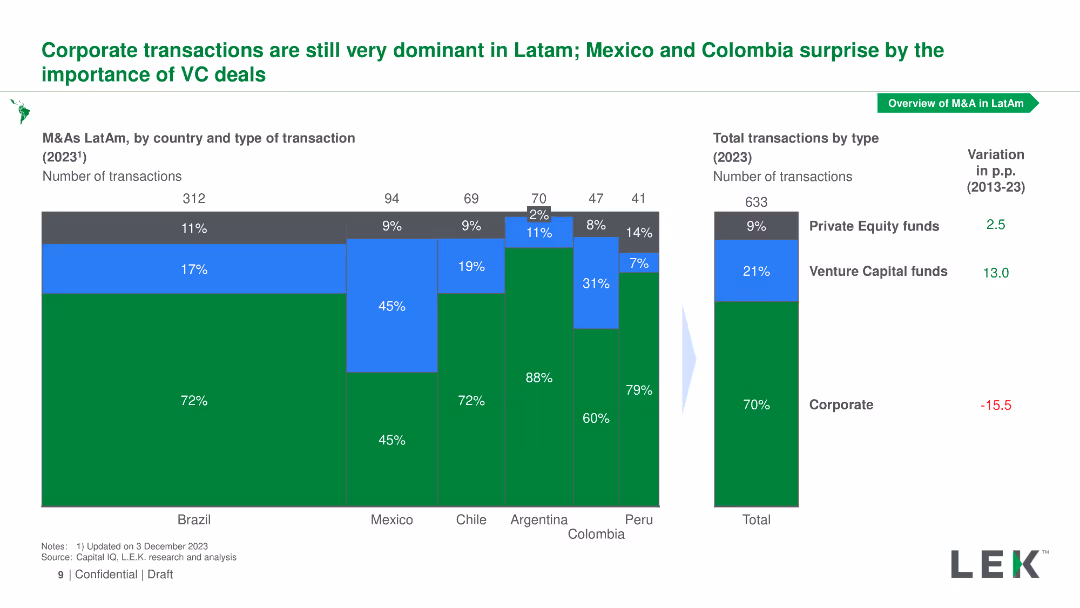
Stacked bar chart displaying M&A transaction types (corporate, private equity, venture capital) for Latin American countries in 2023, with total transactions and variation.
Market Analysis and Trends
Financial Services
Highlights the dominance of corporate transactions in Latin America, with notable VC activity in Mexico and Colombia, and presents total transactions by type for 2023.
M&As, transaction types, Latin America, VC activity, corporate transactions
Multiple Chart
LEK
Saved
Simple design focusing on a pie chart with a small legend describing regional differences in processes. The color green is used to denote different responses, facilitating an easy visual distinction between categories.
Regulatory and Compliance
Healthcare & Pharmaceuticals
Discusses the consistency of processes and technology for healthcare professional engagement across different regions. It highlights varying levels of adoption and challenges in standardizing practices globally, aiming to underline the importance of unified operational strategies.
healthcare processes, regional differences, operational consistency, survey analysis
Single Chart
Deloitte
Saved
The slide features three column charts showing adjusted revenues, operating expenses, and pre-tax loss progression over several quarters. Text details the strategies and outcomes related to operating expense reductions and portfolio valuation risks.
Financial Performance
Financial Services
Explains the improvement in adjusted pre-tax loss through the reduction of operating expenses and portfolio valuation risks. The column charts show the financial progression across quarters, supported by text that details the specific strategies implemented and their impact on financial performance.
Operating Expenses, Portfolio, Risk, Financial Performance, Reduction
Multiple Chart
Credit Suisse
Saved
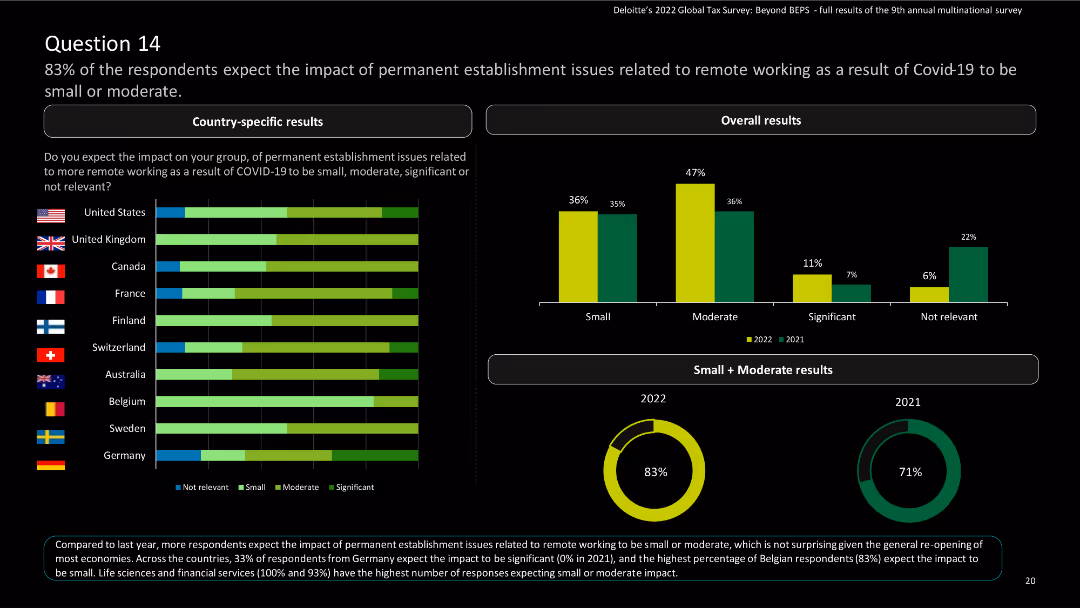
The slide contains horizontal bar charts for country-specific results and a column chart for overall results, along with a donut chart for trends.
Risk Assessment and Management
Financial Services
The slide summarizes survey findings on the impact of remote working on permanent establishment issues due to COVID-19. It includes country-specific and overall results, with trends from 2021 to 2022.
COVID-19, remote working, permanent establishment, financial services, survey results
Multiple Chart
Deloitte
Saved
Includes matrix charts and text blocks on talent management strategies, emphasizing identification and sourcing of critical skills. Visual elements are clear with green and gray highlights.
Human Resources and Talent Management
Education & Training
Discusses re-skilling and up-skilling strategies in line with business changes, focusing on digital and leadership skills essential for the future, and various sourcing strategies including tech-enabled recruiting.
Skills development, Talent management, Digital transformation, Recruitment
Framework
BCG
Saved
The slide compares feelings of burnout and comfort discussing mental health in the workplace between ethnic majorities and minorities, using bar graphs. The layout is clear and engaging.
Risk Assessment and Management
Professional Services
Addresses burnout levels among women in ethnic minority groups and their comfort in discussing mental health, providing insights for diversity and inclusion strategies.
burnout, ethnic minorities, mental health, workplace, discussion, 2022, health disparities, inclusion
Multiple Chart
Deloitte
Saved
The slide has two column charts and one line chart. The column charts compare gross fixed investment and gross debt as a percentage of GDP.
Financial Performance
Financial Services
This slide presents Mexico's public finances and private sector data, including gross debt, gross fixed investment, and public sector revenues and expenditures as GDP.
Mexico, public finance, private sector, GDP, investment, debt, revenues, expenditures
Multiple Chart
JP Morgan
Saved
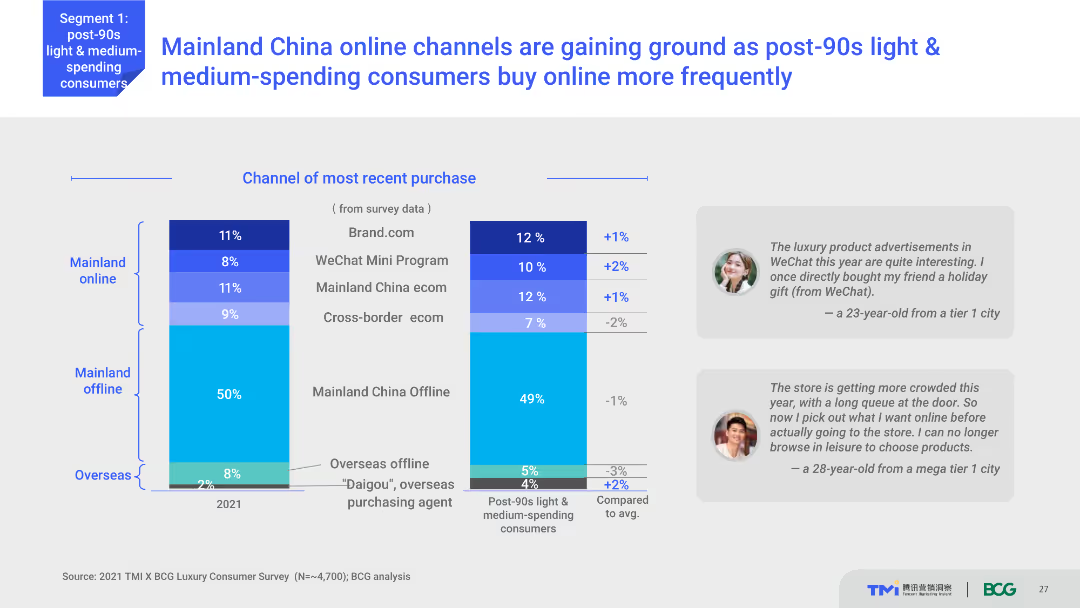
Column chart showing the most recent purchase channels for Mainland China and Overseas. The chart compares percentages between online and offline purchases in 2021. Text boxes with user quotes are placed beside the chart.
Market Analysis and Trends
Retail & E-commerce
Shows the shift in purchase behavior of post-90s light and medium-spending consumers in Mainland China towards online channels. Indicates the percentages of purchases through different online and offline channels.
Online shopping, consumer behavior, China, retail trends, WeChat Mini Program
Multiple Chart
BCG
Saved
This slide includes a map of Europe with highlighted countries that were deeply analyzed in the survey. The map uses shades of pink and red to denote the depth of analysis per country.
Industry Overview
Professional Services
Provides a geographical overview of the countries involved in a Europe-focused survey, highlighting the depth of analysis conducted in certain countries. Used to set the context for discussing detailed findings in subsequent slides.
survey, Europe, country analysis, data depth
Graphic
PwC/Strategy&
Saved
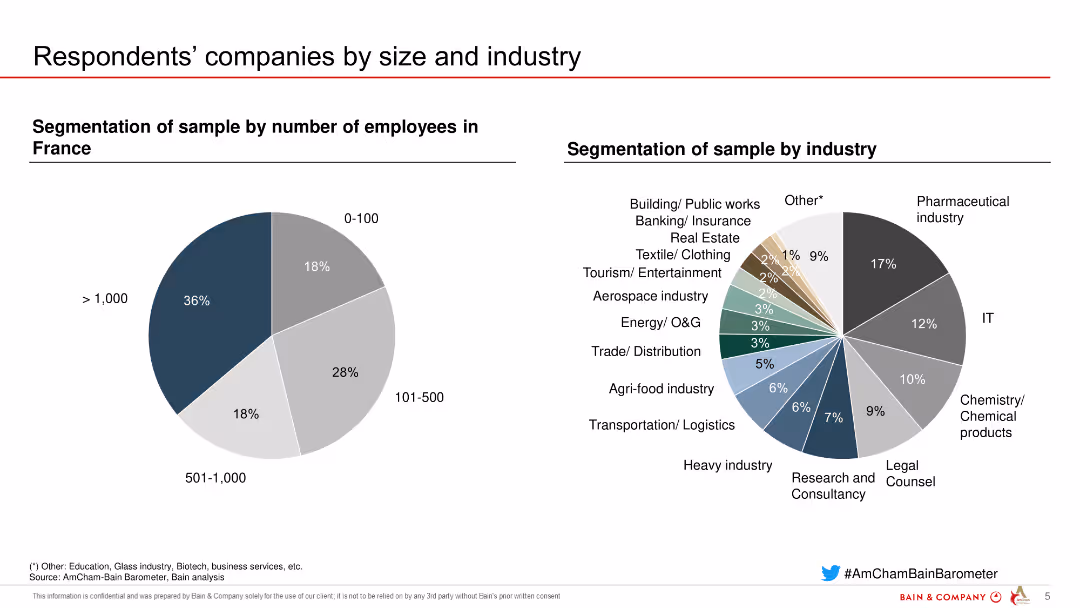
The slide has two pie charts. The left chart shows the segmentation of companies by number of employees, while the right chart depicts the segmentation by industry. Different colors are used for each segment.
Market Analysis and Trends
Professional Services
The slide provides a breakdown of respondents' companies by size and industry, highlighting the diversity of the sample and the representation across various sectors.
company size, industry, segmentation, pie charts, survey, sample diversity
Multiple Chart
Bain
Saved
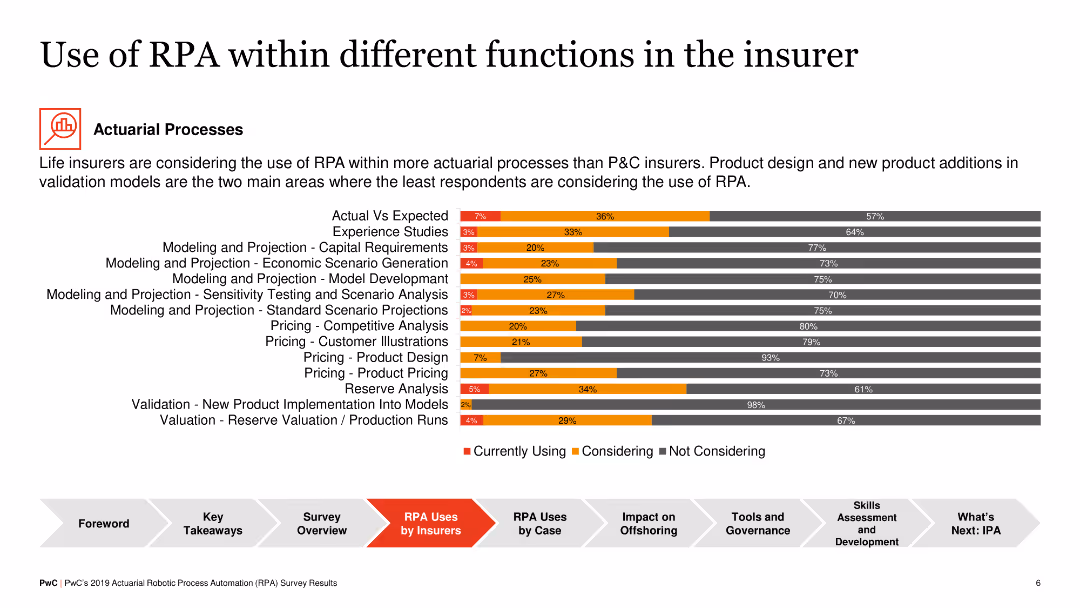
This slide includes a bar chart showing the use of RPA within different actuarial processes in insurers, including experience studies, capital requirements, economic scenario generation, and various pricing models.
Technology and Digital Transformation
Financial Services
The slide provides detailed insight into how life insurers are integrating RPA into actuarial processes, with specific focus on areas like product design and model validation, and the level of adoption across these functions.
RPA, actuarial, insurers, bar chart, adoption
Single Chart
PwC/Strategy&
Saved
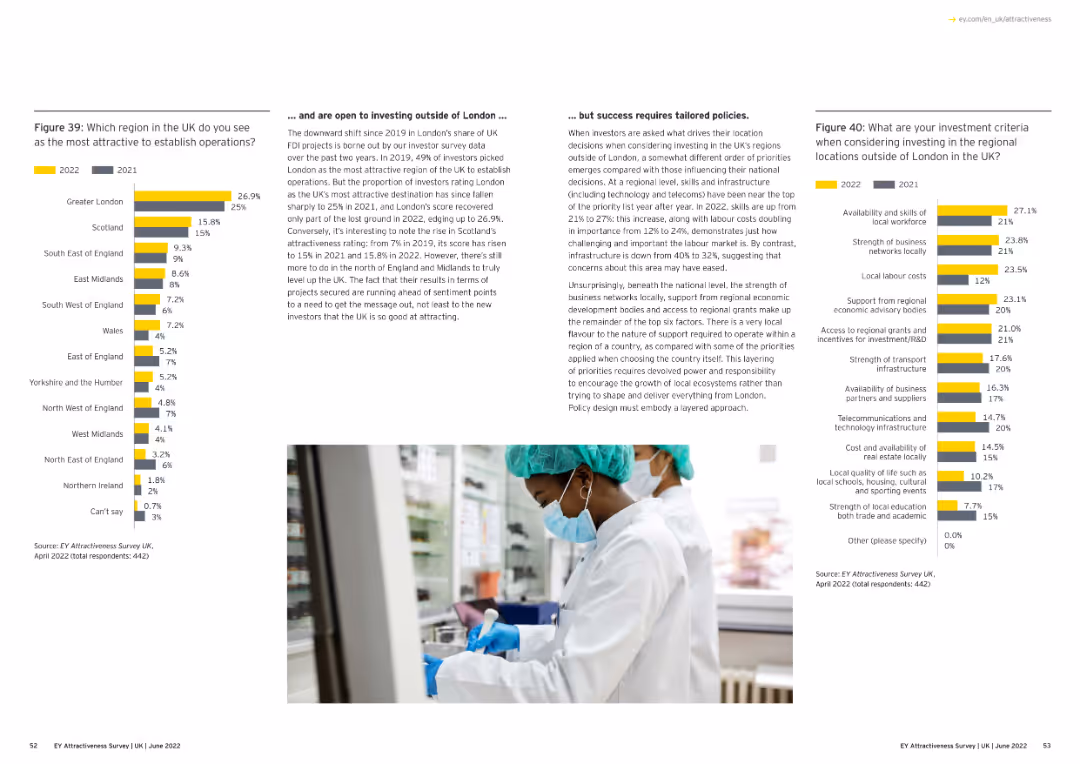
Text with bar charts. The charts compare regional attractiveness for establishing operations in the UK and investment criteria for regions outside London.
Market Analysis and Trends
Financial Services
The slide evaluates regional attractiveness within the UK, highlighting top regions and factors influencing investment decisions.
regional attractiveness, UK, investment criteria, column charts, London
Multiple Chart
EY
Saved
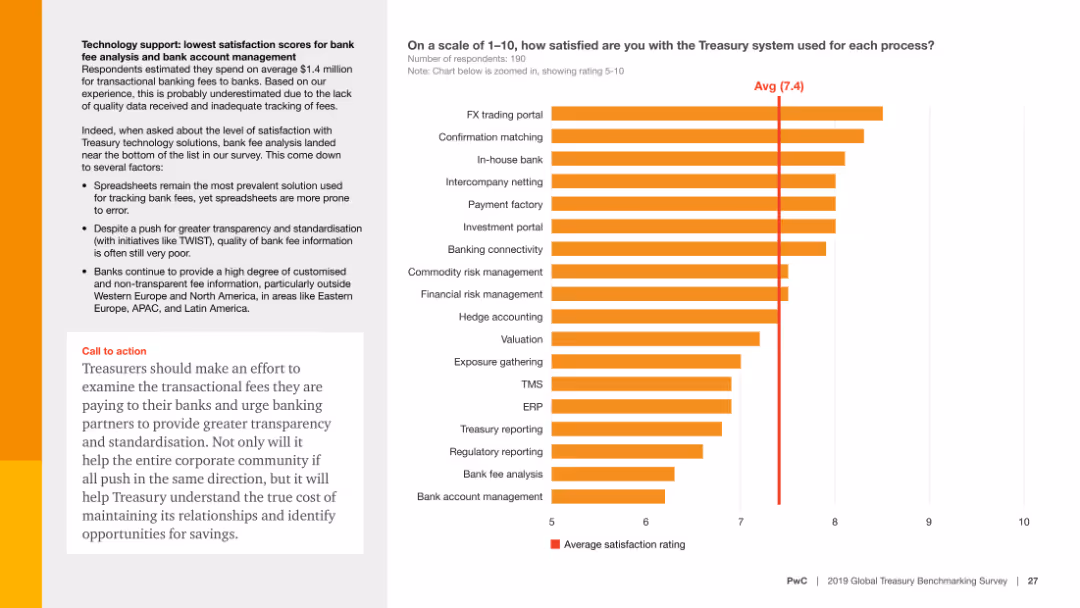
The slide includes a column chart showing satisfaction scores for different treasury processes and a text box with analysis and a call to action. The average satisfaction rating is highlighted.
Customer and Market Segmentation
Financial Services
The slide presents data on treasury satisfaction scores, highlighting low satisfaction in bank fee analysis and bank account management, and urges treasurers to push for greater transparency and standardization in their processes.
Technology support, satisfaction scores, treasury, bank fees, account management, financial services, transparency, standardization, customer feedback, survey
Mixed Chart
PwC/Strategy&
Saved
This slide features a matrix highlighting key actions for health organizations to improve consumer perceptions, categorized by performance and importance of health system aspects.
Strategic Planning
Healthcare & Pharmaceuticals
It identifies key opportunity areas for health organizations to improve consumer perceptions, focusing on aspects rated as important but with lower performance, such as mental health and sustainability.
health organizations, consumer perceptions, key actions, performance, importance
Mixed Chart
EY
Saved
Column chart detailing the adoption of digital solutions in patient administration, treatment, and post-discharge monitoring in SEA hospitals.
Technology and Digital Transformation
Healthcare & Pharmaceuticals
This slide highlights the higher adoption of digital solutions in SEA hospitals for patient management, treatment, and post-discharge monitoring.
Digital solutions, SEA hospitals, patient management, treatment, monitoring
Multiple Chart
LEK
Saved
Contains bulleted lists, icons, small text, two columns
Industry Overview
Technology & Software
Explains benefits of CAI in customer service
CAI, customer service, ML models, CSAT
Header Vertical
Deloitte
Saved
The slide is filled with textual information, utilizing bullet points, icons, and colored boxes to distinguish sections. A small chart is present in the top-left corner. The visual complexity is moderate.
Market Analysis and Trends
Industrial & Manufacturing
The slide details the economic impact of the Tempest programme on the UK economy, projecting job support and GVA contribution. It serves as an analytical overview for stakeholders to understand the financial benefits and job creation prospects.
GVA, Tempest programme, economy, jobs, UK
Text Only
PwC/Strategy&
Saved
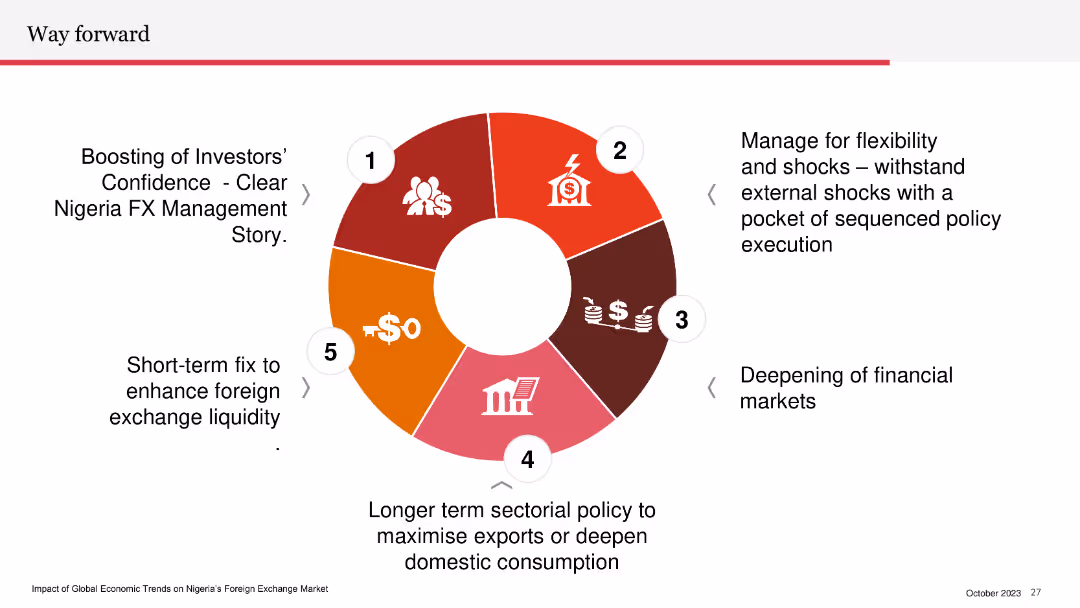
Circular diagram with five segments outlining steps for Nigeria's FX management strategy. Each segment has an icon and a brief description.
Strategic Planning
Financial Services
The slide outlines a strategic plan for managing Nigeria's foreign exchange market, focusing on boosting investor confidence, managing external shocks, deepening financial markets, sectorial policy, and enhancing foreign exchange liquidity.
strategic plan, FX management, investor confidence, financial markets, liquidity
Vertical Flow
PwC/Strategy&
Saved
Line graphs and scatter plot on a logarithmic scale, comparing the daily growth rates and cumulative confirmed cases across countries.
Regulatory and Compliance
Healthcare & Pharmaceuticals
Analyzes COVID-19 case growth rates and doubling times, indicating which countries are successfully flattening the curve as of April 2020.
COVID-19, statistics, health policy, growth rate, logarithmic scale, flattening the curve, countries, cases, progression
Multiple Chart
BCG
Saved
The slide features two column charts comparing different ratios, such as CET1 and leverage ratios, along with key liquidity management metrics like TLAC and LCR.
Strategic Planning
Financial Services
This slide emphasizes the importance of a strong balance sheet and prudent liquidity management as fundamental to the company’s success, showing key financial metrics.
balance sheet, CET1, leverage ratios, liquidity, TLAC
Multiple Chart
UBS
Saved
The slide features an area chart showing global energy sector CO2 emission reductions by measure (technology performance, electrification, etc.) up to 2070. The chart is color-coded and has a detailed legend.
Strategic Planning
Energy & Utilities
This slide emphasizes that CCUS technologies need to be combined with other solutions like electrification and technology improvements to decarbonize the energy sector effectively.
CCUS, decarbonization, energy sector, emission reductions, technology solutions
Mixed Chart
Kearney
Saved
Previous
Next
If nothing, comes up, please save your slides first
Create a FREE account to continue browsing
Receive Instant Access to 1,000+ slides from companies like McKinsey, Google, and Goldman Sachs
First Name
Last Name
Email
Password
I agree to all
Terms & Privacy Policy
Thank you! Your submission has been received!
Oops! Something went wrong while submitting the form.
Have an account?
Sign in
Column Chart
Heatmap
Chevron
Org Chart
Infographic
Callouts
Timeline
List
Graphic
Picture
Process Flow
Diagram
Paragraph
Map
Table
Framework
Subtitle
Takeaway Box
Icon
Other Chart
Radar Chart
Waterfall Chart
Mekko Chart
Pie Chart
Scatter Plot
Line Chart
Bar chart
Bullet points