My Account
My Slides
Search by Category
Templates
Leave Feedback
Login
Logout
Get Started
Browse all Slides
Browse all Slides
Create a FREE Account
Instant access to 1,000+ real slides from top companies like McKinsey, BCG, Goldman Sachs, Google and many more!
First Name
Last Name
Email
Password
I agree to all
Terms & Privacy Policy
Thank you! Your submission has been received!
Oops! Something went wrong while submitting the form.
Have an account?
Sign in
Saved Slides
Slide contains a large, colorful multi-line chart comparing foundational, programmatic, strategic, and integrated & sustainable D&I targets across industries. Icons and a strategic intent note are placed at the top. Line colors are distinct for each sector.
Strategic Planning
Retail & E-commerce
This slide analyzes how the retail sector compares with others like CGS, Auto/IE, LS/Pharma/Biotech, and Travel/Hospitality in establishing Diversity and Inclusion targets across four categories: Foundational, Programmatic, Strategic, and Integrated & Sustainable.
Retail, Diversity, Inclusion, Comparison, Sector, Targets, Performance, Strategic, Programmatic, Integrated
Mixed Chart
Accenture
Saved
This slide features four images, each representing a different development project, with corresponding cost estimates and timelines from 2022 to 2035. The images have an 'artist impression' label, indicating they are conceptual representations. There is also a footnote about the manager's monitoring of development under contract compliance with regulations.
Strategic Planning
Real Estate & Construction
Depicts a timeline of major construction projects within a real estate portfolio, showing investment in development projects currently underway or in planning stages.
Development Pipeline, Real Estate Projects, Construction Investment, Projected Costs, Timeline, Regulatory Compliance
Image
Morgan Stanley
Saved
This slide features a horizontal bar chart indicating the percentage of respondents hiring for various ethical positions in AI and technology. The chart is predominantly green and black, with bars labeled for clarity.
Human Resources and Talent Management
Technology & Software
The slide highlights the percentage of organizations hiring or planning to hire for various ethical positions in AI and technology, such as AI ethics researchers, compliance specialists, and policy analysts.
AI ethics, compliance, policy, hiring, chart
Mixed Chart
Deloitte
Saved
This slide includes two comparative charts depicting the expected changes in staffing levels and skill set requirements in risk management over the next five years.
Human Resources and Talent Management
Financial Services
It highlights the challenges and strategies related to staffing and talent management in risk management, detailing how companies plan to adapt their talent pools and resource allocation in response to market demands and operational needs.
staffing, talent management, risk management, skill sets, market demands
Multiple Chart
EY
Saved
The slide features a line chart comparing expected reductions in UK government spending. It includes commentary and implications for corporates.
Regulatory and Compliance
Government & Public Sector
This slide examines the potential contraction in UK public services spending due to government tax cuts. It discusses the impacts on businesses and household finances.
UK, public spending, government policy, financial analysis, regulatory impact
Mixed Chart
Accenture
Saved
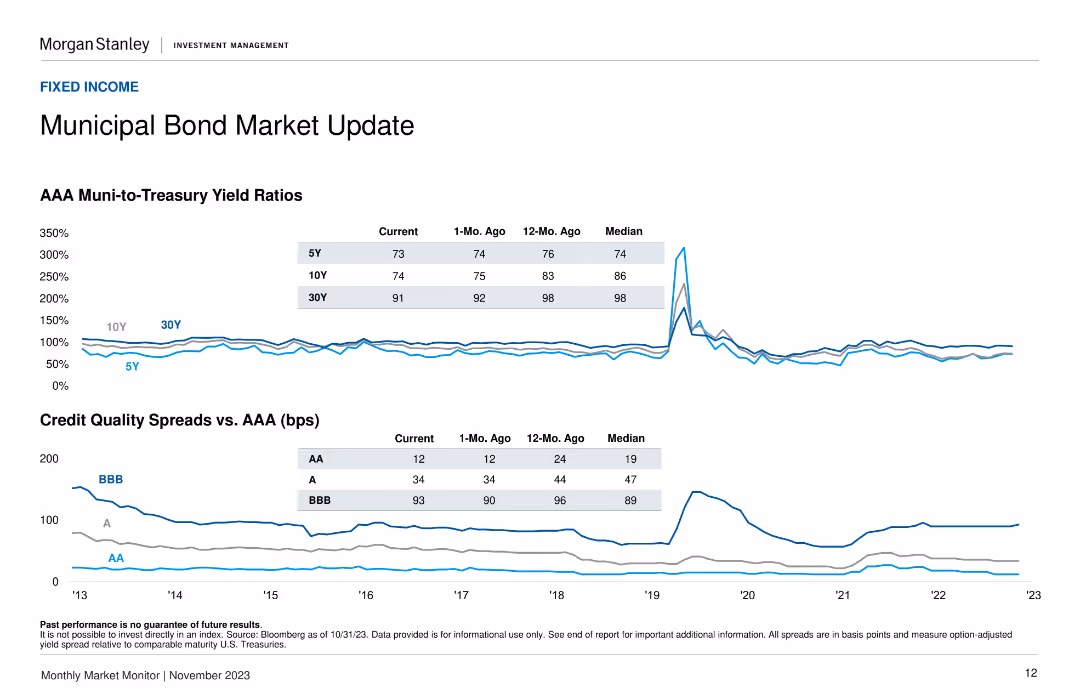
Line charts showing AAA muni-to-treasury yield ratios and credit quality spreads versus AAA.
Market Analysis and Trends
Financial Services
Offers insights into the municipal bond market by comparing muni-to-treasury yield ratios and credit quality spreads, helping assess municipal bond attractiveness.
Municipal bonds, yield ratios, credit
Multiple Chart
Morgan Stanley
Saved
Column chart showing nominal yields for different bond categories and their duration.
Market Analysis and Trends
Financial Services
Highlights nominal yields across different fixed income categories, comparing durations and maximum yields over the past 10 years.
fixed income, yields, bonds, duration, nominal
Multiple Chart
JP Morgan
Saved
This slide mirrors the layout of slide 1852 with the same title, list, and background design. However, no particular point is highlighted on this slide.
Strategic Planning
Professional Services
This slide serves a similar purpose as slide 1852, possibly used earlier in a presentation to introduce the upcoming discussion points on digitization without emphasizing a particular focus area.
digitization, opportunities, challenges, introduction, strategic planning, presentation
Agenda
McKinsey
Saved
The slide features a column chart on the right displaying various reasons for holding stablecoins. The left side includes categories with percentage bars. The layout is moderate in complexity.
Market Analysis and Trends
Financial Services
The slide explains the reasons why people hold stablecoins, with diversification, lower risk, and ease of payment being the top reasons. It targets current crypto asset holders.
stablecoins, crypto, investment, risk, reasons
Multiple Chart
IPSOS
Saved
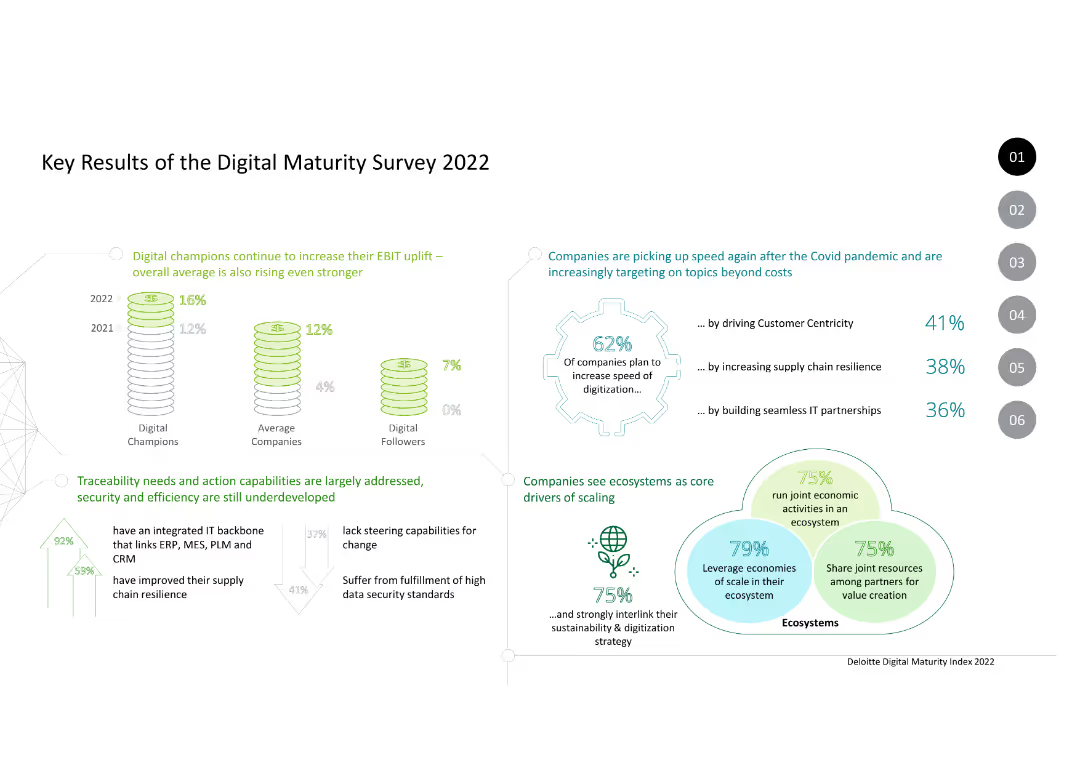
Column charts and text. Data on EBIT uplift, digitization speed, ecosystem drivers, and digital maturity levels of companies.
Market Analysis and Trends
Technology & Software
Summarizes the key results of the Digital Maturity Survey 2022, highlighting trends in digital transformation and ecosystem scaling among companies.
digital maturity, EBIT uplift, digitization, ecosystem, trends, survey, 2022, companies, technology
Mixed Chart
Deloitte
Saved
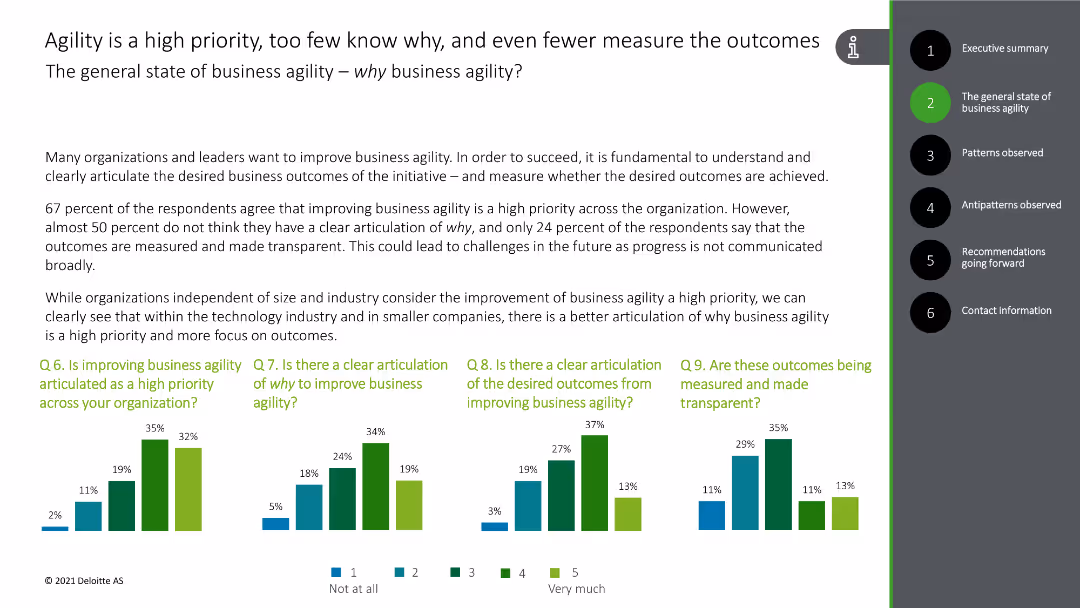
This slide contains a column chart with various shades of green and blue bars indicating the levels of priority and clarity of business agility across organizations.
Strategic Planning
Professional Services
The slide discusses the importance of business agility, highlighting survey results on organizational priorities and clarity regarding business agility outcomes.
business agility, priority, clarity, outcomes, survey results
Multiple Chart
Deloitte
Saved
Slide compares strategic vs. operational levers for profitability through side-by-side text columns with bulleted commentary and visual indicators for potential impact.
Operational Efficiency
Financial Services
Analyzes how strategic and operational decisions impact company profitability and returns, aimed at decision-makers evaluating business strategies.
profitability, strategic, operational, roll-up, pricing, route optimization, cash management, back-office consolidation, value-added services, partnerships
Table
EY
Saved
The slide includes line charts comparing AAA muni-to-treasury yield ratios and credit quality spreads vs. AAA for different rating categories (AA, A, BBB).
Market Analysis and Trends
Financial Services
The slide offers insights into municipal bonds, focusing on yield ratios and credit spreads. Useful for evaluating municipal bond investments.
municipal bonds, yield ratios, credit quality, spreads, AAA, financial analysis
Multiple Chart
Morgan Stanley
Saved
The slide uses bullet points and column charts to present financial results and losses. The layout is information-dense.
Financial Performance
Financial Services
Focused on the "Corporate & Other" segment of a financial institution, this slide shows detailed financial results including profits and losses, adjustments, and expenses. It is intended for financial analysts and management to evaluate the impact of non-core activities on the overall financial health of the institution, with specific attention to shareholder expenses, legacy portfolios, and valuation adjustments.
Corporate Finance, Losses, Profits, Financial Reporting, Analysis
Mixed Chart
Deutsche Bank
Saved
The slide features a column chart illustrating the number of disclosed education deals in Africa from 2004-2018. The chart shows significant growth, with detailed annotations about the largest deals and their values. The right side lists major transactions, including target companies and bidders.
Investment Analysis
Education & Training
This slide examines investment activity in the African education sector, highlighting a 24X growth in disclosed deals from 2004-2018. It provides a detailed look at the largest transactions, showcasing major bidders and their target companies, indicating significant investment interest in education.
investment, education, Africa, deals, growth
Mixed Chart
LEK
Saved
The slide includes circular diagrams and bar charts analyzing the adoption of self-service technologies in different regions. It has a clean, modern look using blue and green tones.
Technology and Digital Transformation
Telecommunications
Discusses the increasing role and impact of self-service options in enhancing customer satisfaction and operational efficiency. Particularly relevant for sectors focusing on digital solutions and customer autonomy, such as technology and professional services.
self-service, technology adoption, customer satisfaction, operational efficiency, digital solutions
Multiple Chart
Deloitte
Saved
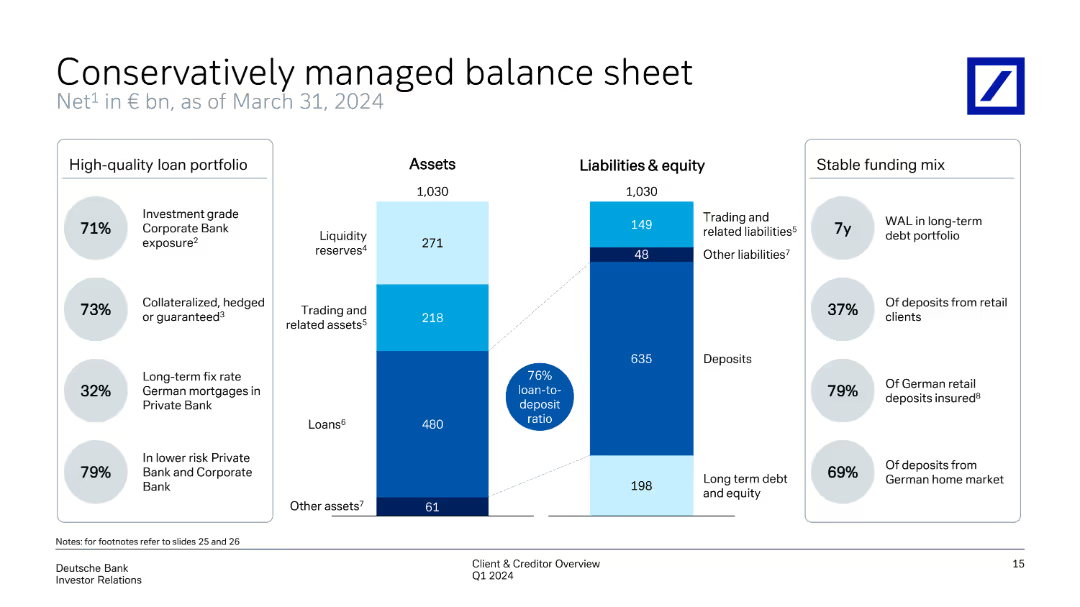
The slide displays a divided column chart representing assets and liabilities & equity as of March 31, 2024. The left side includes a high-quality loan portfolio with percentages, while the right side shows a stable funding mix with key percentages.
Risk Assessment and Management
Financial Services
Highlights the bank's managed balance sheet, detailing asset distribution and liabilities, alongside a stable funding mix. The slide underscores high-quality loan portfolio and the overall balance between assets and liabilities, ensuring financial stability.
balance sheet, assets, liabilities, loan portfolio, funding mix
Multiple Chart
Deutsche Bank
Saved
Featuring a circular graph with variously sized and colored bubbles, it visualizes data on innovation, interest, investment, and adoption by technology trend.
Technology and Digital Transformation
Professional Services
Continuation of the introduction, this slide provides quantitative data on technology trends using an innovative graph style.
Innovation, Investment, Technology, Trends, Data, Analysis, AI, Energy
Single Chart
McKinsey
Saved
A column chart comparing active weights of China/HK by category and domicile for US and non-US managers in different fund categories from Oct-22 to Jan-23.
Market Analysis and Trends
Financial Services
The slide analyzes the varying positions of China/HK in active weights across different managers and fund categories, highlighting significant differences.
China, HK, Fund Categories, Active Weights, Managers
Multiple Chart
Morgan Stanley
Saved
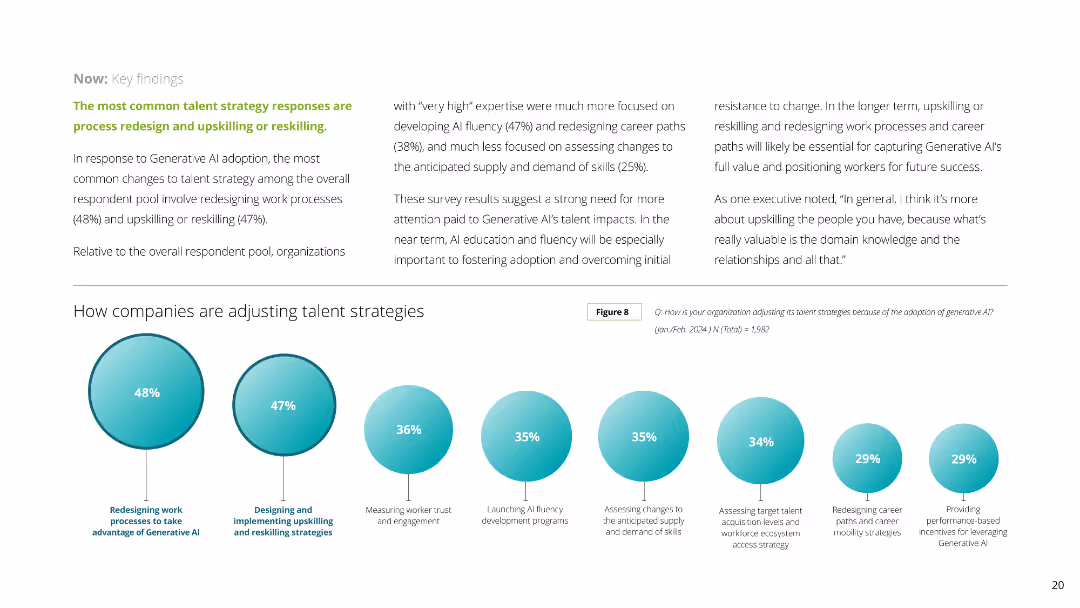
The slide contains a column chart and circular infographics displaying various percentages related to talent strategy responses. The layout is moderately complex with balanced use of visuals and text.
Human Resources and Talent Management
Professional Services
The slide discusses how companies are adjusting their talent strategies in response to Generative AI, highlighting redesigning work processes and upskilling/reskilling. It includes survey results with specific percentages for different strategies.
Generative AI, talent strategy, upskilling, reskilling, survey results, work processes, professional services, HR, workforce, engagement
Mixed Chart
Deloitte
Saved
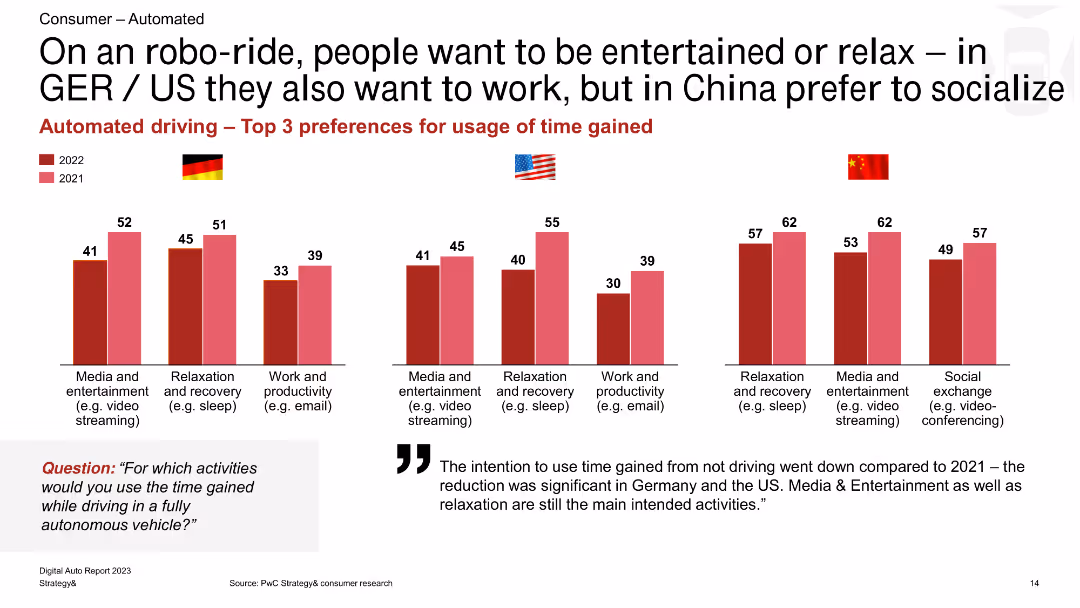
This slide includes a series of column charts showing the top three preferences for activities during autonomous rides in Germany, the US, and China for 2021 and 2022.
Market Analysis and Trends
Transportation & Logistics
The slide highlights differences in preferred activities during autonomous rides, with entertainment and relaxation favored in Germany and the US, and social exchange preferred in China.
robo-ride, preferences, entertainment, relaxation, work, socialization, Germany, US, China, autonomous vehicles
Multiple Chart
PwC/Strategy&
Saved
Composed of bullet points and a table, the slide compares the company's 2022 key performance indicators against targets set during investor day, with additional notes for context.
Investment Analysis
Financial Services
The slide benchmarks the company's recent performance against the medium-term goals communicated to investors, covering different business areas and their respective KPIs. It's a tool for investors and analysts to assess progress and strategize accordingly.
KPIs, investor targets, performance benchmarking, business analysis
Table
Citigroup
Saved
Contains a flowchart summarizing the steps taken to identify and implement eco-design options for ground stations, from brainstorming to evaluation of solutions.
Product and Service Analysis
Environmental Services & Sustainability
Describes the methodology used in reducing environmental impacts of ground stations through eco-design, involving multiple stakeholders and solution assessments.
eco-design, environmental impact, ground stations, mitigation, flowchart, brainstorming, solution assessment, sustainability
Linear Flow
Deloitte
Saved
A column chart showing reasons for buying investments during the pandemic. There is a large 40% graphic to the left indicating the percentage of buyers, and a list of reasons with bars on the right.
Market Analysis and Trends
Financial Services
The slide explains why Canadian investors bought investments during the pandemic, highlighting regular contributions, undervalued assets, high returns, guarantees, lower risks, and other reasons.
investments, pandemic, buying, Canadian, reasons
Multiple Chart
IPSOS
Saved
The slide features infographics and charts predicting future carbon farming benefits in Maranoa, including additional ACCUs generated, revenue, and supported jobs.
Client Case Studies
Agriculture & Food Production
This slide forecasts the potential future of Maranoa through carbon farming, estimating additional ACCUs generated, revenue growth, and job support from 2021 to 2030. It highlights various carbon farming practices and their economic impact.
Carbon farming, Maranoa, Future projections, Revenue, Jobs
Mixed Chart
EY
Saved
Previous
Next
If nothing, comes up, please save your slides first
Create a FREE account to continue browsing
Receive Instant Access to 1,000+ slides from companies like McKinsey, Google, and Goldman Sachs
First Name
Last Name
Email
Password
I agree to all
Terms & Privacy Policy
Thank you! Your submission has been received!
Oops! Something went wrong while submitting the form.
Have an account?
Sign in
Column Chart
Heatmap
Chevron
Org Chart
Infographic
Callouts
Timeline
List
Graphic
Picture
Process Flow
Diagram
Paragraph
Map
Table
Framework
Subtitle
Takeaway Box
Icon
Other Chart
Radar Chart
Waterfall Chart
Mekko Chart
Pie Chart
Scatter Plot
Line Chart
Bar chart
Bullet points