My Account
My Slides
Search by Category
Templates
Leave Feedback
Login
Logout
Get Started
Browse all Slides
Browse all Slides
Create a FREE Account
Instant access to 1,000+ real slides from top companies like McKinsey, BCG, Goldman Sachs, Google and many more!
First Name
Last Name
Email
Password
I agree to all
Terms & Privacy Policy
Thank you! Your submission has been received!
Oops! Something went wrong while submitting the form.
Have an account?
Sign in
Saved Slides
Includes multiple pie charts and a column chart detailing the deposit and loan distribution by business type and product, with annotations explaining key strategies.
Financial Performance
Financial Services
This slide details the bank's deposit and loan structures as of Q1 2023, highlighting diversity and stability across different banking sectors and products, and outlines how these are managed to mitigate risks and ensure growth.
Deposits, Loans, Banking, Diversification, Q1 2023, Risk Management, Stability, Growth
Multiple Chart
Deutsche Bank
Saved
A straightforward design displaying multiple column charts comparing percentages of users willing to pay for various features like verification, ad reduction, and increased post reach. Accompanied by descriptive texts and percentage labels.
Market Analysis and Trends
Technology & Software
Highlights user attitudes towards paying for additional features on social media platforms, focusing on verification, fewer ads, and boosted post reach. It explores the implications for social media business models.
social media, verification, monetization, user engagement, digital marketing, business model, advertising, user preferences, market research, analytics
Mixed Chart
Deloitte
Saved
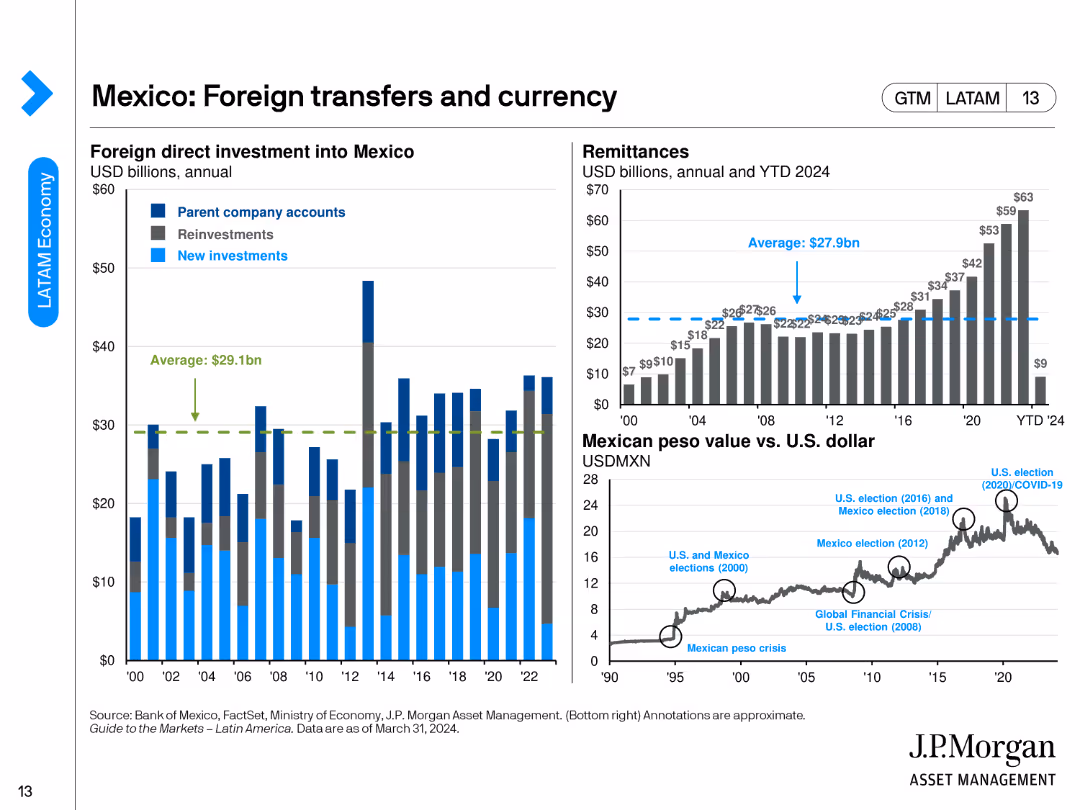
The slide features three column charts and a line chart. The charts show foreign direct investment, remittances, and Mexican peso value vs. the U.S. dollar.
Market Analysis and Trends
Financial Services
This slide details foreign direct investment into Mexico, remittances, and the value of the Mexican peso versus the U.S. dollar, showcasing economic and currency trends.
Mexico, foreign investment, remittances, peso value, currency trends
Multiple Chart
JP Morgan
Saved
The slide includes two main visual components: a pie chart showing the percentage of people increasing their protein intake, and a column chart comparing the volume percentage change in total edible products versus total protein. The design is clean, using blues and neutrals to highlight key data.
Market Analysis and Trends
Agriculture & Food Production
Analyzes consumer trends in protein consumption and its impact on market growth. The data suggests a growing consumer preference for protein-rich diets, which is driving retail sales in the protein segment. This insight could be pivotal for businesses looking to capitalize on health and wellness trends.
Protein, Market Growth, Trends, Health, Consumer Behavior
Multiple Chart
Barclays
Saved
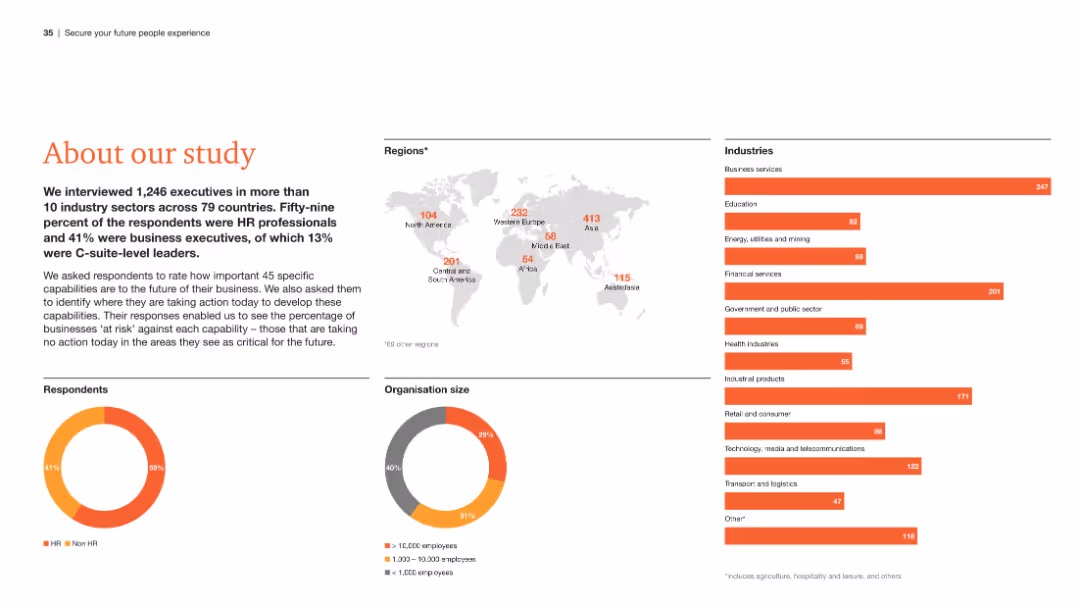
The slide presents an overview of the study, including a world map showing respondent distribution, pie charts of respondent roles and organization sizes, and a list of industries surveyed.
Strategic Planning
Professional Services
This slide provides a summary of the study's scope, detailing the demographics of respondents, the regions and industries covered, and the roles of the participants.
Study overview, respondent demographics, regions, industries, roles
Multiple Chart
PwC/Strategy&
Saved
Displays a multi-layered diagram categorizing operational maturity into four levels: Stable, Efficient, Predictive, and Future-ready. Each level is described with respect to technology, process, data, and talent.
Operational Efficiency
Professional Services
Describes different levels of operational maturity in organizations and their implications on business efficiency and future readiness. Useful for consultants and managers aiming to enhance operational strategies.
Operational Maturity, Business Strategy, Efficiency
Table
Accenture
Saved
This slide consists of multiple horizontal bar charts detailing the percentage of consumers willing to pay more for various types of sustainable food.
Customer and Market Segmentation
Agriculture & Food Production
Shows consumer willingness to pay premiums for food with attributes like GMO-free, fair trade, and organic. Useful for understanding market preferences for sustainable products.
Consumer, Food, Sustainable, Premiums, Preferences
Single Chart
Deloitte
Saved
Bar chart illustrating the split of gross debt by maturity year from 2023 to 2028, with significant amounts maturing in 2022 and 2025, represented in millions of euros.
Financial Performance
Financial Services
This slide presents a breakdown of the company's debt maturity schedule, indicating the years when significant debt repayments are due, aiding in financial planning and risk assessment.
debt maturity, financial planning, repayment schedule, euros, financial analysis
Single Chart
IPSOS
Saved
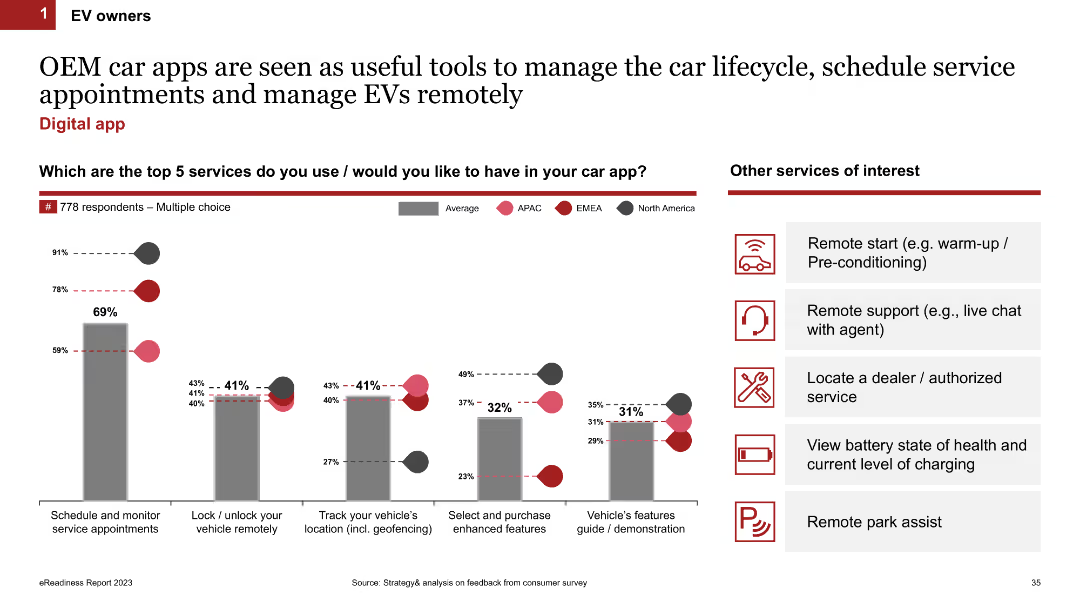
The slide features a column chart showing the top five services EV owners use or would like to have in their car app, with regional breakdowns (APAC, EMEA, North America). It also includes icons representing additional services of interest.
Technology and Digital Transformation
Transportation & Logistics
This slide discusses the popularity and desired features of OEM car apps for EV owners, with a focus on managing the car lifecycle and scheduling service appointments. It highlights regional preferences and additional desired services.
car apps, OEM, lifecycle management, services, regional differences, EV owners
Mixed Chart
PwC/Strategy&
Saved
Comprised of three sectioned column charts detailing investment expenses in different areas. The design is structured with color coding for ease of comparison and interpretation.
Investment Analysis
Financial Services
JPMorgan Chase's slide presents a multi-year investment strategy across business sectors, technology, and marketing. It demonstrates the firm's commitment to growth and adaptation in response to evolving market needs.
Investment Strategy, Long-term Success, Business Growth, Technology, JPMorgan Chase
Multiple Chart
JP Morgan
Saved
Features a line graph depicting various business strategies companies are considering in response to COVID-19, like hiring freezes and salary reductions, overlaid with a large COVID-19 virus image for impact.
Human Resources and Talent Management
Professional Services
Explores how companies plan to adapt their talent strategies in light of the pandemic, with a focus on reducing costs. Useful for HR and strategic planning.
COVID-19, talent acquisition, business strategy, cost reduction, planning
Single Chart
McKinsey
Saved
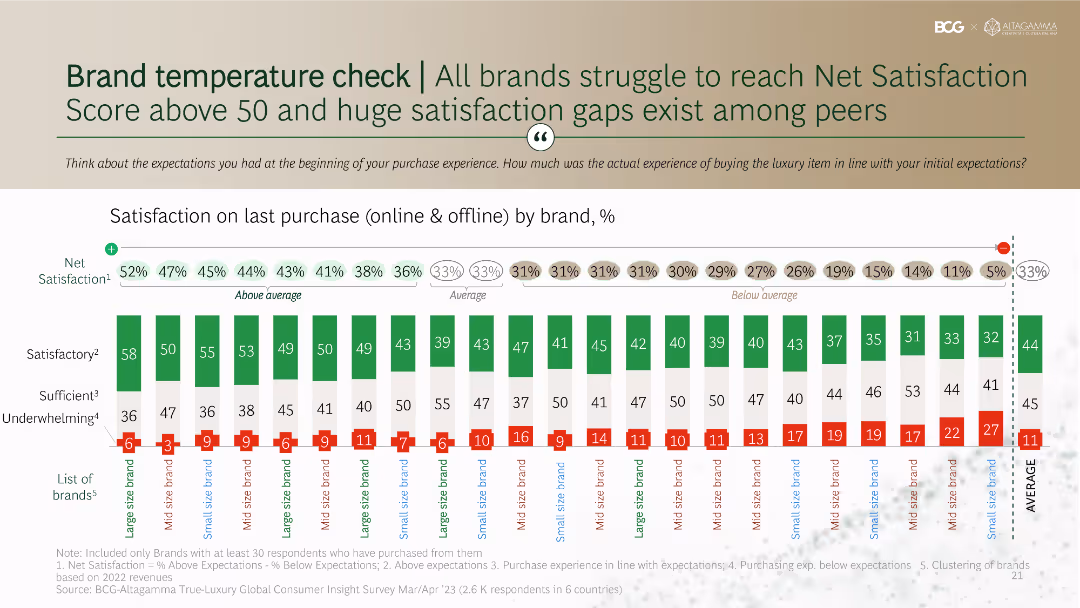
The slide is divided into two sections, comparing satisfaction between offline and online experiences. The left side shows offline satisfaction at 100, and the right side shows online satisfaction at 125.
Customer and Market Segmentation
Consumer Goods
Compares satisfaction levels of luxury brands' offline experiences to their online counterparts, indicating higher satisfaction with online services.
Satisfaction, online, offline, luxury, comparison
Single Chart
BCG
Saved
This slide includes a line chart tracking Total Shareholder Returns for US non-financial companies, categorized by high and low resilience.
Risk Assessment and Management
Financial Services
Analyzes shareholder returns over two decades, showing how companies with higher resilience tend to marginally outperform across economic cycles.
Shareholder returns, Resilience, Economic cycles, US companies, High risk, Performance analysis
Single Chart
Bain
Saved
Slide with column chart showing 'Global Banking & Markets Net Revenues' segmented by revenue types, a detailed financial results table, and highlighted textual analysis of key figures.
Financial Performance
Financial Services
Focuses on the financial results and revenue specifics of the Global Banking & Markets sector, providing insights on performance factors, investment banking fees, and revenue streams. Designed for detailed market analysis and strategic planning.
Global Banking, Market Revenue, Investment Fees, FICC, Equities, Net Revenues, Financial Performance, Market Trends
Mixed Chart
Goldman Sachs
Saved
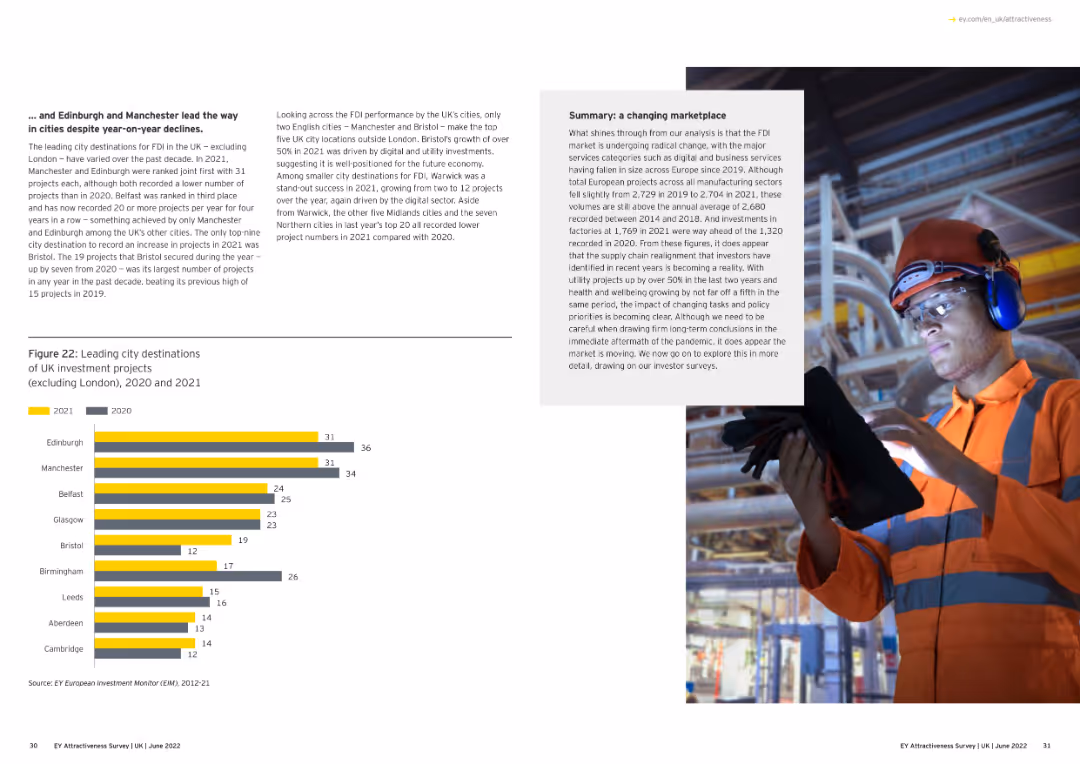
Displays a pie chart representing the origin of investment projects into the UK in 2021, with segments for different contributing countries.
Market Analysis and Trends
Financial Services
This slide highlights the countries contributing to investment projects in the UK in 2021, providing insight into international investment sources.
investment origin, UK, 2021, pie chart, countries
Mixed Chart
EY
Saved
Uses a green circular diagram to depict the ideal organizational culture for enduring cost management, accompanied by text sections describing elements of the culture such as 'People engagement'.
Organizational Structure and Change
Professional Services
Explains how effective cost management is supported by organizational culture, highlighting aspects like leadership, execution, and employee engagement crucial for sustainable cost improvements.
cost management, organizational culture, leadership, sustainability
Framework
BCG
Saved
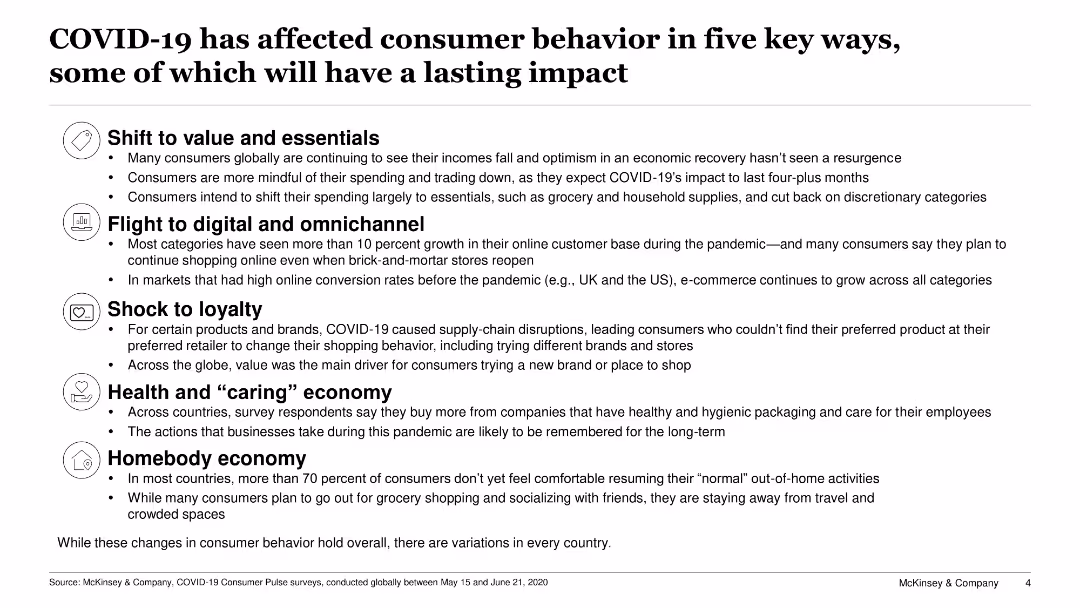
Lists five key impacts of COVID-19 on consumer behavior with bullet points for each, including value shift, digital shift, loyalty shock, health economy, and homebody economy.
Strategic Planning
Consumer Goods
The slide details the long-term impacts of COVID-19 on consumer behavior, emphasizing shifts towards value and essentials, digital adoption, changes in loyalty, and health-focused buying.
COVID-19, consumer behavior, long-term impact, digital shift, health economy
Header Vertical
McKinsey
Saved
The content slide includes a photo of a person gardening, accompanied by three line graphs showing employment rate scenarios for Africa, India, and Southeast Asia. The visual layout is clear, with the photo providing contextual background.
Human Resources and Talent Management
Professional Services
This slide focuses on the employment rate changes in Africa, India, and Southeast Asia due to the green transition. It highlights the role of green jobs in maintaining employment levels and stresses the importance of supporting the labor market transition to avoid social unsustainability and labor shortages.
Employment, Africa, India, Southeast Asia, Green Jobs
Multiple Chart
EY
Saved
The slide has a professional layout with dense texts showcasing survey data on workplace mental health across Gen Z and Millennials. It features a clean design with text annotations and color-coded elements for clarity.
Market Analysis and Trends
Professional Services
This slide presents data from a 2023 survey on Gen Z and Millennials' perspectives on workplace mental health. It compares the utilization of mental health resources and the perceived effectiveness of workplace policies.
workplace health, mental health, Gen Z, Millennials, resources, utilization, survey, policies
Mixed Chart
Deloitte
Saved
The slide contains several data blocks with statistics on employer and workforce sentiments regarding returning to work post-pandemic. It includes bar charts and text descriptions to explain the trends.
Market Analysis and Trends
Professional Services
The slide examines trends in workforce and employer sentiments about returning to work after the pandemic. It highlights key statistics, such as the percentage of CEOs expecting remote work to continue and workers' preferences for remote work. This data is critical for planning future workplace strategies and policies.
Workforce, Employer Sentiment, Remote Work, Trends, Statistics
Mixed Chart
Deloitte
Saved
This slide displays a series of bar graphs illustrating the potential increase in tax credit bonuses for renewable investments, categorized by conditions like domestic content and community impact.
Market Analysis and Trends
Energy & Utilities
Details the tax credit structure for renewable energy investments under new legislative acts, focusing on how bonuses can enhance base incentives. Useful for discussions on fiscal incentives and their impact on clean energy investments.
renewable energy, tax credits, investment cost, fiscal policy
Mixed Chart
BCG
Saved
Contains a column chart showing IFRS derivative trading assets and their impacts. Simple layout with key highlights on the side.
Financial Performance
Financial Services
Presents Q1 2023 IFRS derivative trading assets and the effect of netting and collateral on their valuation.
IFRS, derivatives, collateral, netting, financial reporting
Mixed Chart
Deutsche Bank
Saved
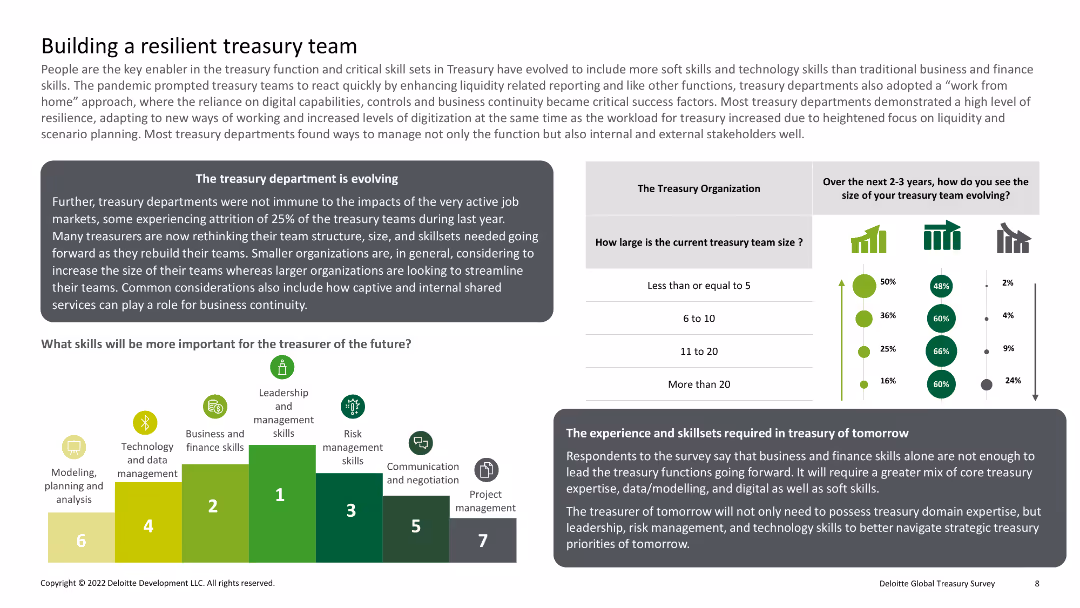
Text boxes and icons illustrating key skills required for treasury teams. Also includes a bar chart showing the current and projected size of treasury teams over the next 2-3 years.
Operational Efficiency
Professional Services
The slide outlines the skills and attributes necessary for building a resilient treasury team, highlighting the importance of leadership, risk management, and technological expertise. It also projects team size growth over time.
Treasury, Team, Skills, Resilience, Growth
Multiple Chart
Deloitte
Saved
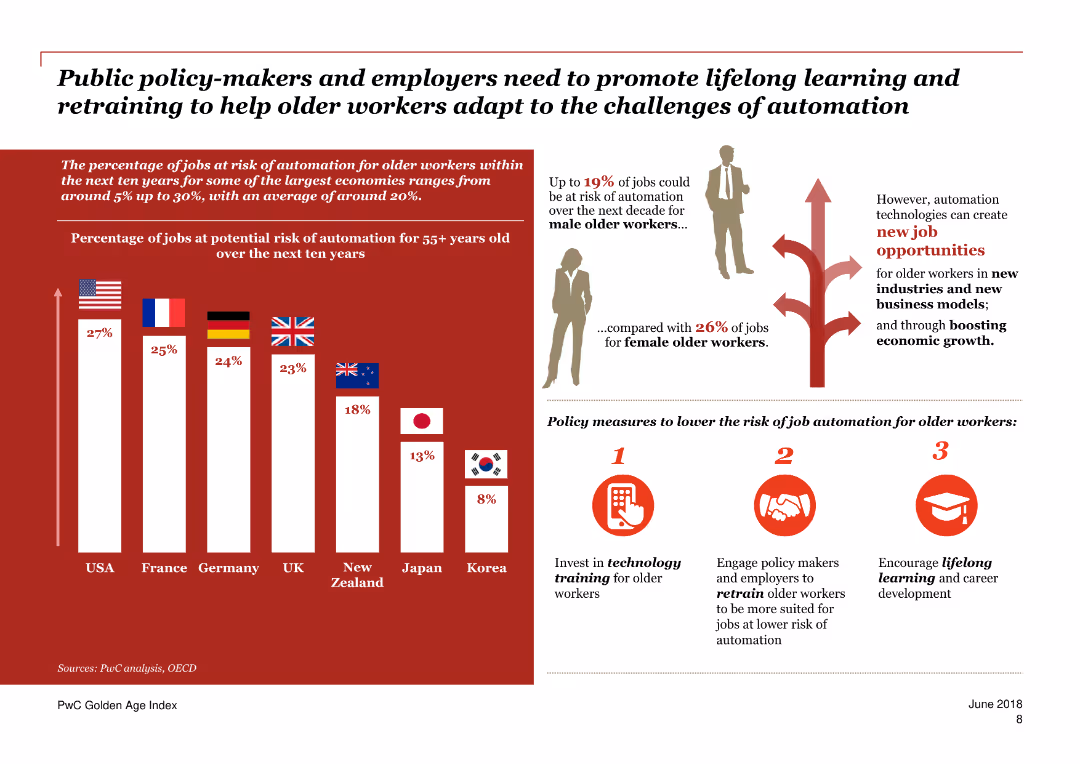
A mix of column charts and illustrations showing the risk of automation for older workers across different countries.
Market Analysis and Trends
Government & Public Sector
Discusses the risk of job automation for older workers and highlights the importance of policy measures to mitigate these risks.
automation, jobs, risk, older workers, countries, policy, training, technology, retraining, economy
Mixed Chart
PwC/Strategy&
Saved
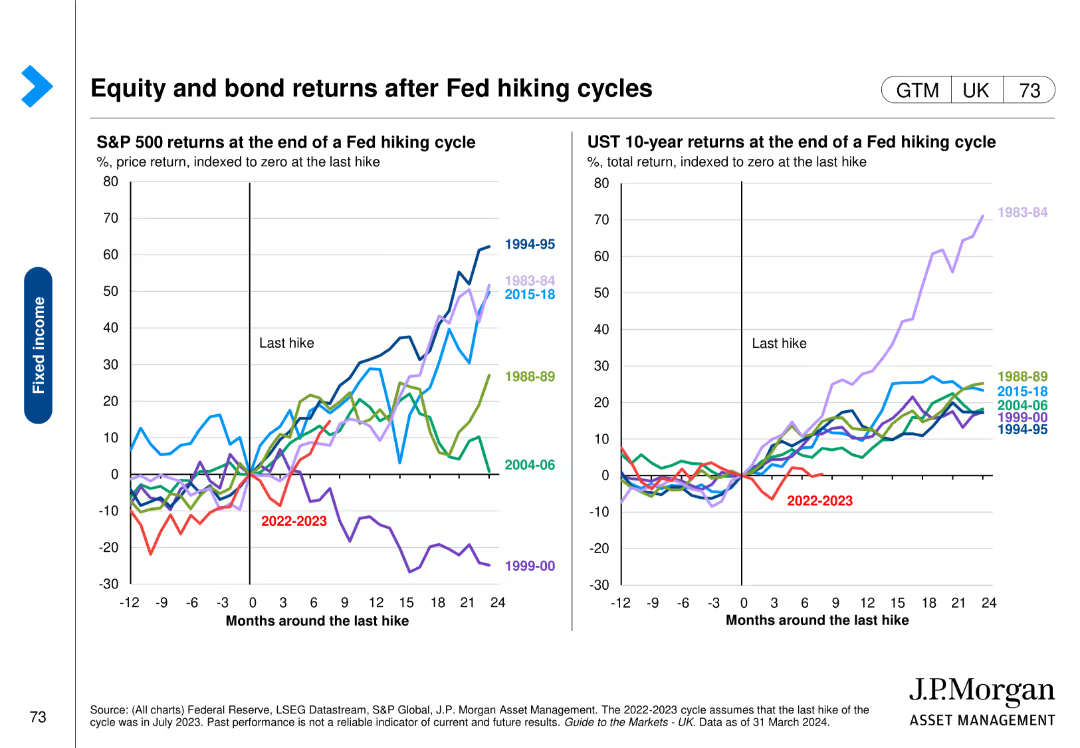
Contains two line charts showing S&P 500 and US 10-year Treasury returns around the end of Fed hiking cycles, with data from various periods highlighted.
Market Analysis and Trends
Financial Services
The slide explores the impact of Fed hiking cycles on equity and bond returns, providing historical data to understand market reactions to interest rate changes.
Fed hiking, equity returns, bond returns, S&P 500, Treasury
Multiple Chart
JP Morgan
Saved
Previous
Next
If nothing, comes up, please save your slides first
Create a FREE account to continue browsing
Receive Instant Access to 1,000+ slides from companies like McKinsey, Google, and Goldman Sachs
First Name
Last Name
Email
Password
I agree to all
Terms & Privacy Policy
Thank you! Your submission has been received!
Oops! Something went wrong while submitting the form.
Have an account?
Sign in
Column Chart
Heatmap
Chevron
Org Chart
Infographic
Callouts
Timeline
List
Graphic
Picture
Process Flow
Diagram
Paragraph
Map
Table
Framework
Subtitle
Takeaway Box
Icon
Other Chart
Radar Chart
Waterfall Chart
Mekko Chart
Pie Chart
Scatter Plot
Line Chart
Bar chart
Bullet points