My Account
My Slides
Search by Category
Templates
Leave Feedback
Login
Logout
Get Started
Browse all Slides
Browse all Slides
Create a FREE Account
Instant access to 1,000+ real slides from top companies like McKinsey, BCG, Goldman Sachs, Google and many more!
First Name
Last Name
Email
Password
I agree to all
Terms & Privacy Policy
Thank you! Your submission has been received!
Oops! Something went wrong while submitting the form.
Have an account?
Sign in
Saved Slides
The slide includes text blocks detailing four key characteristics of winning companies, supported by icons and brief descriptions.
Strategic Planning
Healthcare & Pharmaceuticals
This slide outlines the four main characteristics that define winning pharma companies, emphasizing strategic coherence and execution ability.
winning companies, key characteristics, strategic coherence, execution ability, pharma industry
Multiple Chart
Roland Berger
Saved
Bar chart showing quarterly Canadian GDP growth (annualized) from Q1 2015 to a forecast in Q2 2021, with notable changes in Q2 2020.
Market Analysis and Trends
Real Estate & Construction
The slide analyzes and forecasts economic recovery trends, highlighting significant GDP changes due to the pandemic and projecting recovery.
economic recovery, GDP growth, forecast, 2021, quarterly data, Canada
Single Chart
IPSOS
Saved
Column chart showing the Bain Resilience Index scores across various industries like Consumer Products, Industrials, and Retail, with benchmarks for Nordics and advanced economies, presented in grey and purple bars.
Performance Metrics and KPIs
Professional Services
Introduces the Bain Resilience Index, comparing resilience scores across different industries. Valuable for discussions on industry performance, resilience benchmarking, and strategic planning.
resilience, Bain Resilience Index, industry comparison, benchmarking, performance metrics, strategic planning
Single Chart
Bain
Saved
This slide features a green and white line chart against a black background, showing the performance of the "50 Most Innovative Companies of 2021." The slide is labeled with key percentages in bold green, providing a visual comparison to the "MSCI World Index." The data is clearly depicted for easy comparison, and the slide's overall design is straightforward, emphasizing the financial data presented.
Investment Analysis
Financial Services
The slide provides evidence of the financial performance of innovative companies, illustrating their continued outperformance during the COVID-19 crisis. It could be used by financial analysts or investment strategists to evaluate the merits of investing in innovative companies, demonstrating their potential for resilience and growth. The inclusion of an index comparison provides a benchmark for assessing the relative success of innovation-led strategies.
financial performance, innovative companies, COVID-19, MSCI World Index, investment strategy
Single Chart
BCG
Saved
Slide showcases four segments with images and text, highlighting concepts of hyperpersonalization, ultraconvenience, community, and sustainability.
Customer and Market Segmentation
Retail & E-commerce
Discusses the evolving expectations of consumers for personalized and convenient experiences, emphasizing community and sustainability.
hyperpersonalization, ultraconvenience, community, sustainability, consumer behavior, engagement, millennials, Generation Z, demographics, ESG
Header Horizontal
BCG
Saved
The slide contains a single column chart showing pre-tax income over three periods (9M17, 9M18, 9M19) with accompanying metrics for C/I ratio and RoRC.
Financial Performance
Financial Services
This slide shows improvements in pre-tax income for the first nine months of 2019, compared to previous years, with additional metrics for cost/income ratio and RoRC.
PTI improvement, pre-tax income, C/I ratio, RoRC, financial performance
Single Chart
Credit Suisse
Saved
The slide features a dark background with teal and white text. It has a column chart showing organizational understanding of resilience, and text on organizational pivoting.
Strategic Planning
Professional Services
Discusses preparing organizations to pivot in unexpected events, emphasizing the need for agility and strong financial management, and evaluates understanding of resilience.
resilience, agility, organizational pivot, COVID-19
Mixed Chart
Deloitte
Saved
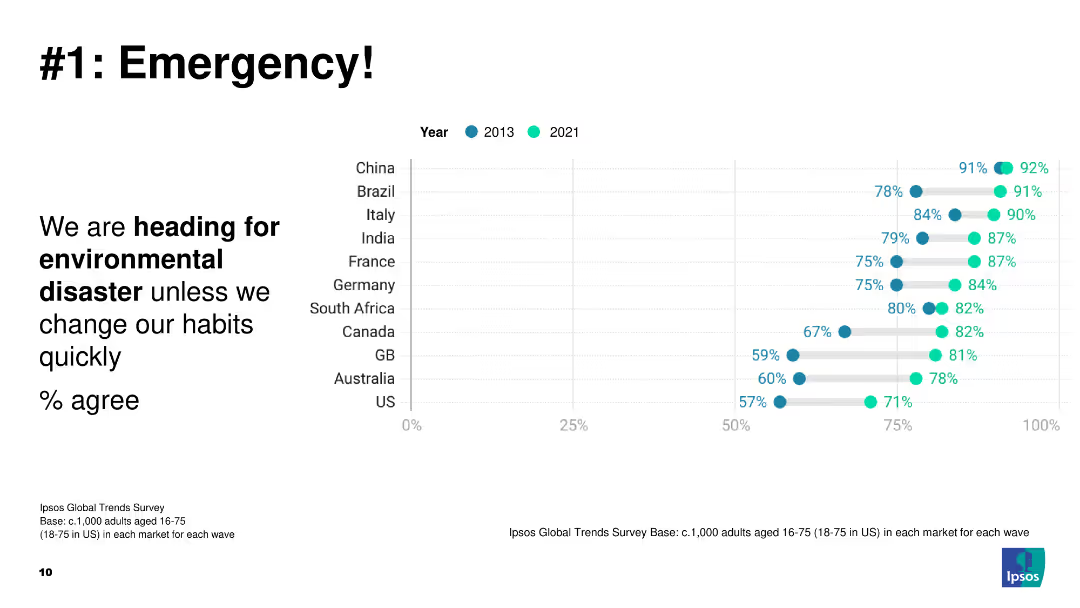
A dot plot showing the percentage of people agreeing that we are heading for environmental disaster unless habits change, comparing data from 2013 and 2021 across several countries.
Risk Assessment and Management
Environmental Services & Sustainability
The slide presents a critical view of global perceptions regarding environmental disaster. It compares data from 2013 and 2021, highlighting the urgency and growing awareness of the need for environmental action.
environmental disaster, global awareness, risk management, perception change, comparative data
Mixed Chart
IPSOS
Saved
Shows a pie chart detailing the composition of total deposits and key bullet points on segment performance.
Financial Performance
Financial Services
Emphasizes the stability and diversity of the deposit base, with data on different segments and total deposits.
deposits, stable, franchise, diversity, segments
Mixed Chart
Barclays
Saved
Column charts showing foreign investment projects in pharmaceuticals and medical devices from 2018-2022.
Market Analysis and Trends
Healthcare & Pharmaceuticals
This slide discusses trends in foreign investments in the health sector, noting a slowdown but still above pre-COVID-19 levels.
pharmaceuticals, healthsciences, investment, Europe, trends
Mixed Chart
EY
Saved
The slide includes two column charts showing the reduction in RWA and leverage exposure over time, with detailed text explaining the transactions and strategies that led to these reductions.
Financial Performance
Financial Services
Presents data on the reduction of risk-weighted assets (RWA) and leverage exposure in the financial sector. The column charts illustrate the decline over specific quarters, while the text explains the transactions and strategies that contributed to this progress, highlighting the impact of these measures on financial stability.
RWA, Leverage, Financial Stability, Reduction, Strategies
Multiple Chart
Credit Suisse
Saved
Dominated by text, this slide is sectioned into two columns, with bold subheadings and a series of bullet points outlining key information about the board of directors and governance practices.
Regulatory and Compliance
Professional Services
This slide provides an overview of the Board of Directors’ role and their governance structure, highlighting their contribution to sustainable growth, accountability, and strategic oversight at Booz Allen.
board of directors, governance, strategy, oversight, accountability
Text Only
Booz Allen Hamilton
Saved
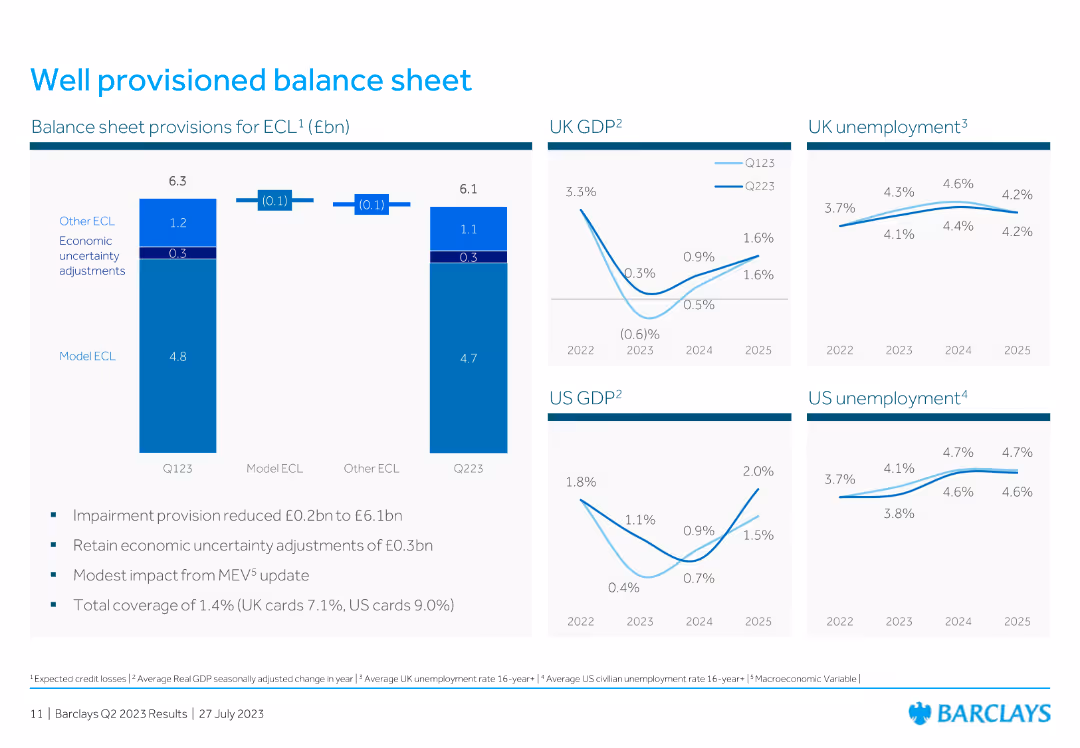
The slide includes several line charts showing GDP and unemployment projections, along with a bar chart on balance sheet provisions.
Risk Assessment and Management
Financial Services
The slide covers the balance sheet provisions for expected credit losses, with accompanying projections for GDP and unemployment rates in the UK and US.
balance sheet, GDP, unemployment, credit losses, provisions, financial, risk, line chart, bar chart, projection
Multiple Chart
Barclays
Saved
Slide with images and lists highlighting key players in FinTechs, Financial Institutions, and Telcos.
Competitive Landscape
Financial Services
Describes the competitive environment across FinTechs, financial institutions, and telecommunications.
competition, FinTech, financial institutions, telcos
Table
BCG
Saved
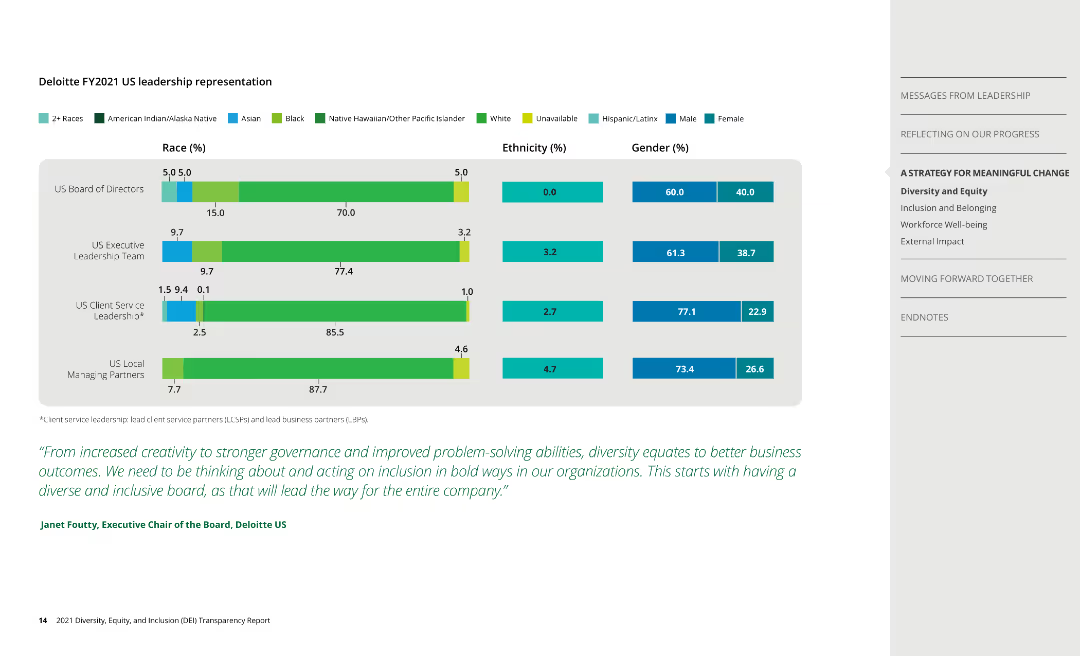
Column charts show representation by race, ethnicity, and gender within Deloitte's leadership teams.
Human Resources and Talent Management
Professional Services
Analyzes diversity in leadership positions, emphasizing the need for improved representation.
leadership, diversity, race, ethnicity, gender
Mixed Chart
Deloitte
Saved
A monochromatic background with a central, bold statement in orange. There's a list of three key opportunities and challenges related to digitization.
Strategic Planning
Professional Services
Serves as a thematic transition in a presentation, setting the stage for discussing how digitization affects growth, globalization, and work. It’s a prompt for deeper analysis on how these opportunities and challenges can be managed for strategic benefits.
opportunities, challenges, digitization, strategy, growth
Agenda
McKinsey
Saved
A column chart compares actions taken by CEOs most impacted by supply chain disruptions versus all CEOs. Commentary and statistics are provided on the right.
Strategic Planning
Transportation & Logistics
The slide focuses on the specific actions taken by CEOs who feel most impacted by supply chain disruptions, such as diversifying the value chain and conducting vulnerability assessments.
CEO actions, supply chain, disruptions, resilience, strategic planning
Mixed Chart
Accenture
Saved
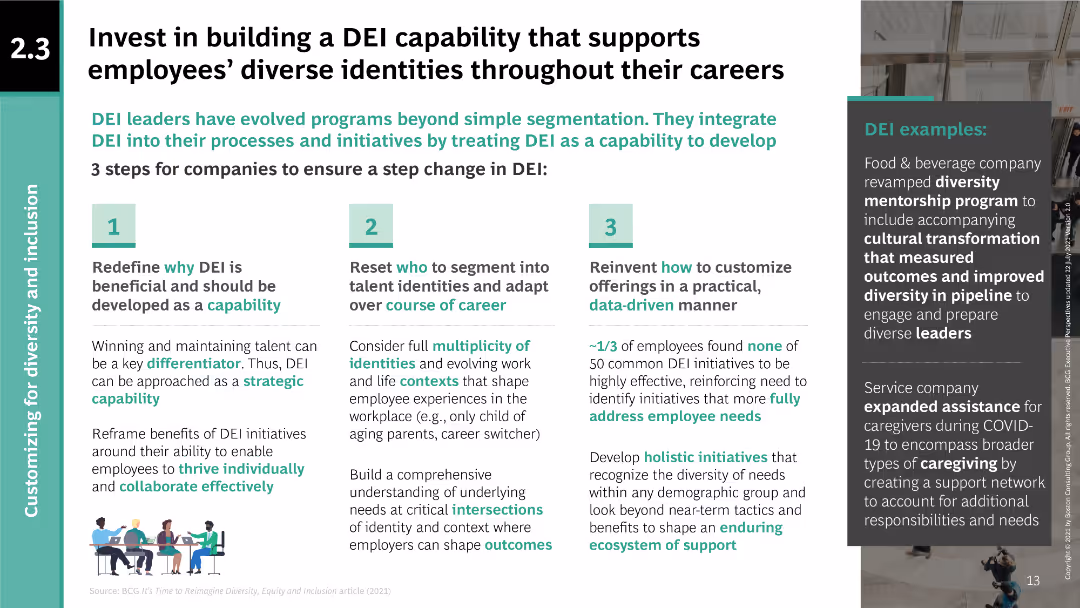
Three-step process diagram for building DEI capability; text explaining steps and examples.
Human Resources and Talent Management
Professional Services
Provides a framework for integrating DEI into company processes, highlighting steps to redefine, reset, and reinvent DEI initiatives to support diverse employee identities.
DEI, diversity, equity, inclusion, employee support, capability building, company processes, strategic initiatives, diversity mentorship
Linear Flow
BCG
Saved
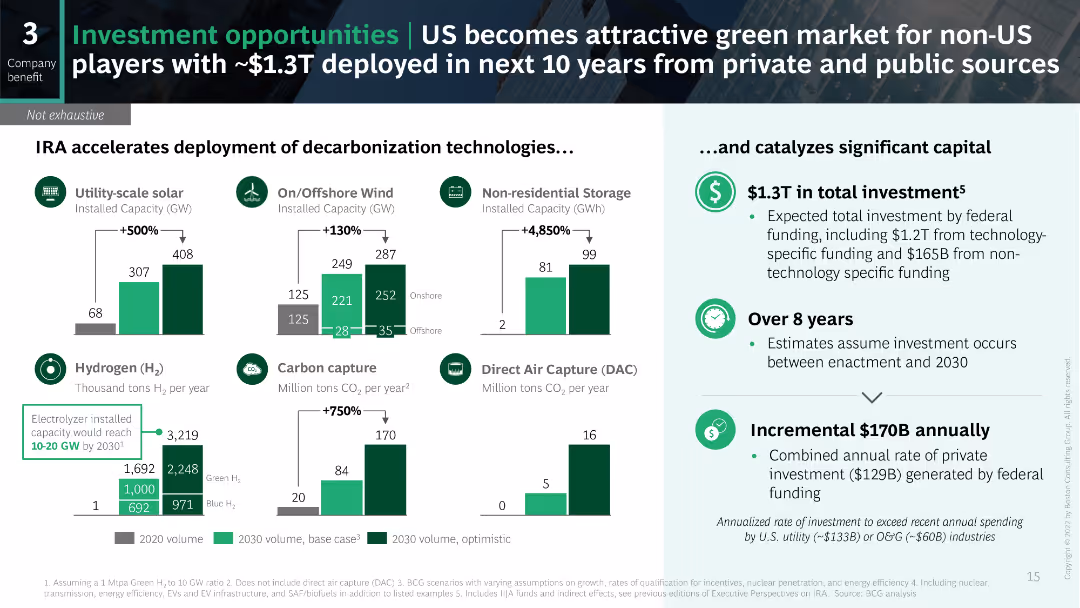
The slide features a variety of visual data elements including bar charts and icons to illustrate the deployment of decarbonization technologies and the associated financial investments. The layout is dense with detailed data and projections.
Investment Analysis
Financial Services
This slide highlights the investment opportunities in the US for decarbonization technologies driven by the IRA, projecting significant private and public investment over the next 10 years and detailing specific areas like solar and wind energy.
investment, decarbonization, IRA, solar, wind
Multiple Chart
BCG
Saved
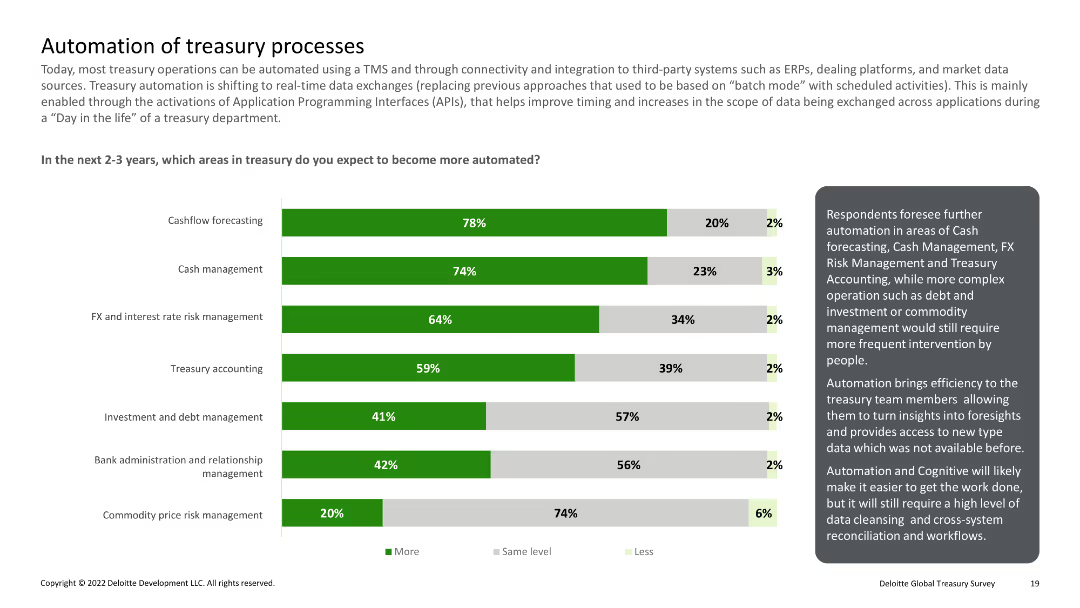
Column chart showing areas expected to be automated in the next 2-3 years, including cashflow forecasting and FX management
Technology and Digital Transformation
Financial Services
Predicts increased automation in various treasury processes over the next few years, emphasizing efficiency improvements.
Automation, treasury, processes, forecasting, management
Mixed Chart
Deloitte
Saved
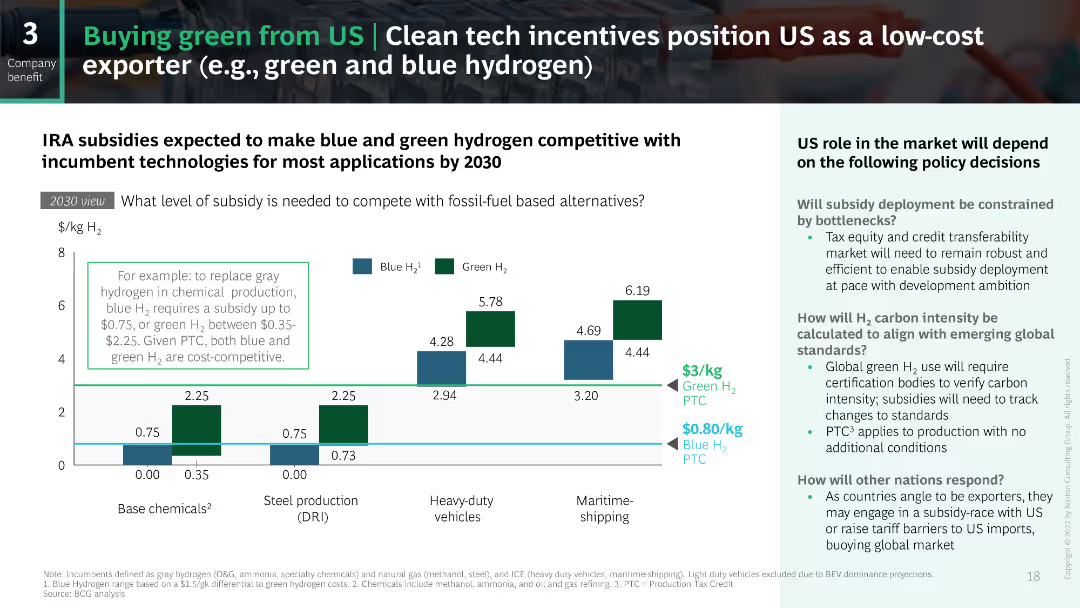
The slide uses a series of bar charts to depict the subsidy levels needed to make green and blue hydrogen competitive by 2030. The charts are color-coded to distinguish between green and blue hydrogen, and the layout is balanced with explanatory text on the side.
Strategic Planning
Energy & Utilities
This slide outlines the expected subsidy levels required for green and blue hydrogen to compete with fossil fuels by 2030, discussing the potential role of the US in the global market and the impact of various policy decisions on subsidy deployment.
hydrogen, subsidies, green, blue, competitive
Mixed Chart
BCG
Saved
The slide shows bar graphs comparing Booz Allen's dividend growth to peer average, alongside textual information.
Financial Performance
Financial Services
Highlights the company's quarterly dividend growth compared to peers, reflecting on Booz Allen's strong performance. Used in investment analysis or shareholder presentations.
Dividend, Growth, Comparison, Performance, Market
Single Chart
Booz Allen Hamilton
Saved
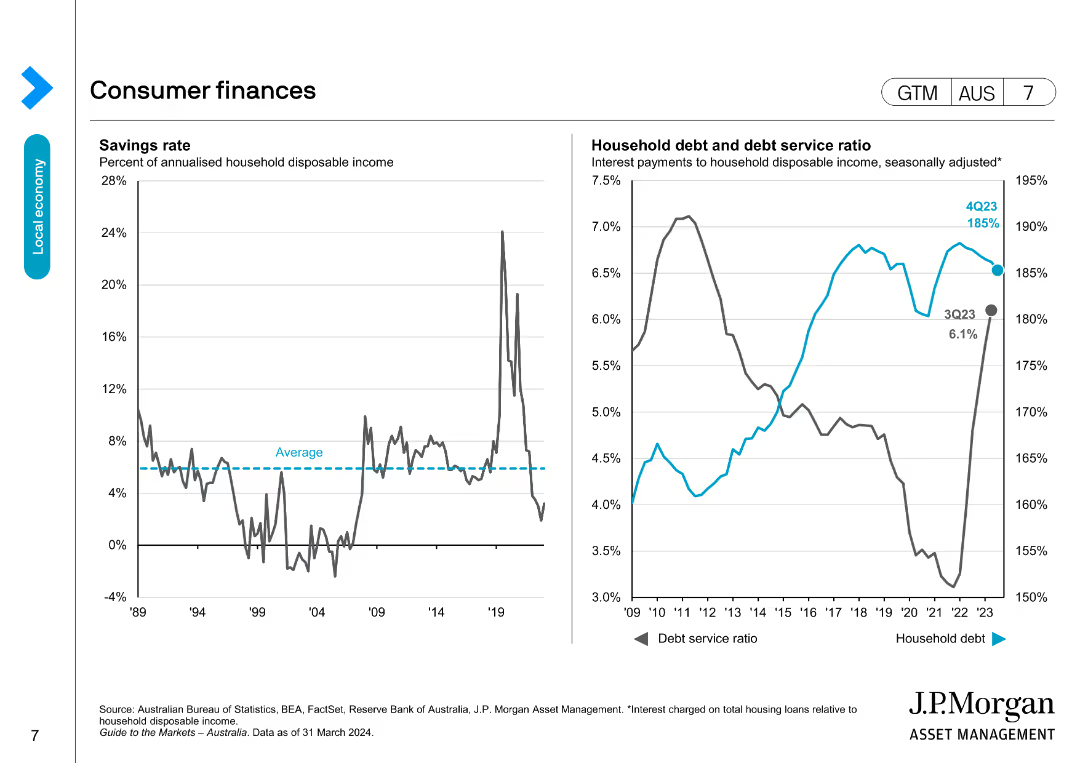
The slide includes a line chart of savings rates and a dual-axis line chart of household debt and debt service ratios, indicating financial health trends.
Market Analysis and Trends
Financial Services
This slide assesses consumer financial health in Australia by analyzing savings rates, household debt levels, and debt service ratios over time.
consumer finances, savings rate, household debt, debt service ratio, Australia
Multiple Chart
JP Morgan
Saved
Contains three pie charts comparing digital marketing maturity between APAC, India, and Europe. The layout is simple and clean, focusing on the comparative data.
Market Analysis and Trends
Media & Entertainment
Compares digital marketing maturity scores across APAC, India, and Europe, indicating similar levels of maturity and highlighting best practices among leading brands. This slide is useful for understanding regional differences and identifying areas of improvement in digital marketing strategies.
digital marketing, APAC, India, Europe, maturity comparison, best practices, regional analysis, improvement areas, pie chart, marketing strategies
Multiple Chart
BCG
Saved
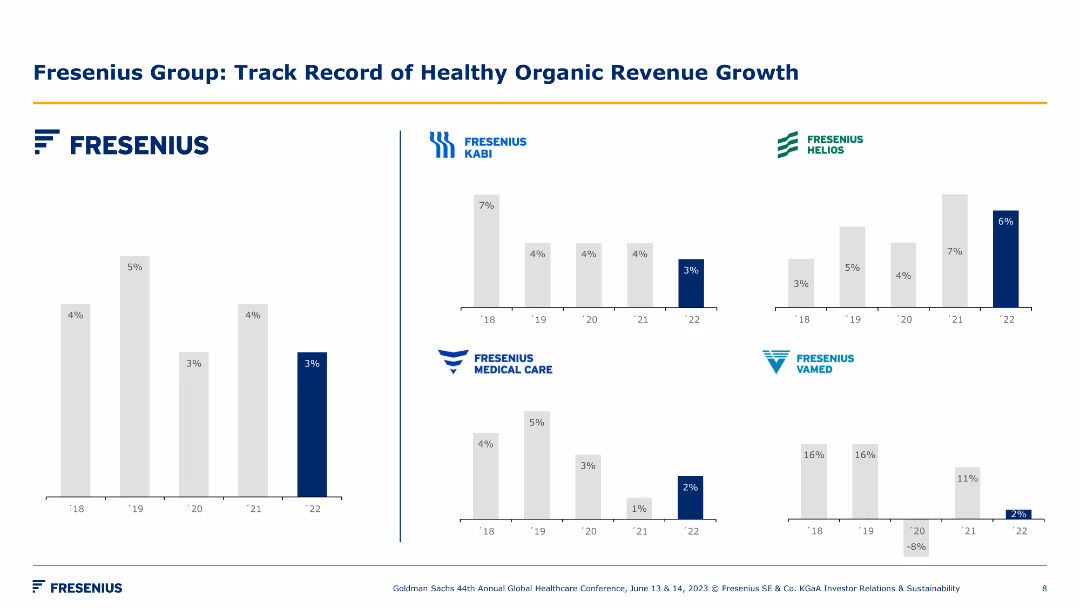
Multiple column charts showing organic revenue growth for different Fresenius segments over several years. Consistent color scheme and layout.
Financial Performance
Healthcare & Pharmaceuticals
The slide illustrates the organic revenue growth of Fresenius Group's various segments over a period, highlighting consistent performance across the board.
revenue, growth, organic, segments, performance, trends, healthcare, financial, Fresenius, track record
Multiple Chart
Goldman Sachs
Saved
Previous
Next
If nothing, comes up, please save your slides first
Create a FREE account to continue browsing
Receive Instant Access to 1,000+ slides from companies like McKinsey, Google, and Goldman Sachs
First Name
Last Name
Email
Password
I agree to all
Terms & Privacy Policy
Thank you! Your submission has been received!
Oops! Something went wrong while submitting the form.
Have an account?
Sign in
Column Chart
Heatmap
Chevron
Org Chart
Infographic
Callouts
Timeline
List
Graphic
Picture
Process Flow
Diagram
Paragraph
Map
Table
Framework
Subtitle
Takeaway Box
Icon
Other Chart
Radar Chart
Waterfall Chart
Mekko Chart
Pie Chart
Scatter Plot
Line Chart
Bar chart
Bullet points