My Account
My Slides
Search by Category
Templates
Leave Feedback
Login
Logout
Get Started
Browse all Slides
Browse all Slides
Create a FREE Account
Instant access to 1,000+ real slides from top companies like McKinsey, BCG, Goldman Sachs, Google and many more!
First Name
Last Name
Email
Password
I agree to all
Terms & Privacy Policy
Thank you! Your submission has been received!
Oops! Something went wrong while submitting the form.
Have an account?
Sign in
Saved Slides
The slide features two line charts, one showing food prices and the other fertilizer prices, with indexes on the y-axis and years on the x-axis. Commentary text is present on the right.
Market Analysis and Trends
Agriculture & Food Production
The slide discusses the stability of food and fertilizer prices in November, highlighting dairy price increases and pressures from global events like the Russia-Ukraine conflict.
Food prices, fertilizer prices, dairy, market trends, global events
Multiple Chart
Accenture
Saved
This slide features icons and tables. Each chart corresponds to a different rating agency and shows the ESG rating criteria, score range, specific scores, and rating development. The design is clean with blue and white color scheme.
Financial Performance
Financial Services
The slide presents Deutsche Bank's ESG performance as evaluated by several rating agencies. It details the criteria, score, and trends in ratings, demonstrating how the bank stands on environmental, social, and governance factors as of February 2024.
ESG, performance, rating agencies, trends, finance
Table
Deutsche Bank
Saved
Slide contains column charts, text, and bullet points with a clear visual hierarchy in blue, gray, and white colors. It's data-rich and detailed.
Operational Efficiency
Financial Services
This slide covers financial results and net revenue in consumer and wealth management, useful for operational reviews and financial analysis.
Consumer, Wealth, Management, Financial, Results, Net Revenue, Operational, Review, Analysis, Efficiency
Mixed Chart
Goldman Sachs
Saved
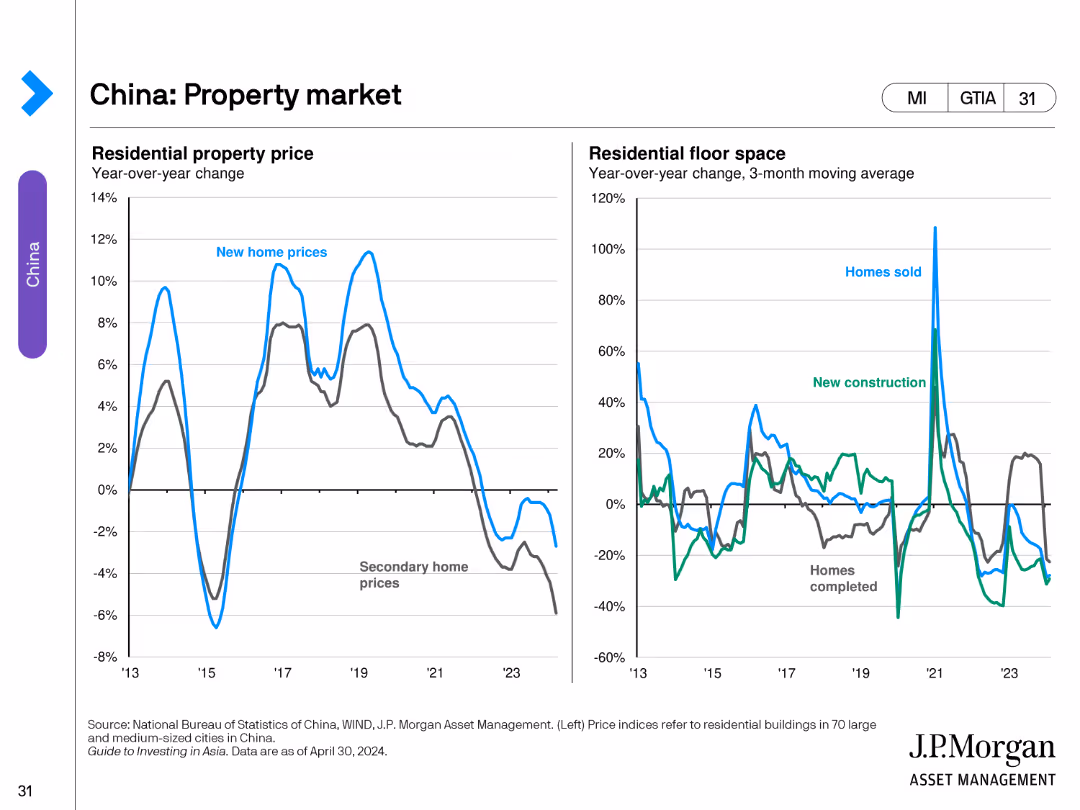
The slide includes two line charts. The left chart shows year-over-year changes in residential property prices. The right chart illustrates year-over-year changes in residential floor space for homes sold and new constructions.
Market Analysis and Trends
Real Estate & Construction
This slide evaluates the property market in China, analyzing trends in residential property prices and residential floor space changes.
Property, Market, China, Prices, Construction
Multiple Chart
JP Morgan
Saved
Includes a bar chart comparing current and future human-machine working hours, and a pie chart showing reskilling needs of employees.
Operational Efficiency
Financial Services
Highlights the need for reskilling employees in the insurance industry due to shifts in labor between humans and machines, emphasizing digitization and automation impacts.
Reskilling needs, Human-machine working hours, Insurance industry, Digitization, Automation
Multiple Chart
EY
Saved
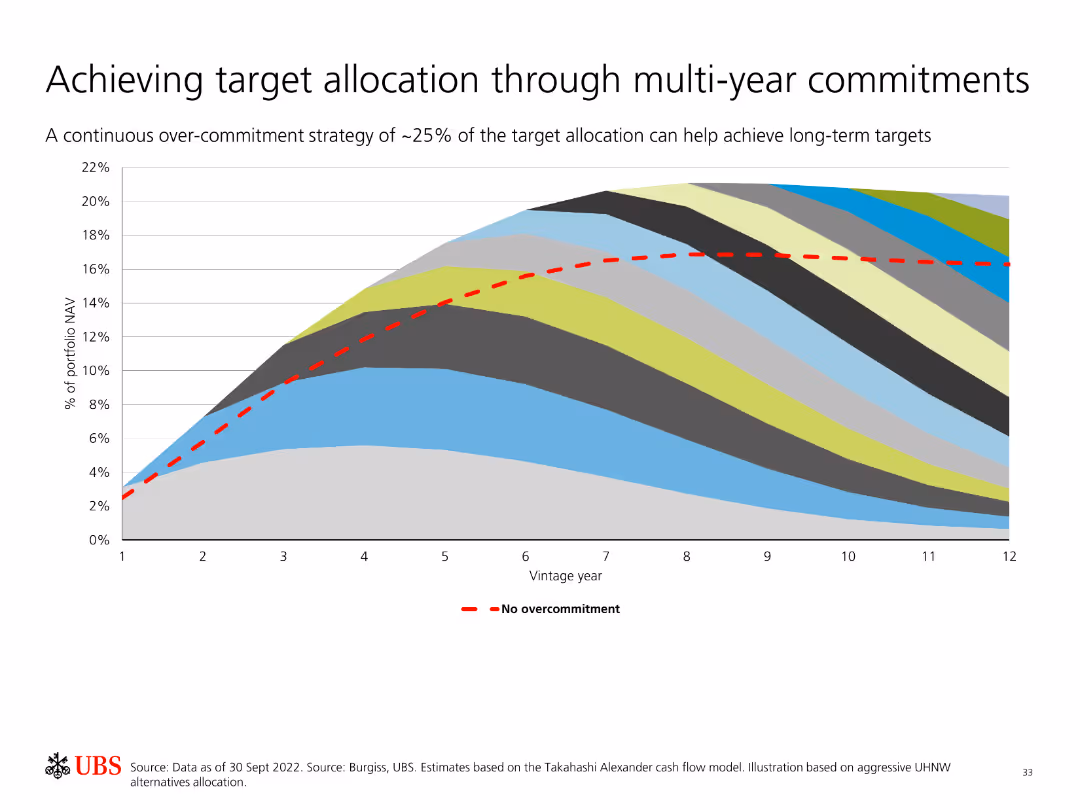
Features an area chart showing portfolio NAV over vintage years with a continuous over-commitment strategy compared to no overcommitment.
Strategic Planning
Financial Services
Discusses the benefits of a continuous over-commitment strategy to achieve target portfolio allocation over multiple years, using historical data for illustration.
Target Allocation, Multi-Year Commitments, Portfolio NAV, Over-Commitment, Strategy, Investment, Analysis, Historical Data, Planning
Single Chart
UBS
Saved
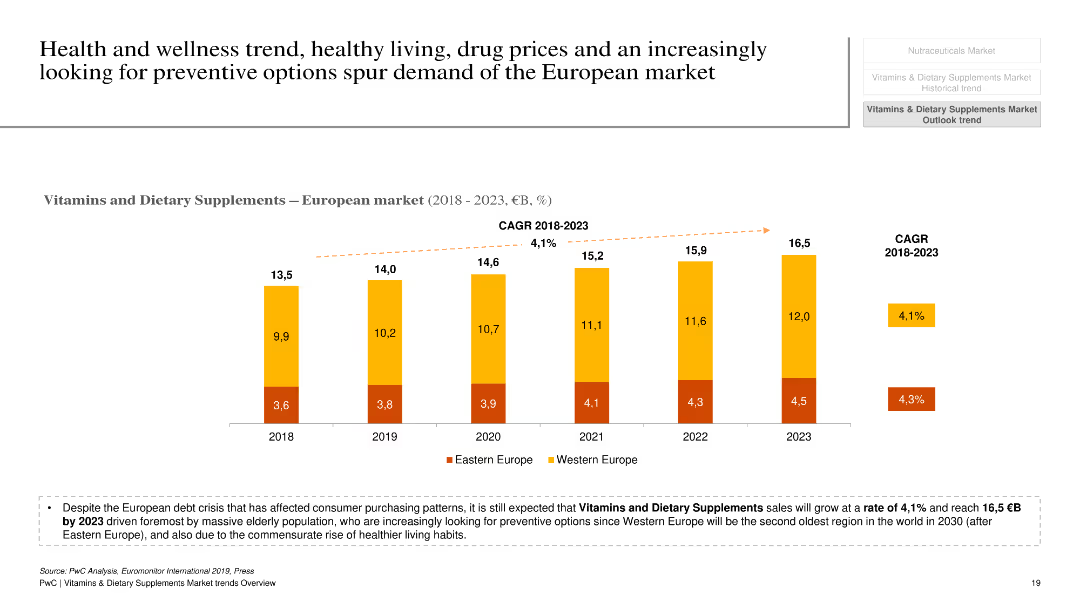
The slide features a column chart illustrating the growth of the European market for vitamins and dietary supplements from 2018 to 2023, segmented by Eastern and Western Europe. A text box below the chart highlights key drivers and market trends.
Market Analysis and Trends
Healthcare & Pharmaceuticals
The slide outlines the expected growth of the European vitamins and dietary supplements market, driven by health and wellness trends, preventive health measures, and demographic factors. It includes a comparative analysis of market segments and provides an overview of growth rates and key influencing factors.
European market, vitamins, dietary supplements, growth drivers, preventive health
Mixed Chart
PwC/Strategy&
Saved
The slide compares 'Funded balance sheet' data between two time periods, showcasing figures in column charts and additional financial statistics to provide a comparative financial analysis.
Financial Performance
Financial Services
Shows Macquarie's funded balance sheet strength, comparing term liabilities and assets over two periods. It’s used for financial analysis and to demonstrate the company's stability to investors or stakeholders.
Balance Sheet, Financial Stability, Term Liabilities, Assets, Comparative Analysis
Multiple Chart
Morgan Stanley
Saved
Map of Denmark, regional highlights, infographic style with icons and color coding.
Regulatory and Compliance
Government & Public Sector
Surveys regional focus on SDGs in Denmark, showing varying priorities such as climate action and economic growth.
Regional strategy, Denmark, SDGs, climate action, economic growth
Graphic
McKinsey
Saved
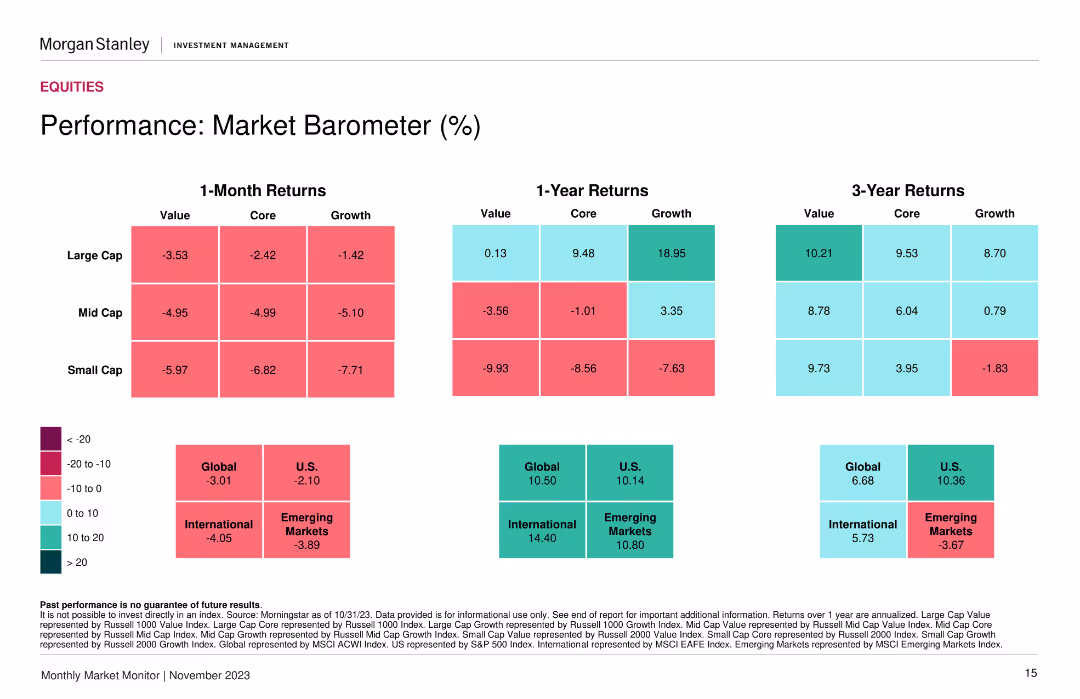
Heatmap showing returns for value, core, and growth across large, mid, and small caps over 1 month, 1 year, and 3 years.
Financial Performance
Financial Services
A market barometer showing performance metrics across different market segments and time periods, aiding in evaluating market performance and trends.
Market performance, returns, segments
Table
Morgan Stanley
Saved
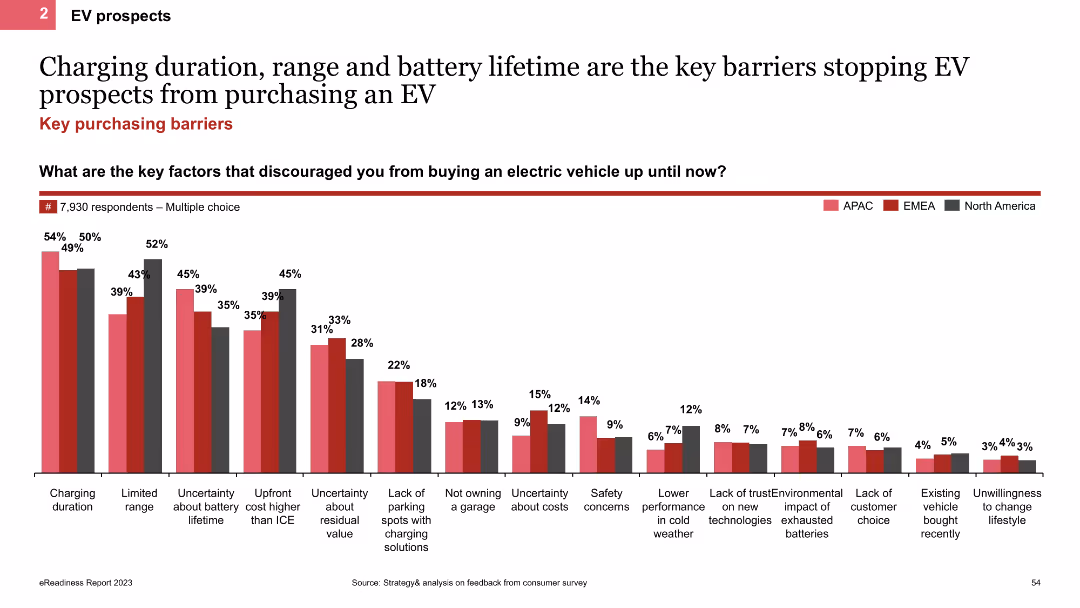
The slide uses a column chart to show the main barriers preventing EV purchases, such as charging duration, range, and battery lifetime. It includes regional comparisons indicated by colored bars for APAC, EMEA, and North America.
Market Analysis and Trends
Transportation & Logistics
This slide analyzes the key barriers to EV adoption, focusing on issues like charging duration, range, and battery lifetime. It provides regional data to show how these barriers vary across different areas.
EV barriers, column chart, charging duration, battery lifetime
Single Chart
PwC/Strategy&
Saved
Slide displays bar charts comparing digital audio advertising revenue from desktop and mobile between 2019 and 2020, with mobile showing higher values.
Market Analysis and Trends
Media & Entertainment
Analyzes the growth in digital audio advertising, with a focus on the dominance of mobile platforms in generating revenue over desktop, indicating a 13% YoY growth.
mobile, audio, advertising, revenue, growth, 2019-2020
Single Chart
PwC/Strategy&
Saved
This slide contains a mix of charts and infographics that detail the projected potential of metaverse platforms, consumer readiness, and the involvement of major tech companies.
Technology and Digital Transformation
Retail & E-commerce
Provides insights into the expected growth and significance of the metaverse, and its influence on consumer behavior and corporate investment strategies.
Metaverse, Extended Reality, Consumer Trends, Tech Investment, Big Tech, Virtual Reality, Market Potential, Digital Platforms, Augmented Reality, Strategic Investments
Header Horizontal
BCG
Saved
The slide uses column charts and tables to present the number of IPOs and proceeds in Europe, the Middle East, India, and Africa. It also includes details on stock exchanges and sectors.
Market Analysis and Trends
Financial Services
The slide discusses the robust IPO market performance in EMEIA, despite uncertainties. It showcases data on the number of IPOs, proceeds, and details of key stock exchanges and sectors.
EMEIA IPOs, market performance, financial trends, stock exchanges, sector analysis
Multiple Chart
EY
Saved
Contains line chart, donut chart, and images. Uses blue tones with clear visuals.
Strategic Planning
Financial Services
Highlights GDP growth in South American Andean countries and the geographical profit breakdown.
South America, GDP, growth, profit
Multiple Chart
Morgan Stanley
Saved
Includes a large pie chart with statistical data and a list of three strategic actions for CEOs with associated icons.
Human Resources and Talent Management
Professional Services
This slide emphasizes the importance of leadership in the successful integration of SDGs into business strategy, presenting statistical evidence and actionable recommendations for CEOs to foster a sustainability-focused culture at all organizational levels.
Leadership, Sustainability, SDGs, Strategic Recommendations, Business Strategy
Mixed Chart
McKinsey
Saved
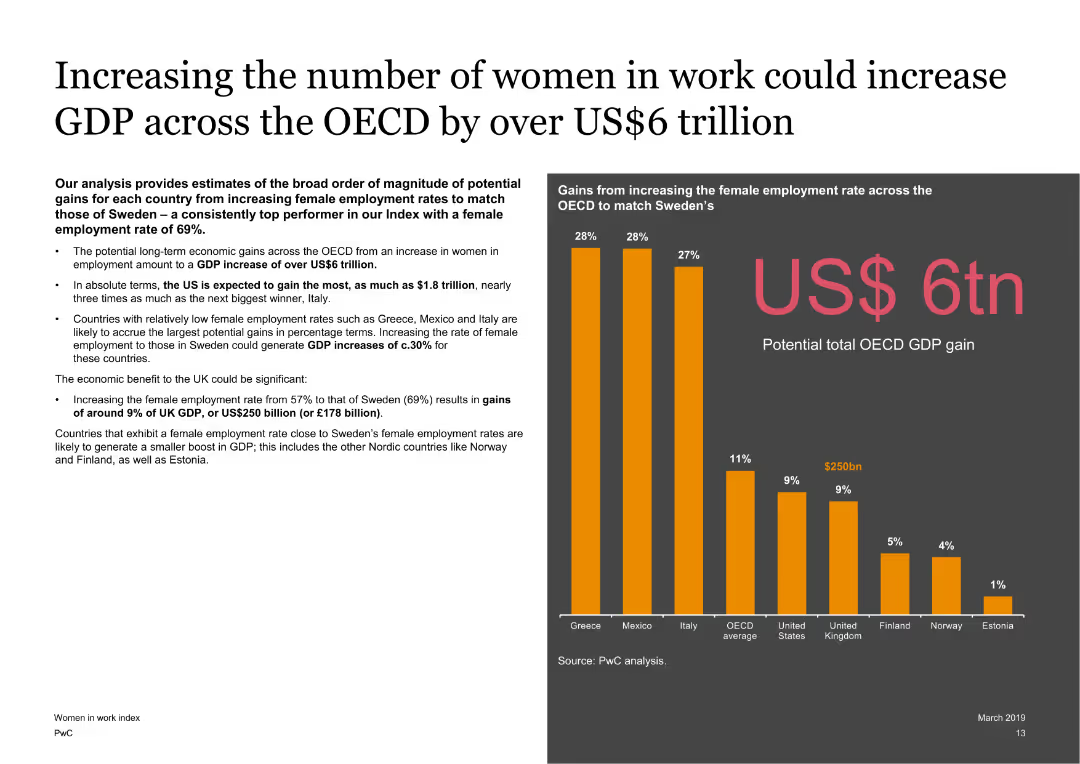
A slide featuring text on the left side and a column chart on the right. The column chart displays potential GDP gains from increasing female employment rates across OECD countries. The slide is moderately dense.
Market Analysis and Trends
Government & Public Sector
Discusses the potential GDP gains across OECD countries by increasing female employment rates to match those of Sweden. It highlights economic benefits and specific gains for the US and the UK.
GDP, female employment, OECD, economic growth, analysis
Mixed Chart
PwC/Strategy&
Saved
Contains a flowchart and images, detailing the use of solar power in primary healthcare centers. The slide is organized to guide the viewer through the rationale and impact measures of this use case.
Operational Efficiency
Healthcare & Pharmaceuticals
Highlights the application of solar energy in healthcare facilities to improve service delivery, focusing on its operational benefits and potential to enhance healthcare outcomes in regions with unreliable power supply.
solar energy, healthcare, operational benefits, primary care, power supply
Linear Flow
BCG
Saved
Dense layout with column chart and icons detailing corporate sustainability efforts and partnerships across the SEA region.
Strategic Planning
Government & Public Sector
Outlines the roles of businesses in SEA in advancing sustainability, including commitments, partnerships, and innovations.
SEA, sustainability, business leadership, corporate initiatives
Mixed Chart
Bain
Saved
This slide features two bar charts: one showing PE/VC investments by deal size and the other by deal type, excluding infrastructure and real estate. It uses a color scheme to differentiate between months and categories, providing detailed numerical data for precise analysis.
Market Analysis and Trends
Financial Services
The slide provides a detailed breakdown of PE/VC investments by deal type and size, excluding infrastructure and real estate. This helps in understanding the distribution of investments across various deal sizes and types, aiding in strategic investment decisions.
PE/VC, deal type, deal size, investment distribution, strategic planning
Multiple Chart
EY
Saved
Contains a series of column charts and data tables presenting loan and deposit figures over several quarters, with emphasis on trends and adjustments for currency effects.
Financial Performance
Financial Services
Details recent trends in the bank's deposit and loan figures, illustrating strategic financial management and stability in the face of economic challenges, with a focus on year-over-year comparisons and foreign exchange adjustments.
Deposits, Loans, Trends, Financial Stability, Economic Challenges, Currency Adjustments
Multiple Chart
Deutsche Bank
Saved
Table comparing different battery technologies (e.g., Na sulfur, solid state battery) with parameters like technology readiness level, implementation timeline, energy density, and cycle life.
Technology and Digital Transformation
Technology & Software
The slide provides a comparative analysis of various frontier battery technologies, detailing their readiness levels, implementation timelines, energy densities, and potential applications. It highlights the importance of advancing battery technology to support the transition away from fossil fuels.
Battery Technology, Energy Storage, Implementation
Table
Roland Berger
Saved
Presents a series of column charts displaying growth in active accounts, sales volume, EOP outstandings, and revenue from 2014 to 2018. Several side notes elaborate on growth drivers.
Financial Performance
Financial Services
Highlights the financial growth of JP Morgan Chase in terms of active accounts, sales volume, and revenue, emphasizing the drivers behind the growth such as investment in rewards programs and digital engagement.
financial growth, sales volume, revenue, active accounts, digital engagement
Multiple Chart
JP Morgan
Saved
Features detailed bar charts with industry comparisons, textual annotations, and legends.
Operational Efficiency
Energy & Utilities
Shows energy savings across industries by implementing sustainable practices, emphasizing cost reduction.
Energy savings, sustainability, industry comparison, operational efficiency
Multiple Chart
McKinsey
Saved
Line chart displaying Euro area wage growth from 1999 to 2019, with separate lines for Germany and Euro area excl. Germany. Colors are orange and blue with a source citation at the bottom left corner.
Market Analysis and Trends
Financial Services
This slide presents comparative wage growth data for Germany and the rest of the Euro area, indicating economic trends and providing insights for market analysis and financial forecasting.
Euro area, wage growth, Germany, economic data, line chart, comparison, financial trends, market analysis, ECB, J.P. Morgan.
Single Chart
JP Morgan
Saved
Previous
Next
If nothing, comes up, please save your slides first
Create a FREE account to continue browsing
Receive Instant Access to 1,000+ slides from companies like McKinsey, Google, and Goldman Sachs
First Name
Last Name
Email
Password
I agree to all
Terms & Privacy Policy
Thank you! Your submission has been received!
Oops! Something went wrong while submitting the form.
Have an account?
Sign in
Column Chart
Heatmap
Chevron
Org Chart
Infographic
Callouts
Timeline
List
Graphic
Picture
Process Flow
Diagram
Paragraph
Map
Table
Framework
Subtitle
Takeaway Box
Icon
Other Chart
Radar Chart
Waterfall Chart
Mekko Chart
Pie Chart
Scatter Plot
Line Chart
Bar chart
Bullet points