My Account
My Slides
Search by Category
Templates
Leave Feedback
Login
Logout
Get Started
Browse all Slides
Browse all Slides
Create a FREE Account
Instant access to 1,000+ real slides from top companies like McKinsey, BCG, Goldman Sachs, Google and many more!
First Name
Last Name
Email
Password
I agree to all
Terms & Privacy Policy
Thank you! Your submission has been received!
Oops! Something went wrong while submitting the form.
Have an account?
Sign in
Saved Slides
With a split-view of bar charts, the slide displays comparative interest rate data for developed and emerging markets through visually distinct tables, highlighting current and prior year rates.
Investment Analysis
Financial Services
The slide acts as an analytical tool for assessing yield variations in sovereign currencies, key for financial strategists and investors monitoring interest rate trends and their impact on global markets.
Interest Rates, Sovereign Yields, Developed Markets, Emerging Markets, Currency, Financial Analysis, Comparative Tables
Multiple Chart
Morgan Stanley
Saved
The slide is divided into three sections, with column charts showing profitability, WM product enablement, and franchise strength. Awards and rankings are listed on the right.
Financial Performance
Financial Services
This slide showcases improvements in profitability, enablement of Wealth Management products, and maintaining franchise strength with various rankings and awards.
Profitability, WM products, franchise strength, awards, rankings
Multiple Chart
Credit Suisse
Saved
Features complex pie charts detailing the composition of the deposit base across different banking segments.
Financial Performance
Financial Services
Reviews the stability and diversification of the bank's deposit portfolio, emphasizing strong positions in key market segments.
deposits, diversification, finance, stability, banking, market segments
Multiple Chart
Deutsche Bank
Saved
The slide features a title and a single column chart tracking the median time to trial for family law final order cases from 2012-2017 in FCoA and FCC, with annotations highlighting a growing median time to trial.
Regulatory and Compliance
Government & Public Sector
This slide presents the increasing median time to trial in both FCoA and FCC over five years, with a clear indication that the time to trial is growing, alongside important caveats regarding the resolution of cases.
FCoA, FCC, median time to trial, final orders, case resolution, legal proceedings
Mixed Chart
PwC/Strategy&
Saved
The slide is text-heavy with a series of bullet points on the left, complemented by labeled graphs on the right. The design is minimalist with a white background and uses contrasting black and blue text for emphasis.
Risk Assessment and Management
Financial Services
Outlines potential economic scenarios resulting from COVID-19's spread, public health responses, and policy decisions. It's a tool for assessing risks and planning for various outcomes in the financial sector.
Economic Scenarios, COVID-19, Health Response
Table
McKinsey
Saved
Scatter plot comparing venture capital investment with sales growth, highlighting the technology sector's position relative to other industries.
Strategic Planning
Technology & Software
The slide provides an analysis of the venture capital investment relative to sales growth across sectors, pinpointing the technology sector's appeal for VC investment, useful for strategic market positioning.
FGA, Venture Capital, Technology, Sector Analysis, Investment
Mixed Chart
Oliver Wyman
Saved
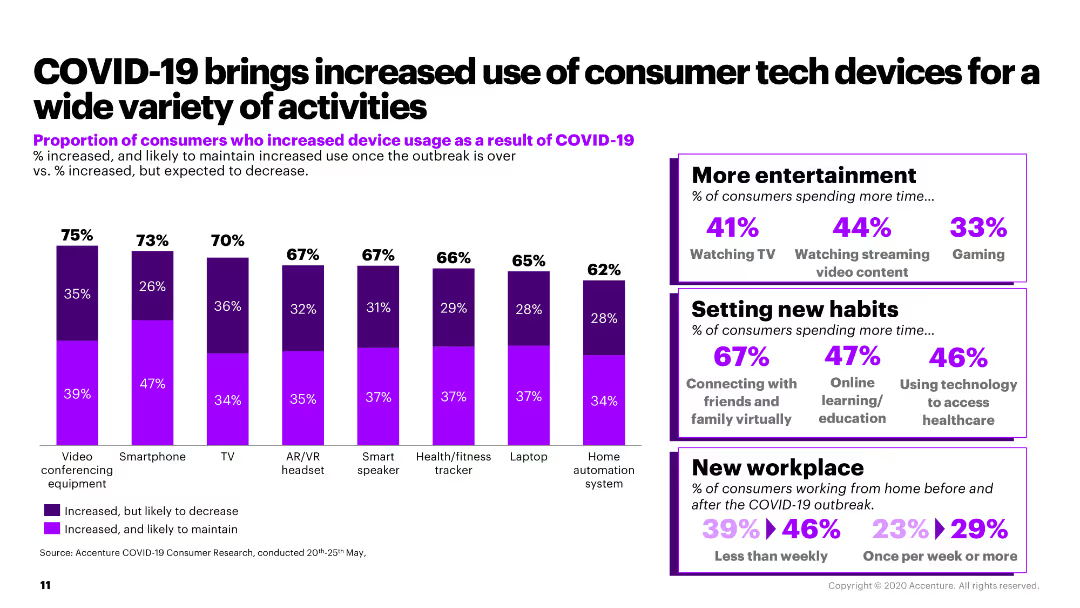
The slide includes a column chart illustrating the increase in usage of various consumer tech devices and a sidebar with additional statistics on consumer habits.
Market Analysis and Trends
Retail & E-commerce
The slide discusses the increased use of consumer tech devices for activities like video conferencing and gaming due to COVID-19, with supporting statistics.
consumer tech, COVID-19, device usage, video conferencing, consumer habits
Mixed Chart
Accenture
Saved
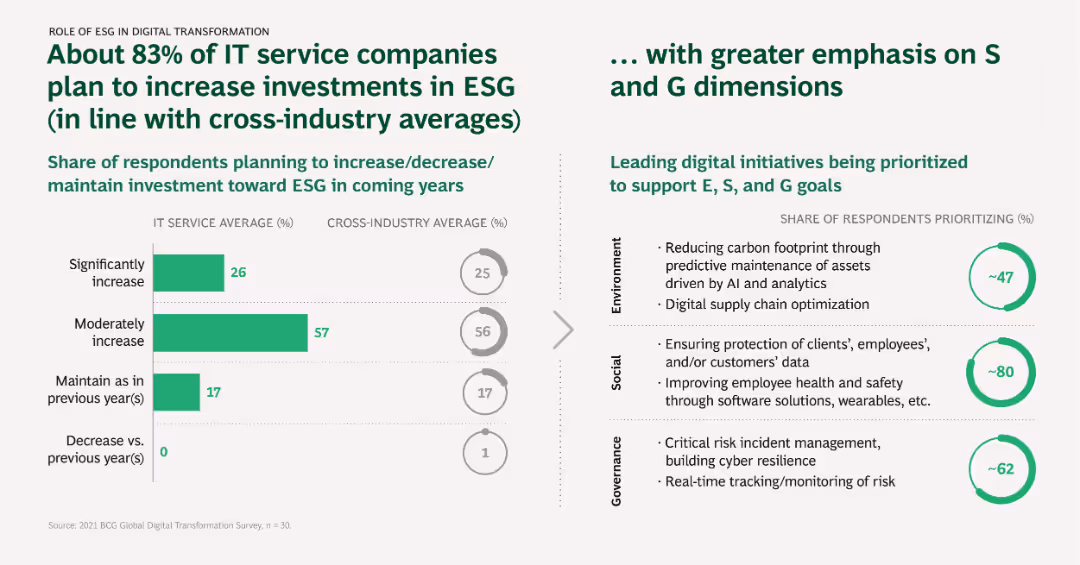
The slide contains a column chart, bullet points, and icons. It utilizes a balanced design with green growth indicators and well-structured textual information.
Market Analysis and Trends
Technology & Software
This slide emphasizes the impact of AI/ML on business, showcasing past performance and future targets, with mentions of use cases for personalization and client relationships, as well as the growth of the AI team.
AI, ML, data, impact, personalization, analytics, team growth, technology platforms, business value
Mixed Chart
JP Morgan
Saved
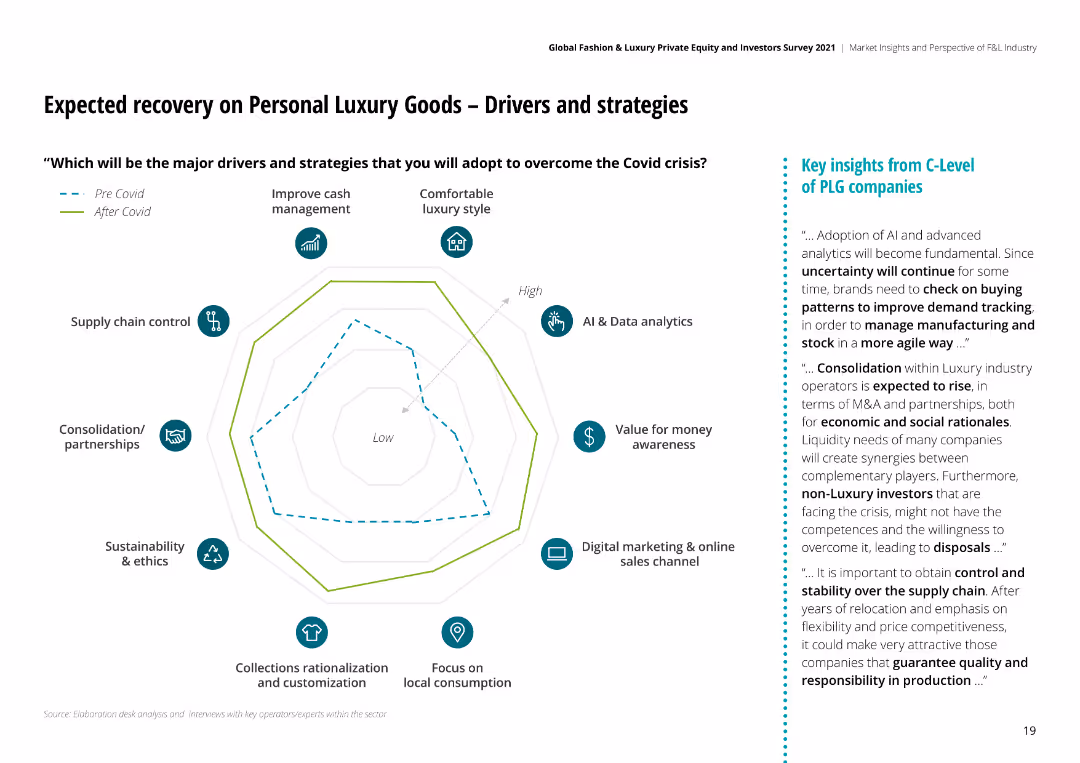
The slide includes a world map with arrows indicating expected recovery rates for different regions, along with textual analysis on recovery insights by geography.
Market Analysis and Trends
Retail & E-commerce
Discusses expected recovery rates for the luxury market by geographical area post-COVID, highlighting variations in recovery speed and market segments.
recovery, geographical area, luxury, market, post-COVID, retail, e-commerce, regions, analysis
Mixed Chart
Deloitte
Saved
Slide includes complex elements such as key macroeconomic driver icons and a line chart comparing actual vs. model estimates of economic growth.
Operational Efficiency
Professional Services
Offers an in-depth view of Deloitte Access Economics' forecast models and their relationship with work put in place/work done in New Zealand and Australia. The slide details specific macroeconomic variables affecting forecasts and includes a visual comparison of model accuracy.
Forecasting, Macroeconomic, New Zealand, Australia, Economic Analysis, Regression Models, Accuracy, WPIP
Mixed Chart
Deloitte
Saved
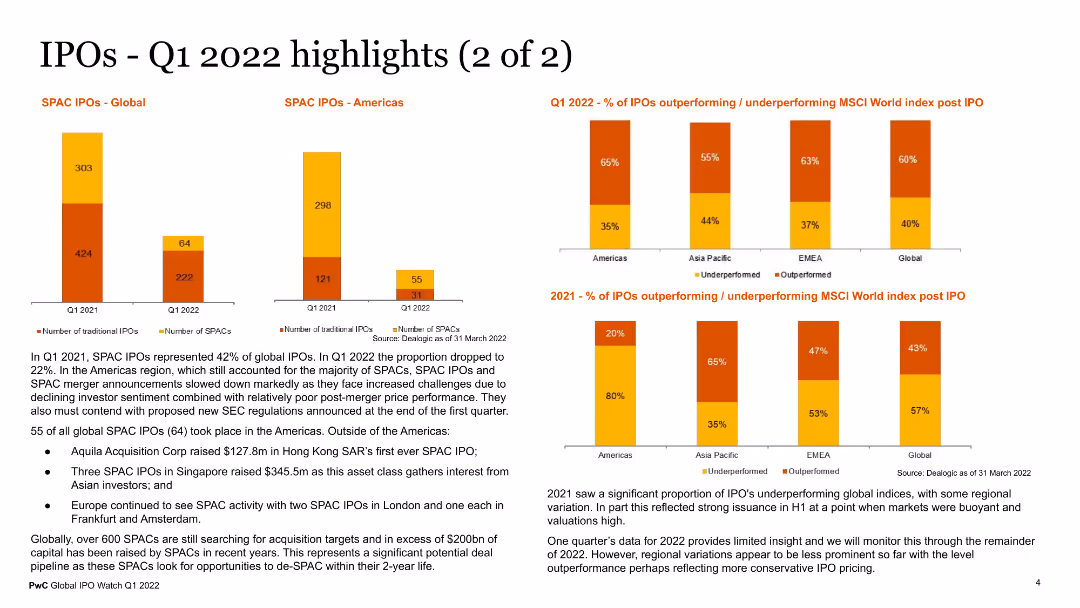
The slide includes visual elements such as a column chart for SPAC IPOs globally and in the Americas, and a bar chart showing the percentage of IPOs outperforming or underperforming MSCI World Index post IPO. The charts use different colors for clarity. Text sections provide additional context on SPAC activities and IPO performance trends.
Market Analysis and Trends
Financial Services
This slide provides additional highlights of IPO activities in Q1 2022, focusing on SPAC IPOs and performance metrics against the MSCI World Index. It offers insights into the performance and trends of SPACs and traditional IPOs, useful for financial analysts and investors.
SPAC IPOs, Q1 2022, IPO performance, MSCI World Index, financial trends
Multiple Chart
PwC/Strategy&
Saved
Multiple area charts tracking corporate resilience across various sectors with a focus on different types of disruptions from 2017 to 2022.
Strategic Planning
Professional Services
Analyzes how companies adapt and thrive amidst various disruptions including economic and technological changes, emphasizing resilience and strategic adaptation.
corporate resilience, disruptions, strategic adaptation, economic change, technological change, 2017-2022, sectors, adaptability
Multiple Chart
Accenture
Saved
This slide features a diagram comparing cost differences in the wheat supply chains of Australia and Canada, with annotations highlighting key findings.
Operational Efficiency
Transportation & Logistics
The slide compares the cost structures of the wheat supply chains in Australia and Canada, emphasizing the higher domestic supply chain costs in Australia and identifying areas for potential improvement.
Supply chain costs, Australia, Canada, transportation, logistics, wheat supply chain, cost comparison, operational efficiency
Single Chart
LEK
Saved
Slide with bar charts reflecting consumer preferences for collaborations, segmented by nationality.
Market Analysis and Trends
Retail & E-commerce
Delve into the preferences of luxury consumers towards collaborations, showing strong appeal in different styles and collections.
Luxury consumers, collaborations, preferences, styles, collections, nationality, consumer insights, market trends
Multiple Chart
BCG
Saved
The slide compares GHG emission reduction targets, net-zero commitments, and carbon tax implementations of ASEAN countries, with visual and textual explanations of their progress.
Regulatory and Compliance
Government & Public Sector
This slide provides a comparative analysis of how ASEAN countries are balancing economic development with decarbonization, detailing their emission reduction targets and carbon tax policies.
GHG emissions, decarbonization, ASEAN, government targets, economic development, comparative analysis, policies
Multiple Chart
BCG
Saved
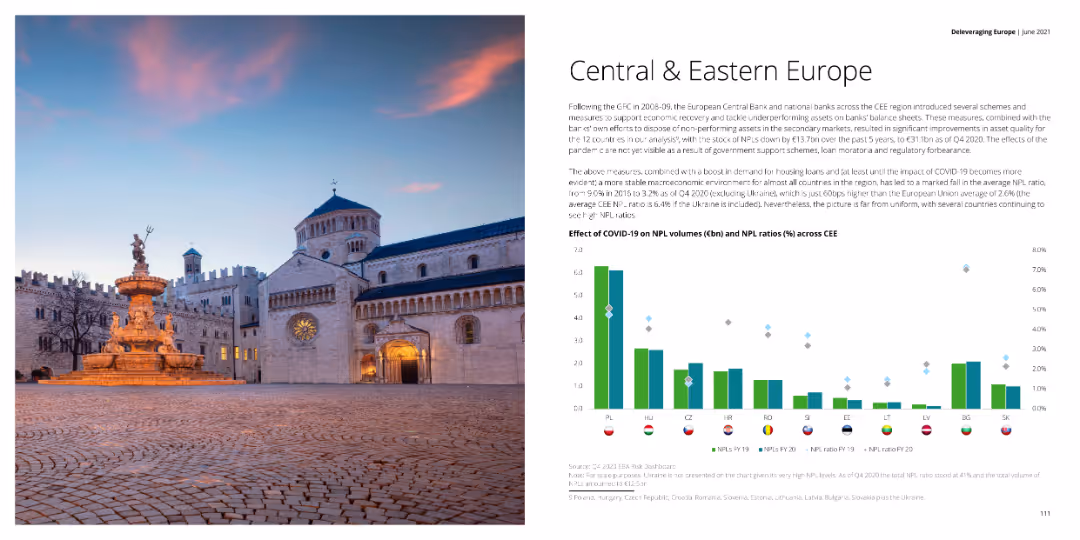
The slide includes a column chart showing the effect of COVID-19 on NPL volumes and ratios across CEE countries, with a text block summarizing the impacts and measures taken by banks. The left side contains an image of a cathedral.
Market Analysis and Trends
Financial Services
The slide analyzes the impact of COVID-19 on NPL volumes and ratios across Central and Eastern Europe, highlighting measures taken by banks and government schemes to support the financial sector.
NPL, COVID-19, financial impact, CEE, measures
Mixed Chart
Deloitte
Saved
The slide features a line chart showing wheat production volumes for Canada, Australia, and Ukraine, with annotations explaining the volatility and growth rates.
Market Analysis and Trends
Agriculture & Food Production
The slide explains the volatility in Australian wheat production compared to Canada and Ukraine, emphasizing the factors contributing to slower growth in Australia.
Wheat production, volatility, Australia, Canada, Ukraine, growth rate, agriculture, food production, market trends
Mixed Chart
LEK
Saved
The slide features a set of scatter plots comparing technology adoption rates across different regions (US, Europe, China, South Asia, Rest of the World, Global). Each scatter plot displays data for Solar, Wind, Nuclear, Coal, and Gas technologies for the years 2025 and 2050.
Market Analysis and Trends
Energy & Utilities
This slide discusses how the adoption of various energy technologies varies across different regions. It highlights the projected technology adoption rates for Solar, Wind, Nuclear, Coal, and Gas in the years 2025 and 2050, showing trends and comparisons globally.
Energy, Technology, Adoption, Rates, Global, Solar, Wind, Nuclear, Coal, Gas
Multiple Chart
EY
Saved
The slide features a timeline showing key milestones in the development of biomass-to-energy value chain products, starting from 125,000 BC to 2018. Milestones include the first biodigester in India, commercial-scale waste-to-energy plant in the US, and approval for biofuels in aviation.
Market Analysis and Trends
Energy & Utilities
This slide provides a historical overview of significant developments in the biomass-to-energy sector, emphasizing the evolution and advancements in biofuel technologies and applications over time.
biomass-to-energy, value chain, history, timeline, biodigester, biofuels, waste-to-energy, aviation
Linear Flow
Kearney
Saved
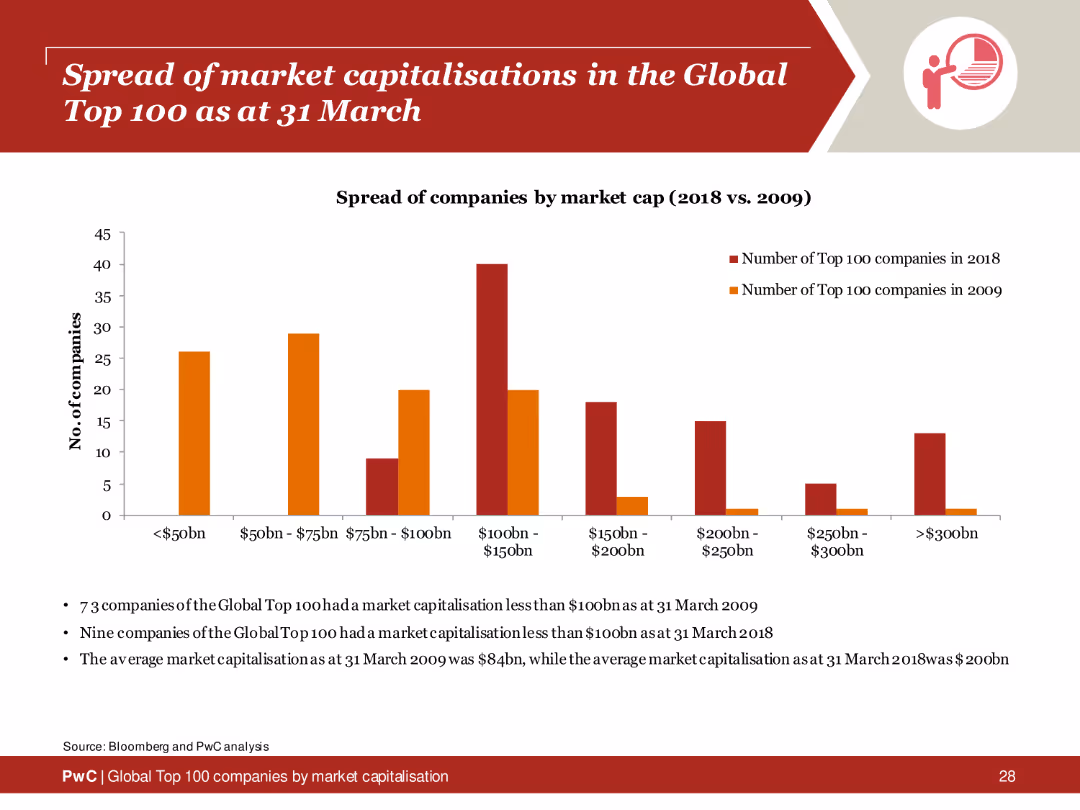
Column chart showing the distribution of market capitalizations of the Global Top 100 companies in 2009 and 2018, with textual analysis below.
Market Analysis and Trends
Financial Services
Comparison of the spread of market capitalizations among the Global Top 100 companies between 2009 and 2018, highlighting growth and changes.
market capitalisation, global top 100, 2009, 2018, spread
Mixed Chart
PwC/Strategy&
Saved
Column charts depict the investment deal values in Malaysia's internet sector, including deal count.
Investment Analysis
Technology & Software
Focuses on investment trends within Malaysia's internet sector, with data on deal values and counts from 2016 to H1 2020.
Investment, Internet sector, Malaysia, Deal values, Trends, 2016, 2020, Deal count
Single Chart
Bain
Saved
Slide with a pie chart and an image of people working on computers. The chart indicates percentages of changes to talent strategies due to generative AI. The image and chart are balanced with descriptive text.
Human Resources and Talent Management
Technology & Software
This slide examines the anticipated impact of generative AI on the workforce and talent strategies. It includes predictions on the timeline for these changes and highlights the need for education on AI capabilities, signaling potential shifts in skill requirements and employment landscapes.
AI, talent, workforce, strategy, education, impact, change, skills
Mixed Chart
Deloitte
Saved
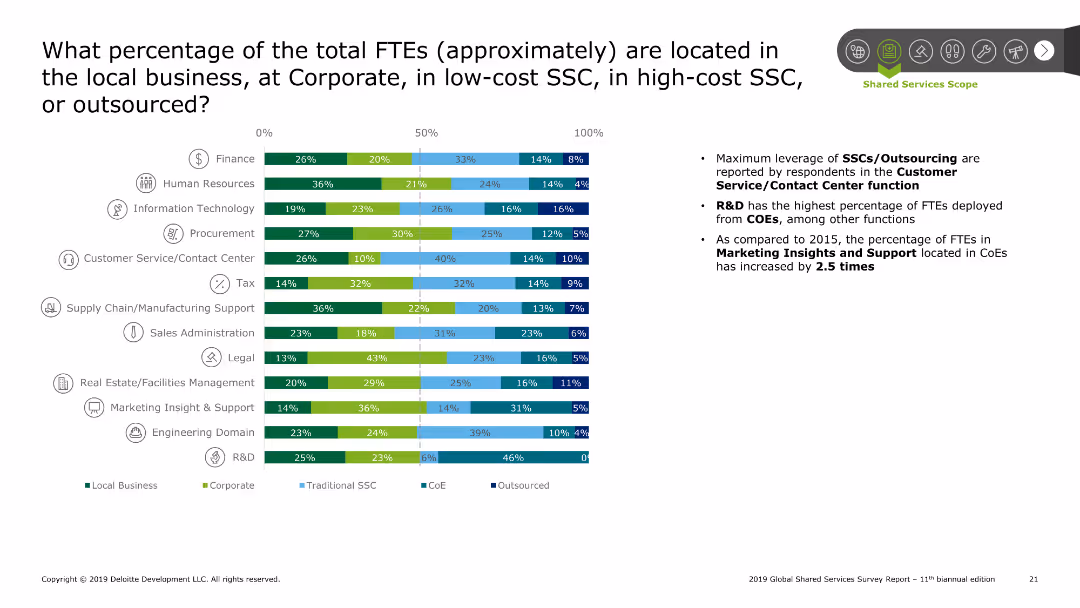
Bar chart showing the percentage of FTEs located across different settings (local, corporate, SSC, CoE, outsourced) for various functions. Summary points on the right discuss trends and findings.
Performance Metrics and KPIs
Professional Services
The slide analyzes the percentage of FTEs distributed across local business, corporate, SSCs, and outsourcing. The bar chart breaks down this data by function, highlighting significant leverage of SSCs/outsourcing in customer service and R&D. Summary points discuss the increase in FTEs located in CoEs compared to 2015.
SSC, FTE location, corporate, local, outsourcing
Mixed Chart
Deloitte
Saved
Column chart comparing economic expectations of study respondents for 2018 and 2019, with categories for upturn, boom, downturn, and recession.
Market Analysis and Trends
Financial Services
The slide analyzes the shifting economic expectations of participants in the 10th Operations Efficiency Radar, comparing sentiments from 2018 and 2019. It highlights the growing anticipation of an economic downturn among respondents, reflecting changes in business confidence and economic outlook.
Economic Expectations, Operations Efficiency, Downturn
Mixed Chart
Roland Berger
Saved
The slide is divided into two columns, each with text and images, including trend assessments.
Operational Efficiency
Consumer Goods
Discusses responsible sourcing and the circular economy, emphasizing social and environmental considerations in supply chains.
Responsible Sourcing, Circular Economy, Supply Chain, Environmental Considerations, Ethical Procurement, Sustainability
Mixed Chart
Deloitte
Saved
Previous
Next
If nothing, comes up, please save your slides first
Create a FREE account to continue browsing
Receive Instant Access to 1,000+ slides from companies like McKinsey, Google, and Goldman Sachs
First Name
Last Name
Email
Password
I agree to all
Terms & Privacy Policy
Thank you! Your submission has been received!
Oops! Something went wrong while submitting the form.
Have an account?
Sign in
Column Chart
Heatmap
Chevron
Org Chart
Infographic
Callouts
Timeline
List
Graphic
Picture
Process Flow
Diagram
Paragraph
Map
Table
Framework
Subtitle
Takeaway Box
Icon
Other Chart
Radar Chart
Waterfall Chart
Mekko Chart
Pie Chart
Scatter Plot
Line Chart
Bar chart
Bullet points