My Account
My Slides
Search by Category
Templates
Leave Feedback
Login
Logout
Get Started
Browse all Slides
Browse all Slides
Create a FREE Account
Instant access to 1,000+ real slides from top companies like McKinsey, BCG, Goldman Sachs, Google and many more!
First Name
Last Name
Email
Password
I agree to all
Terms & Privacy Policy
Thank you! Your submission has been received!
Oops! Something went wrong while submitting the form.
Have an account?
Sign in
Saved Slides
The slide includes a circular diagram showing Ipsos' competitors by sectors and specialties.
Strategic Planning
Professional Services
The slide emphasizes Ipsos' unified and modular offerings for decision makers across various sectors.
decision makers, competitors, sectors, specialties, Ipsos, modular offerings
Diagram
IPSOS
Saved
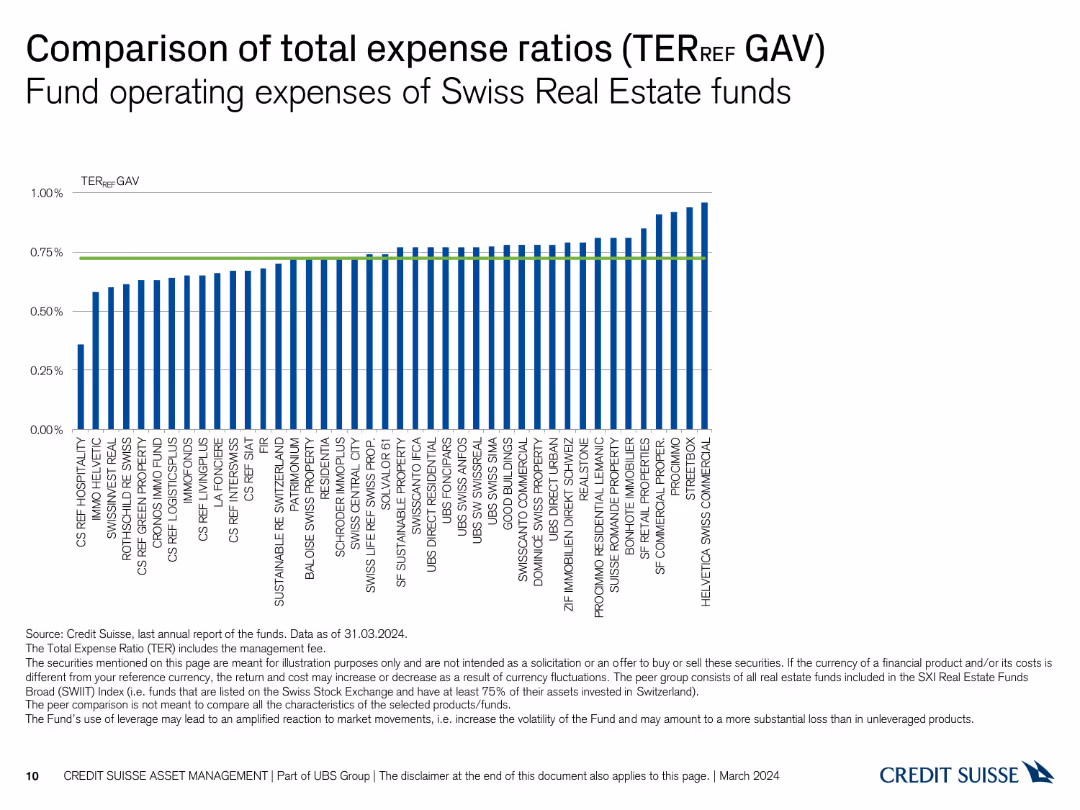
The slide displays a column chart comparing the total expense ratios (TER) of various Swiss Real Estate funds, with a green line indicating the average TER across all funds.
Financial Performance
Real Estate & Construction
This slide compares the total expense ratios (TER) of Swiss Real Estate funds, highlighting differences in operating expenses relative to gross asset value (GAV).
expense ratio, TER, real estate, funds, comparison
Single Chart
Credit Suisse
Saved
Line chart displaying the incidence of first-time home buyers from Fall 2015 to Fall 2020, showing fluctuations over the years.
Market Analysis and Trends
Real Estate & Construction
This slide tracks the percentage of first-time home buyers over several years, indicating changes in market entry rates among new buyers.
first-time buyers, incidence, trends, Fall 2015-2020, market entry, home buying
Single Chart
IPSOS
Saved
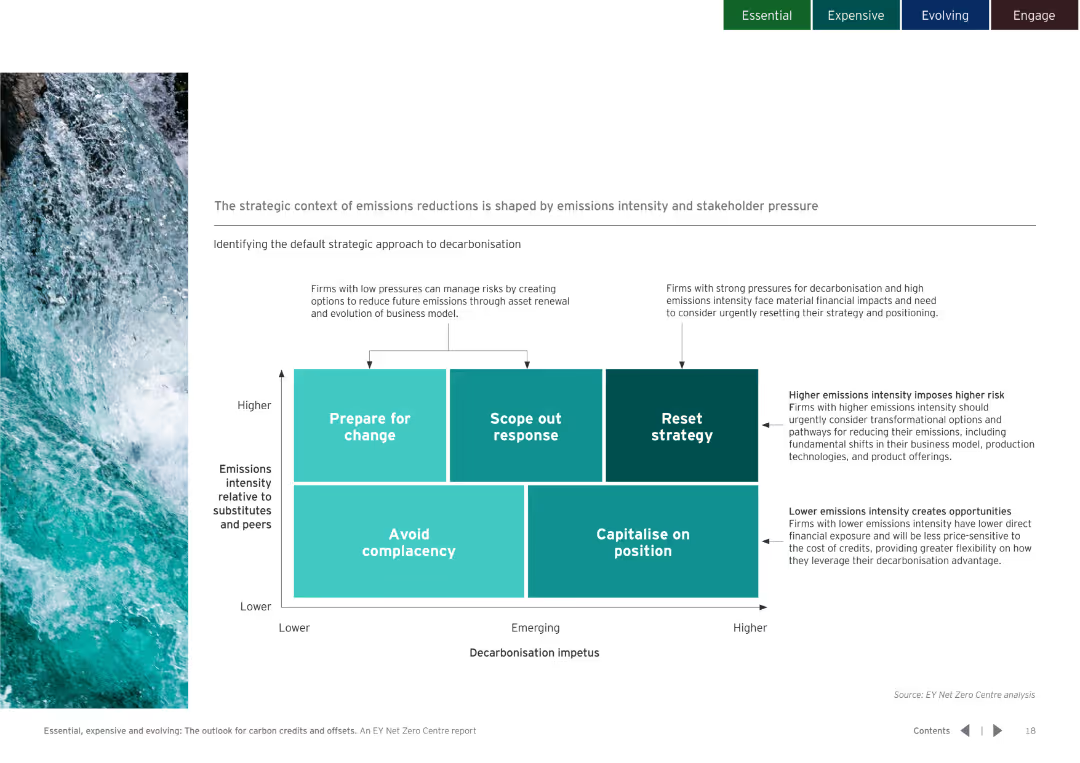
Includes a matrix diagram showing different strategic approaches to decarbonisation based on emissions intensity and stakeholder pressure.
Strategic Planning
Environmental Services & Sustainability
Identifies strategies for firms based on their emissions intensity and decarbonisation impetus, suggesting actions from preparing for change to capitalizing on position.
Emissions, reduction, strategy, decarbonisation, intensity, stakeholder, pressure, sustainability
Diagram
EY
Saved
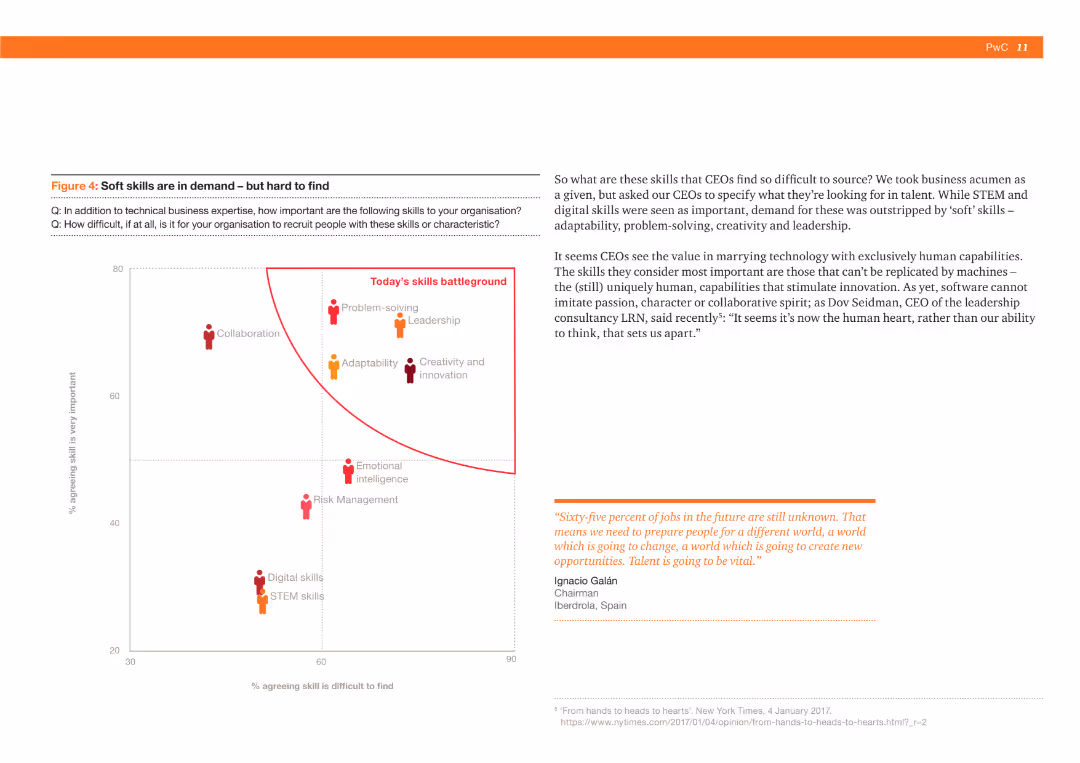
A scatter plot comparing the importance and difficulty of finding various skills like collaboration, problem-solving, and adaptability, with a focus on soft skills. Includes a quote about the future of jobs.
Human Resources and Talent Management
Professional Services
The slide discusses the challenge of finding soft skills, emphasizing their importance over technical skills, supported by a comparison chart and industry quotes.
Soft skills, Collaboration, Problem-solving, Adaptability, Leadership, Skills demand, Recruitment, Talent, Future jobs, Importance
Mixed Chart
PwC/Strategy&
Saved
This slide presents a horizontal bar chart showing percentages of agreement with statements about the priority of early childhood in societal focus. Different bars represent different statements.
Market Analysis and Trends
Education & Training
The slide indicates that a significant portion of the public agrees that early childhood should be a top priority for society, with various levels of agreement on different statements.
Early childhood, societal focus, priority, horizontal bar chart, public opinion, Ipsos, education, development, survey
Single Chart
IPSOS
Saved
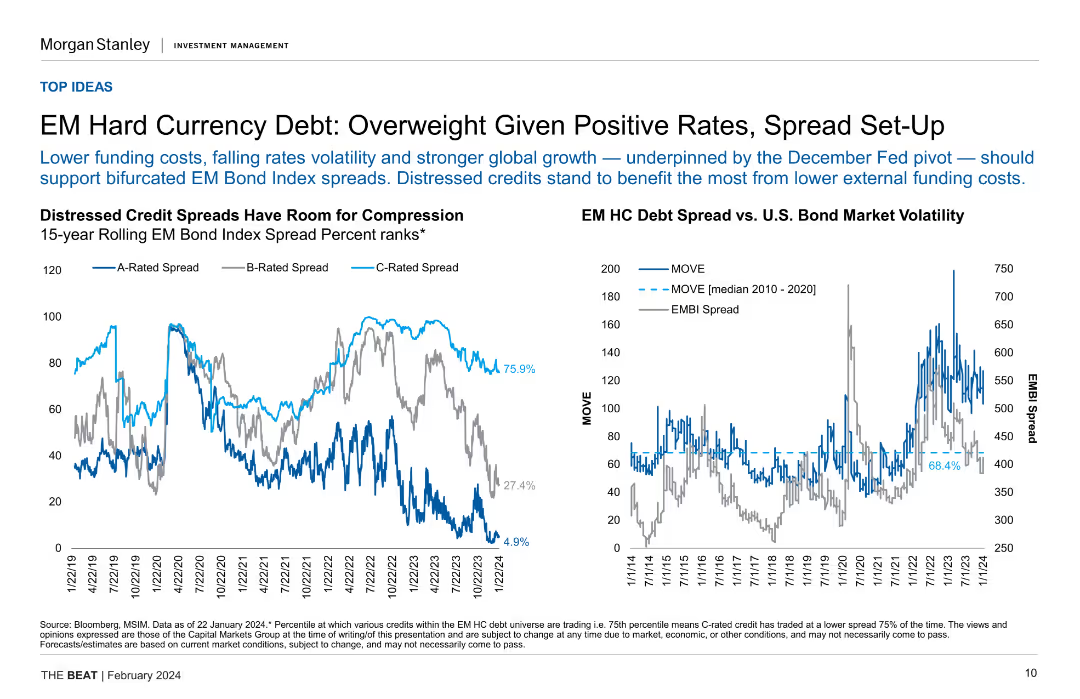
Two line charts displaying distressed credit spreads and EM hard currency debt spread vs. U.S. bond market volatility.
Investment Analysis
Financial Services
The slide supports an overweight recommendation for EM hard currency debt, citing positive rates, spread setup, and falling rate volatility.
EM debt, hard currency, distressed credit spreads, investment analysis, bond market volatility
Multiple Chart
Morgan Stanley
Saved
Includes column charts showing population growth in more and less developed regions from 2020 to 2050, highlighting the significant growth expected in the least developed areas.
Market Analysis and Trends
Government & Public Sector
Discusses the distribution of future population growth with a specific focus on developing countries. It highlights the challenges and potential impacts on global development, poverty, and resource distribution.
development, population growth, poverty, resources, demographics
Multiple Chart
Roland Berger
Saved
Complex graph showing COVID-19 case trajectories by country, color-coded lines, with detailed callouts for select countries.
Strategic Planning
Healthcare & Pharmaceuticals
This slide provides insight into how different responses affect the COVID-19 outbreak trajectory, targeting strategists and health policy planners.
trajectories, measures, COVID-19, country comparison, containment strategies, outbreak, health policy
Mixed Chart
McKinsey
Saved
Bar graph displaying Indonesia's economic growth by sector, paired with bullet points highlighting the ICT sector's resilience during COVID-19.
Risk Assessment and Management
Technology & Software
Evaluates the performance of various economic sectors, emphasizing the impact of COVID-19 on the ICT sector which has seen growth.
Economic growth, sectors, COVID-19, ICT, Indonesia, resilience, performance
Mixed Chart
Kearney
Saved
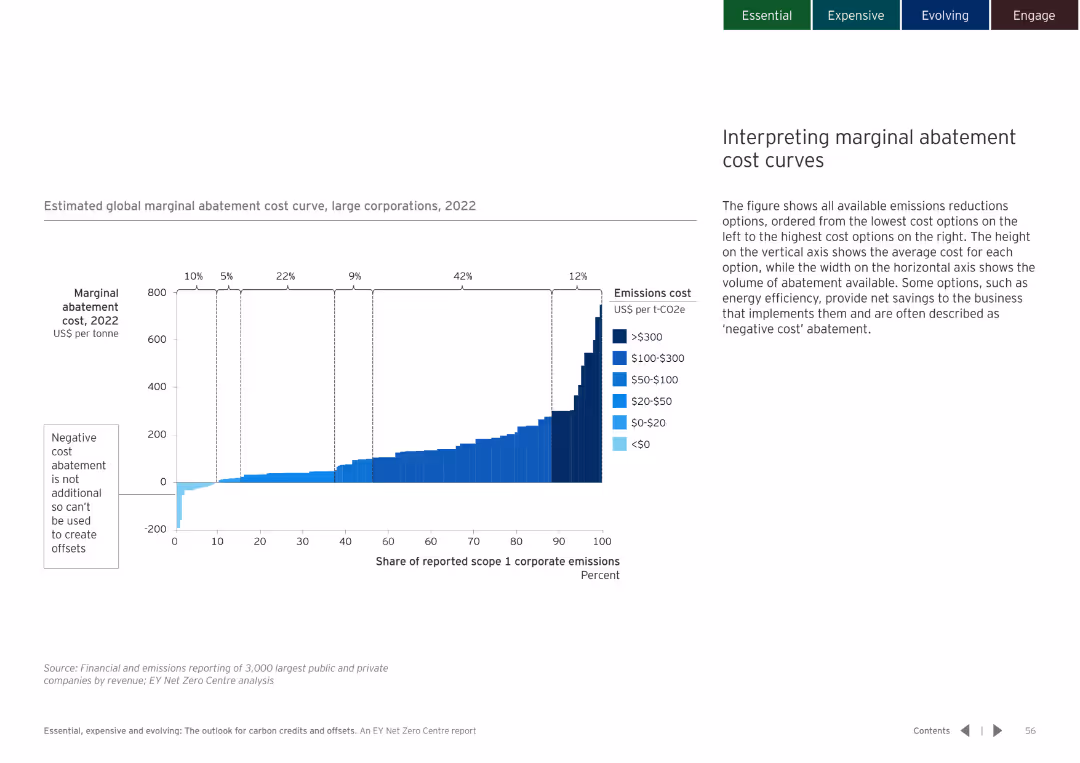
White background with a bar chart showing the marginal abatement cost curve. Clear labeling and color coding for different cost ranges.
Financial Performance
Environmental Services & Sustainability
Explains the interpretation of marginal abatement cost curves and the implications for emissions reduction strategies.
abatement cost curves, emissions reduction, cost interpretation
Mixed Chart
EY
Saved
This slide showcases deposit diversification in pie charts and a column chart. It details deposits by business segment and ICG deposits by region, alongside a sidebar explaining the composition of 'Deposits', 'Long-Term Debt', and other financial elements.
Operational Efficiency
Financial Services
Citigroup's slide on deposit diversification highlights the stability and sources of deposits across different business areas and regions. It could be used in presentations focusing on operational efficiency, stability in liquidity management, and showcasing financial resilience to stakeholders.
Deposit Diversification, Financial Stability, Citigroup, Business Segments, Regional Deposits, Liquidity Management
Multiple Chart
Citigroup
Saved
Map layout with labeled regions indicating specific global uncertainties. Uses dashed lines and callout text to highlight issues in different geographic areas.
Risk Assessment and Management
Financial Services
Identifies global uncertainties affecting the financial landscape, including the war in Ukraine, recession in the Eurozone, big tech headwinds in the US, and China’s rebound.
global uncertainties, risk, financial impact, regions, analysis
Graphic
IPSOS
Saved
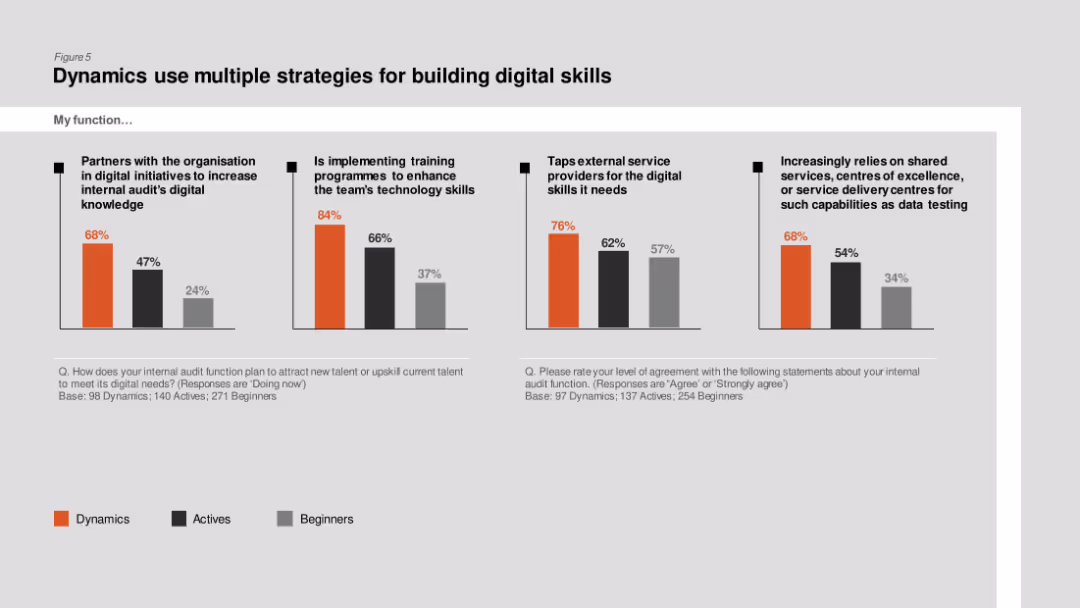
Column charts comparing strategies like partnerships, training programs, and external service providers for building digital skills among Dynamics, Actives, and Beginners.
Human Resources and Talent Management
Professional Services
The slide details various strategies used by internal audit functions to enhance digital skills, showing higher implementation of training programs and partnerships in Dynamics.
Digital skills, training programs, internal audit, partnerships, Dynamics
Multiple Chart
PwC/Strategy&
Saved
Displays rankings of proprietary card products, key partners logos, and column charts detailing purchase sales and EOP loans growth. Dominant colors are blue and grey.
Sales and Business Development
Financial Services
Discusses the leading positions of card products, showcases strategic partnerships, and presents growth data for purchase sales and EOP loans.
Cards, Partnerships, Growth, Rankings, No Fee, Cash Back, Retail Services
Multiple Chart
Citigroup
Saved
The slide includes several data representations, such as bar graphs displaying top industry focus and a line chart depicting trend evolution. It also features a list of concepts and tags.
Market Analysis and Trends
Professional Services
Focuses on the intersection of economic trends with generational impact, highlighting how social values and corporate governance are influencing industry trends.
Gen X, Millennials, Government, Financial, Nonprofit, ESG, Climate, Conservatives
Multiple Chart
Bain
Saved
The slide uses flowchart to compare the terminology used in different approaches to social impact measurement. It features lists and connecting lines to match related terms.
Industry Overview
Telecommunications
This slide compares various methodologies for measuring social impact, emphasizing the commonality despite different terminologies used. It breaks down the process into seven steps.
social impact, measurement, terminology, methodology, comparison, steps
Linear Flow
Accenture
Saved
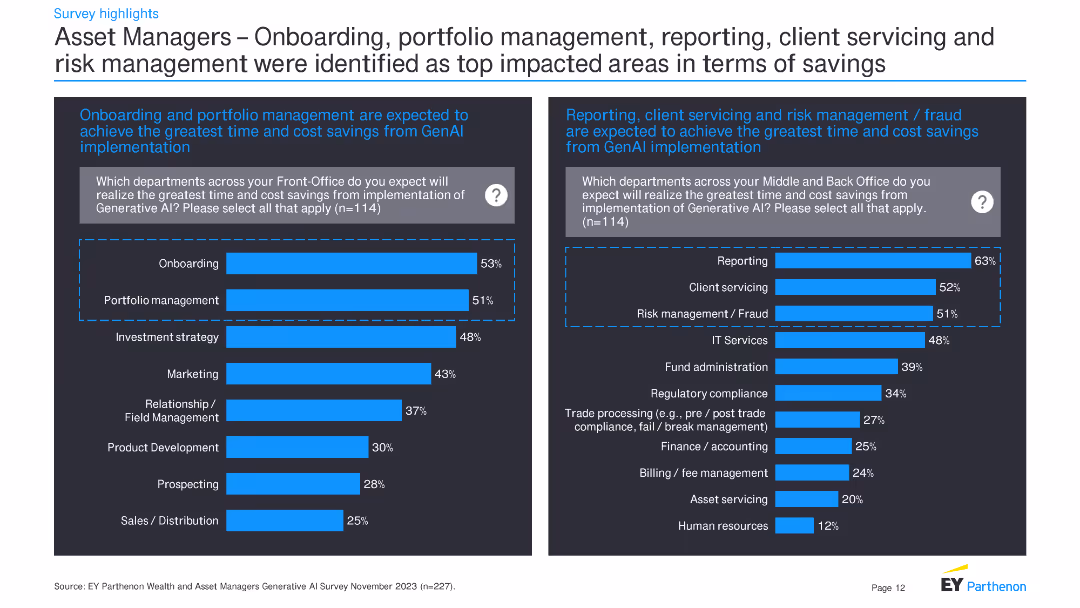
This slide contains two bar charts showing which departments in asset management expect the greatest time and cost savings from GenAI implementation. Additional text provides context and detailed survey findings.
Operational Efficiency
Financial Services
The slide presents survey data on anticipated time and cost savings in asset management from GenAI implementation. It focuses on departments like onboarding, portfolio management, and reporting.
GenAI, time savings, cost savings, asset management, onboarding, portfolio management, reporting, survey
Multiple Chart
EY
Saved
Pie charts representing FICO scores and homeowner vs renter percentages, alongside column charts for deposit balance changes. Text sections providing additional context.
Risk Assessment and Management
Financial Services
Presentation of the consumer loan portfolio's credit quality, focusing on super prime borrowers and homeowners. Used for discussing risk management and financial stability in lending practices.
consumer loans, credit quality, FICO scores, homeownership, banking, risk management
Multiple Chart
Morgan Stanley
Saved
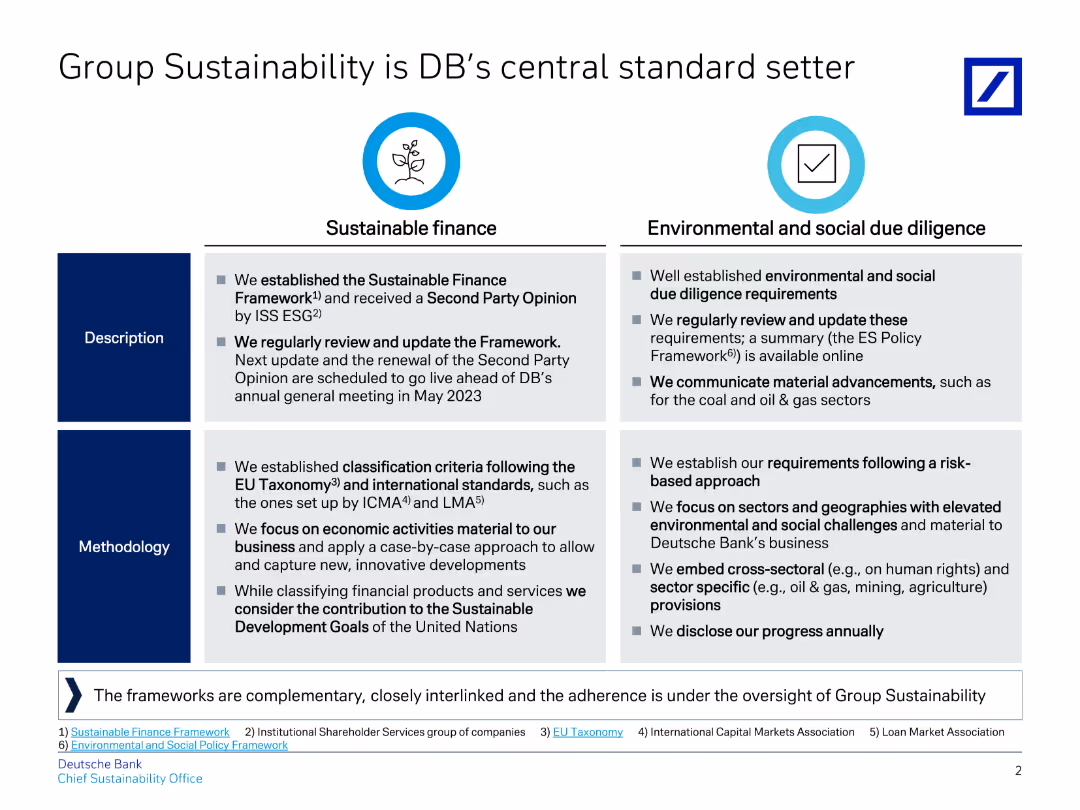
Contains two columns with descriptions and methodologies for Sustainable Finance and Environmental and Social Due Diligence, along with supporting text.
Regulatory and Compliance
Financial Services
The slide compares sustainable finance practices with environmental and social due diligence, highlighting Deutsche Bank's commitment to these standards and regular updates.
Sustainability, finance, due diligence, standards, methodology, banking, ESG, framework, compliance, regulation
Table
Deutsche Bank
Saved
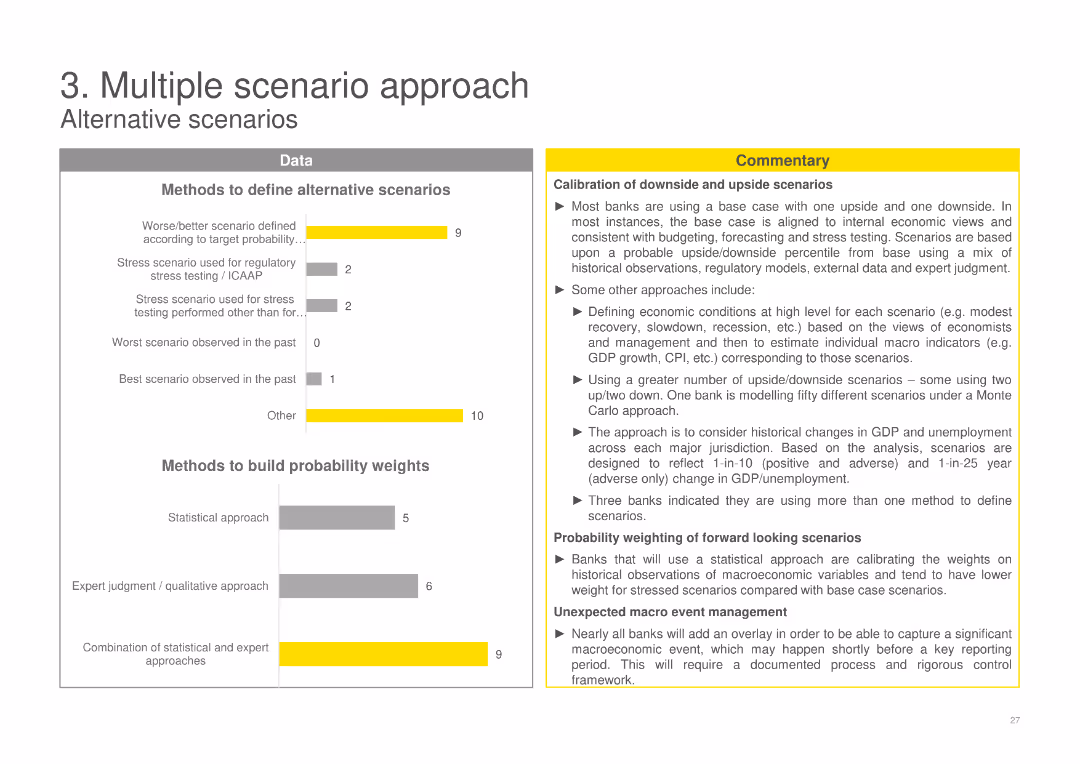
Column charts displaying methods to define alternative scenarios and build probability weights, alongside a detailed commentary section.
Risk Assessment and Management
Financial Services
Explores methods banks use to define alternative scenarios and build probability weights for ECL, including historical data and expert judgment approaches.
ECL, scenarios, probability, banks, methods, historical, expert judgment, weights, alternative, downside
Multiple Chart
EY
Saved
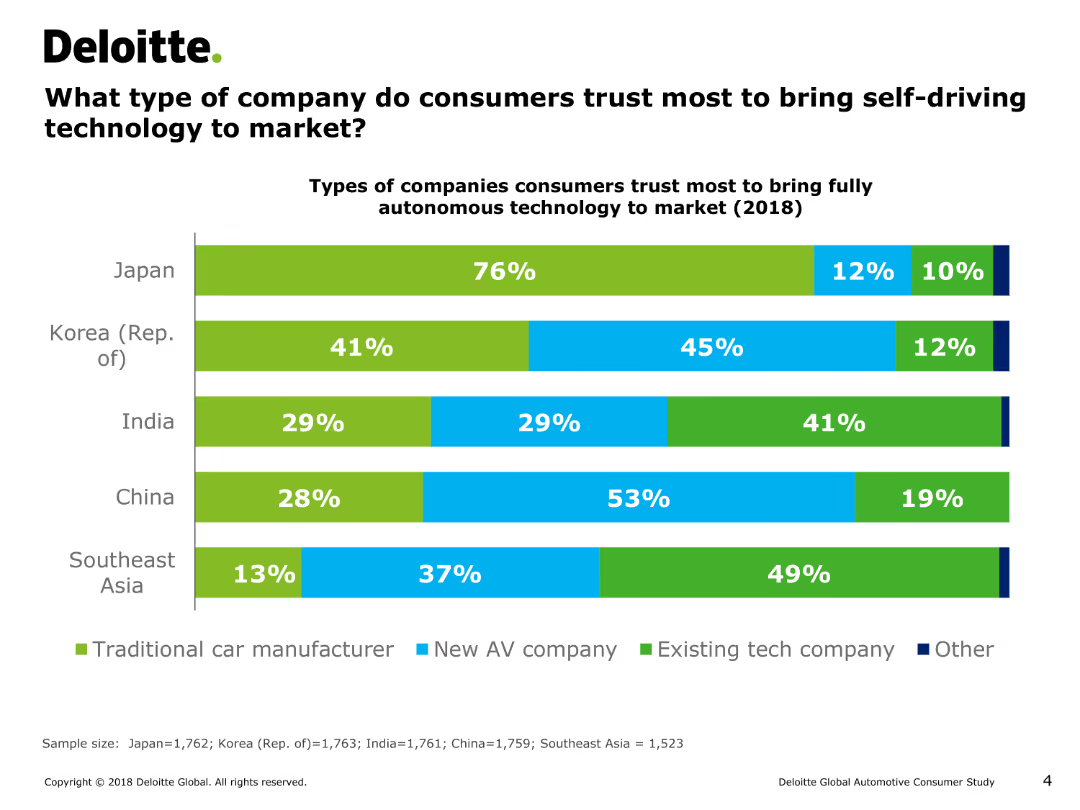
The slide features a horizontal bar chart (bar chart) depicting consumer trust in different types of companies for bringing self-driving technology to market across various countries.
Market Analysis and Trends
Transportation & Logistics
This slide presents data on the types of companies (traditional car manufacturers, new AV companies, existing tech companies, others) that consumers in Japan, Korea, India, China, and Southeast Asia trust to bring self-driving technology to market.
consumer trust, self-driving technology, market analysis, bar chart, autonomous technology, transportation, automotive industry, consumer preferences
Single Chart
Deloitte
Saved
Includes bar graphs and percentages showcasing merchant use of digital platforms and expectations for future use. Bright, contrasting colors.
Strategic Planning
Technology & Software
Discusses the reliance of Thai merchants on digital platforms and their plans for increased utilization of digital and financial services.
Merchants, Digital, Technology, Thailand, Future, Financial Services, Tools, Adaptation
Multiple Chart
Bain
Saved
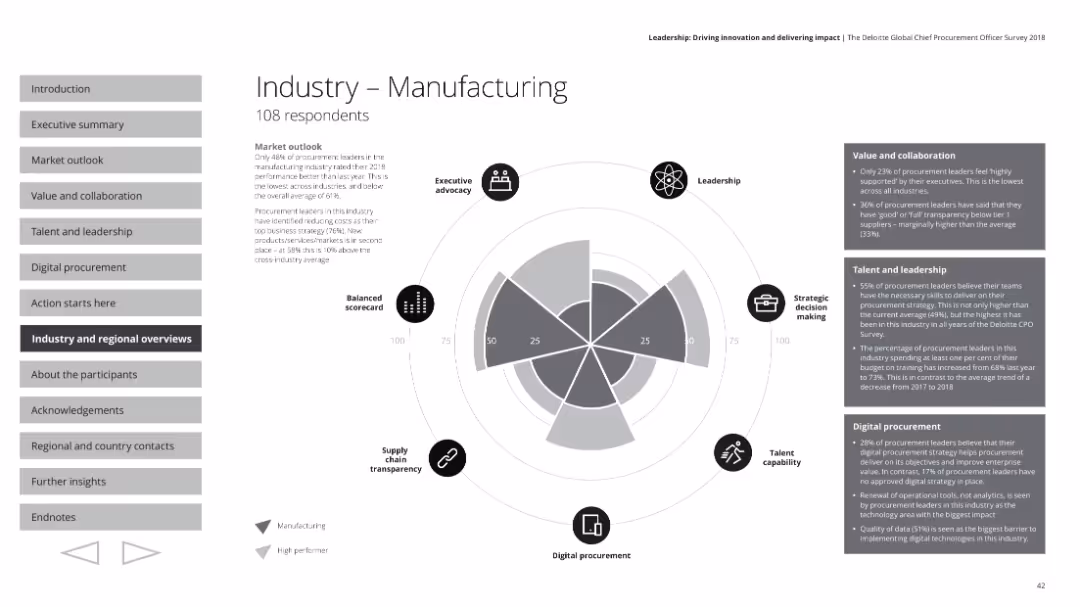
The slide includes a radar chart depicting various performance metrics, text boxes with detailed survey insights, and small icons representing different aspects.
Industry Overview
Industrial & Manufacturing
This slide presents the manufacturing industry's procurement performance based on survey results. It includes sections on executive advocacy, leadership, strategic decision making, talent capability, digital procurement, and supply chain transparency, alongside a market outlook and specific metrics on value, collaboration, talent, and leadership.
Manufacturing, procurement, industry performance, radar chart, market outlook
Mixed Chart
Deloitte
Saved
Features line graphs comparing the sex ratio at birth (SRB) across various countries from 1970 to 2017, highlighting trends and disparities.
Market Analysis and Trends
Government & Public Sector
Discusses the implications of gender ratio imbalances in selected countries, exploring the causes and long-term impacts of skewed sex ratios. It provides a historical perspective on how policies and cultural factors have shaped these trends.
gender ratio, demographics, policy, cultural impact, trends
Mixed Chart
Roland Berger
Saved
Previous
Next
If nothing, comes up, please save your slides first
Create a FREE account to continue browsing
Receive Instant Access to 1,000+ slides from companies like McKinsey, Google, and Goldman Sachs
First Name
Last Name
Email
Password
I agree to all
Terms & Privacy Policy
Thank you! Your submission has been received!
Oops! Something went wrong while submitting the form.
Have an account?
Sign in
Column Chart
Heatmap
Chevron
Org Chart
Infographic
Callouts
Timeline
List
Graphic
Picture
Process Flow
Diagram
Paragraph
Map
Table
Framework
Subtitle
Takeaway Box
Icon
Other Chart
Radar Chart
Waterfall Chart
Mekko Chart
Pie Chart
Scatter Plot
Line Chart
Bar chart
Bullet points