My Account
My Slides
Search by Category
Templates
Leave Feedback
Login
Logout
Get Started
Browse all Slides
Browse all Slides
Create a FREE Account
Instant access to 1,000+ real slides from top companies like McKinsey, BCG, Goldman Sachs, Google and many more!
First Name
Last Name
Email
Password
I agree to all
Terms & Privacy Policy
Thank you! Your submission has been received!
Oops! Something went wrong while submitting the form.
Have an account?
Sign in
Saved Slides
The slide features a table with non-GAAP financial metrics and a column chart showing revenue and EBITDA for multiple quarters.
Financial Performance
Financial Services
It outlines non-GAAP profit and loss figures, including revenue, cost of services, SG&A expenses, and adjusted EBITDA.
Non-GAAP, Revenue, EBITDA, SG&A, Cost of Services, Adjustments
Multiple Chart
Gartner
Saved
Features a list and several icons representing inefficiencies, alongside a table chart assessing inefficiency levels, with the maritime industry focus prominently displayed.
Operational Efficiency
Transportation & Logistics
Analyzes inefficiencies within the maritime industry, promoting greener solutions and the utilization of shared platforms to reduce waste and enhance customer relations.
maritime, inefficiencies, greener solutions, lifecycle, platforms
Header Vertical
Accenture
Saved
Multiple graphs including a column chart for net revenue performance, and line charts for spreads, unemployment, and household debt.
Financial Performance
Financial Services
This slide showcases SP’s revenue diversification and stable performance through various economic cycles, highlighting key financial metrics.
Revenue diversification, performance, economic cycles, financial metrics, net revenue
Multiple Chart
Credit Suisse
Saved
Slide contains multiple bar charts. The layout is clean with blue and gray color scheme, minimal text outside the charts.
Human Resources and Talent Management
Professional Services
Discusses strategies and challenges in talent management within GBS, highlighting key initiatives and challenges with talent retention and acquisition.
Talent management, GBS, initiatives, challenges, retention
Multiple Chart
Deloitte
Saved
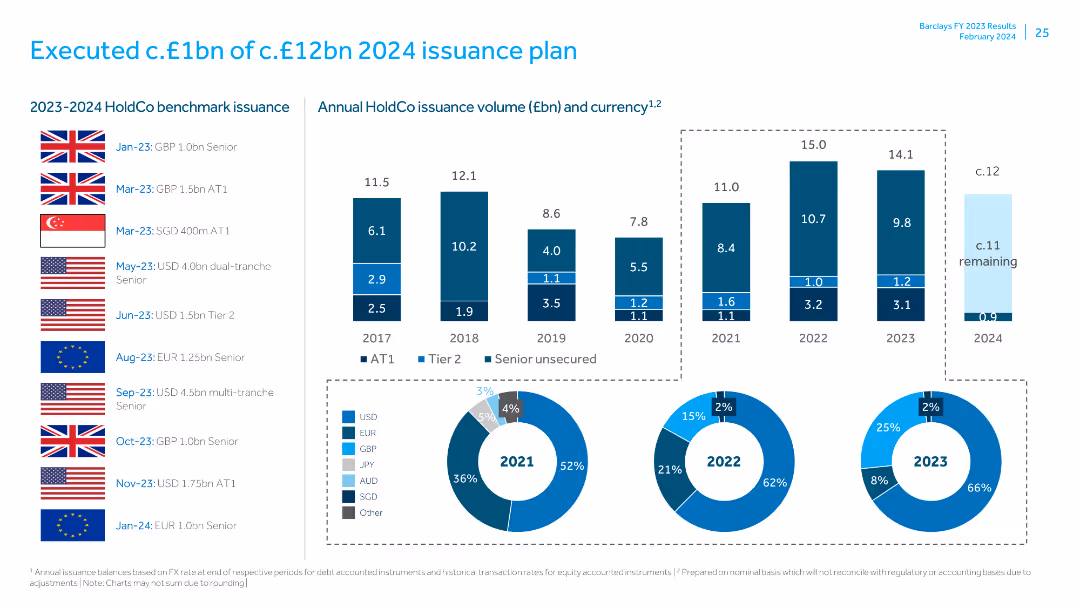
Features flags and column charts showing HoldCo benchmark issuance volumes and currency distribution for different years.
Financial Performance
Financial Services
Reviews the progress and details of the HoldCo issuance plan, including executed and remaining issuance volumes, and the distribution across different currencies.
issuance plan, HoldCo, financial performance, benchmark issuance, currency distribution, annual issuance, financial review, executed issuance, remaining issuance, financial planning
Multiple Chart
Barclays
Saved
The slide includes multiple text boxes highlighting pain points for Canadian scale-ups, with icons for talent, IP, ventures, impact, and champions. It has a backdrop of mountains at sunset and a detailed discussion of various challenges.
Market Analysis and Trends
Technology & Software
Discusses the challenges faced by Canadian scale-ups in climate tech, focusing on talent, R&D, scaling, and producing global champions. Highlights specific pain points and suggests areas for improvement.
Scale-ups, Climate tech, Canada, Challenges, Analysis
Table
BCG
Saved
A structured layout with block elements and a sidebar detailing client wins. The slide utilizes blue shading to differentiate between the types of management and coaching services, with numerical data and percentages provided.
Organizational Structure and Change
Financial Services
Showcasing the expansion of wealth management through corporate relationships, this slide illustrates client growth and service coverage. It may serve to discuss the impact of corporate partnerships on personal financial management services and client engagement strategies.
Corporate relationships, Wealth management, Client engagement, Financial management, Growth
Table
Goldman Sachs
Saved
Features detailed column charts comparing global water demand projections for 2015 versus 2050 by sector, such as domestic, livestock, manufacturing, and electricity.
Market Analysis and Trends
Environmental Services & Sustainability
Offers a projection of water demand growth by 2050, emphasizing the increased need in sectors like manufacturing and electricity. This slide is critical for planning in environmental management and sustainability, showing where the greatest increases in water usage are expected.
water demand, projections, 2050, manufacturing, electricity
Multiple Chart
Roland Berger
Saved
Two column charts comparing bank-wide market and credit risk RWA for 1Q21 and 1Q22. Text boxes outline recalibrated risk profiles and strategic areas of reinvestment.
Risk Assessment and Management
Financial Services
This slide shows the recalibration of the aggregate risk profile, including the reduction in risk-weighted assets (RWA) and leverage exposure, managed reductions, and strategic reinvestment in specific areas.
risk profile, recalibrated, strategic areas, RWA, leverage exposure
Mixed Chart
Credit Suisse
Saved
Line graphs comparing profitability trends relative to market disruptions between profitable growth companies and their peers.
Financial Performance
Financial Services
Discusses how companies that focus on profitability manage to grow despite facing significant disruptions, with comparative data over time.
profitability, market disruptions, growth companies, financial crisis, pandemic, comparative data, profitability trends
Mixed Chart
Accenture
Saved
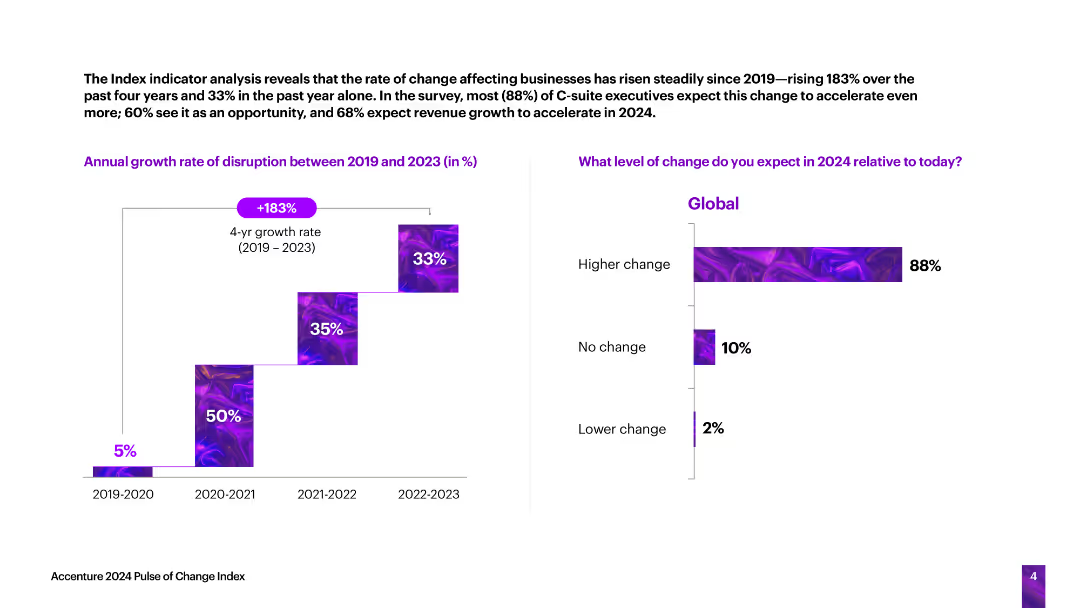
The slide features a vertical column chart showing the annual growth rate of business disruption from 2019 to 2023, and a horizontal bar chart predicting the level of change in 2024.
Technology and Digital Transformation
Technology & Software
The slide analyzes the rate of change affecting businesses, indicating a significant increase in disruption over the past four years and expectations for further changes in 2024.
business disruption, growth rate, change, predictions, technology
Multiple Chart
Accenture
Saved
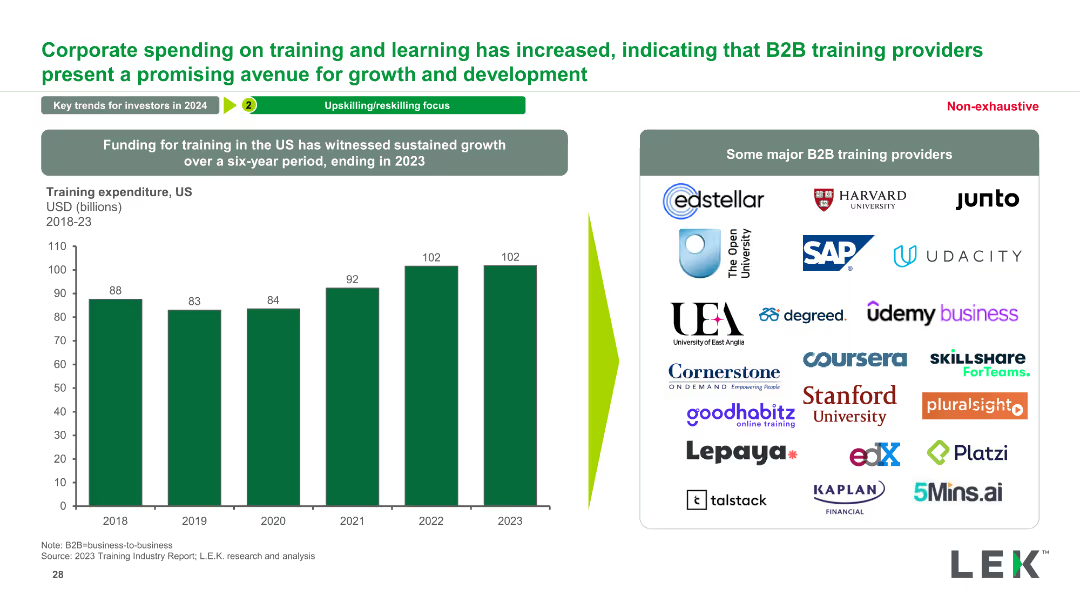
The slide contains a column chart showing the US training expenditure from 2018-2023 and a list of major B2B training providers, supported by logos and brief descriptions.
Financial Performance
Education & Training
This slide highlights the increase in corporate spending on training and learning, indicating growth opportunities for B2B training providers, supported by expenditure data.
corporate spending, training, learning, B2B training providers, growth opportunities, financial performance, training expenditure
Mixed Chart
LEK
Saved
It includes a large column chart with data points in blue, visual representations of percentages, and a series of bullet points on a white and blue background.
Financial Performance
Financial Services
This slide shows the financial outcomes of personal banking and wealth management, including net interest income, revenues, and net income, accompanied by key performance indicators. Suitable for assessing the health and trends of personal banking and wealth management services.
wealth management, personal banking, net interest, revenue, credit costs
Mixed Chart
Citigroup
Saved
Column chart showing a slight increase from 5.1 to 5.2 between August 2021 and September 2022 in marketing leaders' effectiveness at demonstrating marketing's bottom-line impact to other C-suite members.
Customer and Market Segmentation
Professional Services
Discusses the effectiveness of marketing leaders in communicating the value of marketing strategies to other executives, showing a positive trend in their ability to link marketing efforts to company financials.
Marketing, Leadership, C-Suite, Communication, Bar Chart, Bottom-Line Impact, 2021-2022
Mixed Chart
Deloitte
Saved
Detailed list and icons representing sectors with foreign ownership restrictions in the Philippines, structured in a clear, readable format.
Regulatory and Compliance
Government & Public Sector
Outlines foreign ownership limits in various sectors as per the Philippines' laws, providing essential information for foreign investors.
Foreign ownership, Philippines, restrictions, sectors, investment
Table
Deloitte
Saved
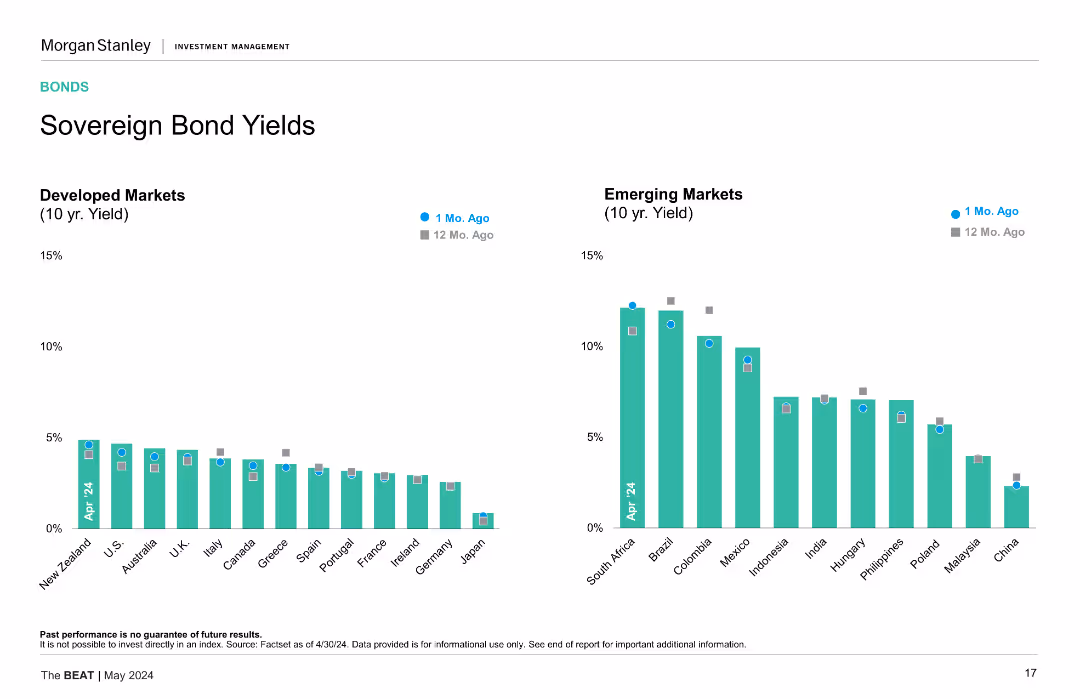
This slide displays two vertical bar charts side by side. The left chart shows 10-year yields for developed markets, while the right chart shows the same for emerging markets, comparing data from 1 month ago and 12 months ago.
Market Analysis and Trends
Financial Services
The slide presents a comparison of sovereign bond yields between developed and emerging markets over the past year, highlighting yield changes and potential market implications.
Sovereign Bonds, Yields, Developed Markets, Emerging Markets, Comparison, Financial Analysis
Multiple Chart
Morgan Stanley
Saved
A comprehensive slide with a tabulated performance analysis of various indices including coupon, yield, spread, and total returns.
Investment Analysis
Financial Services
The slide breaks down the performance of various financial indices, providing a granular look at coupons, yields, and total returns.
performance analysis, financial indices, coupon, yield, returns
Table
Morgan Stanley
Saved
Two content sections for different green finance initiatives. Logos of OCBC and Standard Chartered.
Financial Performance
Financial Services
Discusses green finance achievements such as a significant trade finance facility and a sustainability-linked loan. Used for financial strategy communication related to sustainability efforts.
green finance, sustainability, trade finance, loan, decarbonization, banking
Header Horizontal
Morgan Stanley
Saved
The slide features a mix of table, logos, and textual content divided into sections labeled 'Mission', 'Investment principles', and 'Portfolio as at 2023'.
Investment Analysis
Financial Services
Discusses Barclays' Sustainable Impact Capital initiative focusing on investments in climate technology, including the investment principles and portfolio examples.
climate change, investment, technology, decarbonization, innovation, portfolio, sustainable, economic, impactful, strategic
Framework
Barclays
Saved
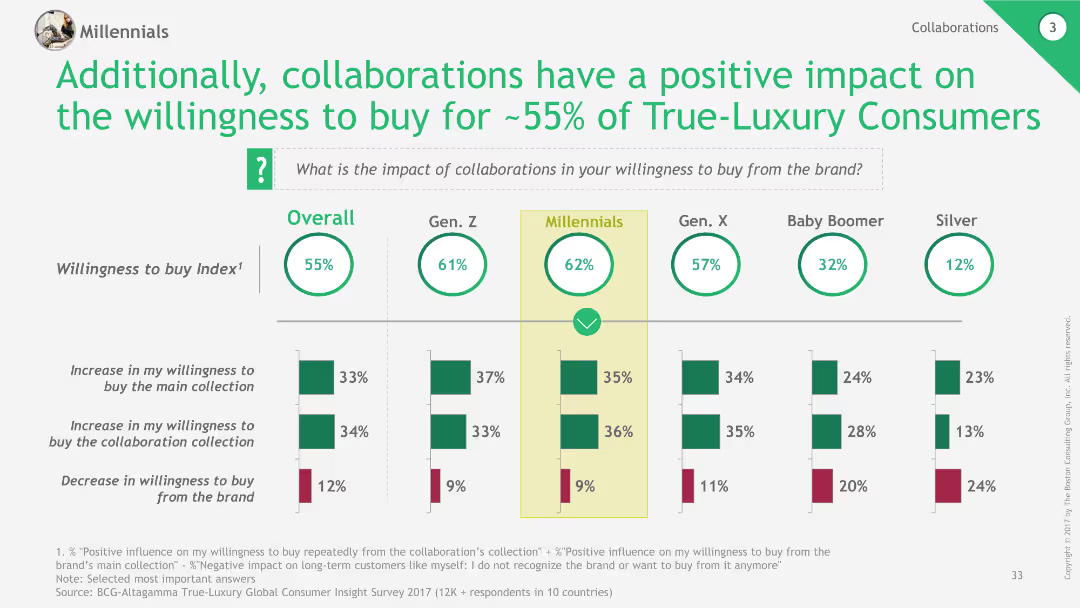
Column chart illustrating the impact of collaborations on willingness to buy among True-Luxury Consumers, segmented by generation.
Market Analysis and Trends
Retail & E-commerce
The slide highlights the positive influence of brand collaborations on consumers' willingness to buy, particularly among younger generations.
collaborations, willingness to buy, luxury, consumer behavior, retail
Multiple Chart
BCG
Saved
The slide has two sections with stacked column charts: the top section shows investment values across deal segments, and the bottom section illustrates the number of deals in each segment.
Investment Analysis
Financial Services
This slide provides an overview of PE/VC investments split across deal segments, detailing both the value and the number of deals in each segment.
PE/VC investments, deal segments, investment values, deal count, financial analysis
Multiple Chart
EY
Saved
The slide displays two line charts. The left chart shows the quarterly real GDP growth of developed markets, with distinct lines for the US, Eurozone, and Japan. The right chart shows the same for emerging markets, including China, India, and Brazil.
Market Analysis and Trends
Financial Services
The slide forecasts global GDP growth for developed and emerging markets, providing year-over-year change data. It is used for analyzing future economic conditions and making strategic financial decisions.
global growth, GDP, forecasts, developed markets, emerging markets, US, Eurozone, Japan, China, India, Brazil
Multiple Chart
JP Morgan
Saved
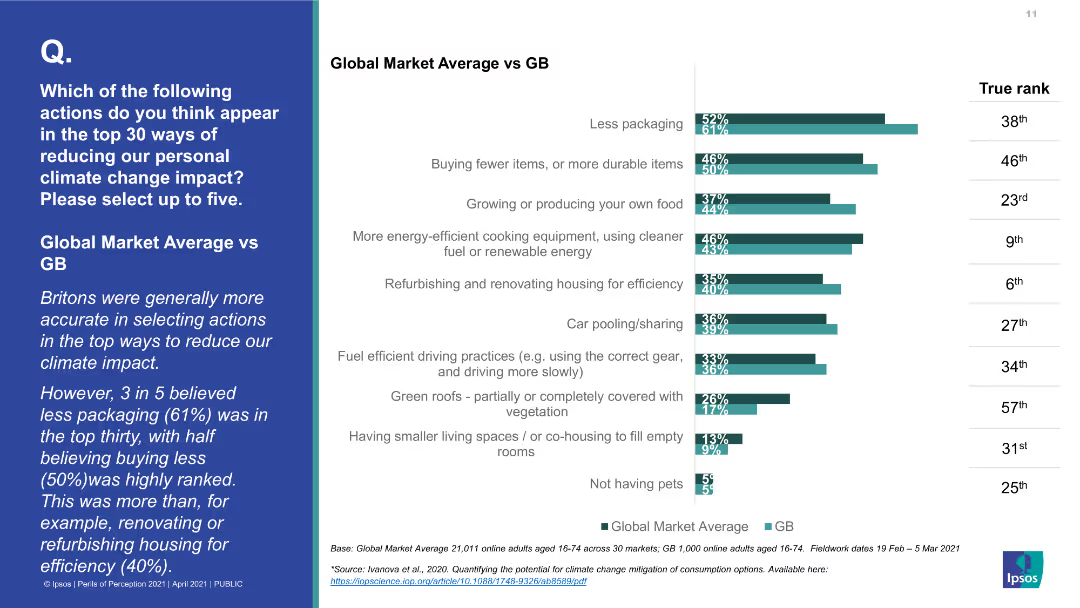
A bar chart comparing Global Market Average vs. GB for various actions to reduce personal climate change impact. The bars indicate the percentage of people selecting each action.
Market Analysis and Trends
Environmental Services & Sustainability
The slide compares how Britons and the global average rate the effectiveness of various actions to reduce personal climate change impact, with a focus on differences in perception and actual impact rankings.
climate change impact, personal actions, public perception, Global Market Average, Great Britain, environmental impact, top actions
Mixed Chart
IPSOS
Saved
Two bar charts showing customer and country exposure by percentage of NBV, with associated airline and country flags.
Market Analysis and Trends
Transportation & Logistics
Analyzes Aircastle’s global market distribution by detailing customer base and country-specific aircraft exposure.
aviation, global, market, distribution, customer, airlines, exposure
Multiple Chart
Deutsche Bank
Saved
A column chart showing year-over-year percentage change in real GDP from 2022 to 2025F for various developed countries including the US, Canada, UK, Euro area, Germany, France, Italy, Spain, Japan, and Australia. Colors represent different years.
Market Analysis and Trends
Financial Services
This slide forecasts modest to moderate economic activity in developed markets for 2024, highlighting cost fatigue and labor market resilience.
economic forecast, developed markets, GDP, 2024, labor market resilience, cost fatigue
Single Chart
EY
Saved
Previous
Next
If nothing, comes up, please save your slides first
Create a FREE account to continue browsing
Receive Instant Access to 1,000+ slides from companies like McKinsey, Google, and Goldman Sachs
First Name
Last Name
Email
Password
I agree to all
Terms & Privacy Policy
Thank you! Your submission has been received!
Oops! Something went wrong while submitting the form.
Have an account?
Sign in
Column Chart
Heatmap
Chevron
Org Chart
Infographic
Callouts
Timeline
List
Graphic
Picture
Process Flow
Diagram
Paragraph
Map
Table
Framework
Subtitle
Takeaway Box
Icon
Other Chart
Radar Chart
Waterfall Chart
Mekko Chart
Pie Chart
Scatter Plot
Line Chart
Bar chart
Bullet points