My Account
My Slides
Search by Category
Templates
Leave Feedback
Login
Logout
Get Started
Browse all Slides
Browse all Slides
Create a FREE Account
Instant access to 1,000+ real slides from top companies like McKinsey, BCG, Goldman Sachs, Google and many more!
First Name
Last Name
Email
Password
I agree to all
Terms & Privacy Policy
Thank you! Your submission has been received!
Oops! Something went wrong while submitting the form.
Have an account?
Sign in
Saved Slides
Utilizes icons and brief points to propose strategies like ecosystem development and scaling for market leadership.
Strategic Planning
Retail & E-commerce
Suggests actionable strategies for businesses to dominate in competitive markets, focusing on digital and network growth.
market strategies, digital growth, ecosystem, scaling
Pillar
BCG
Saved
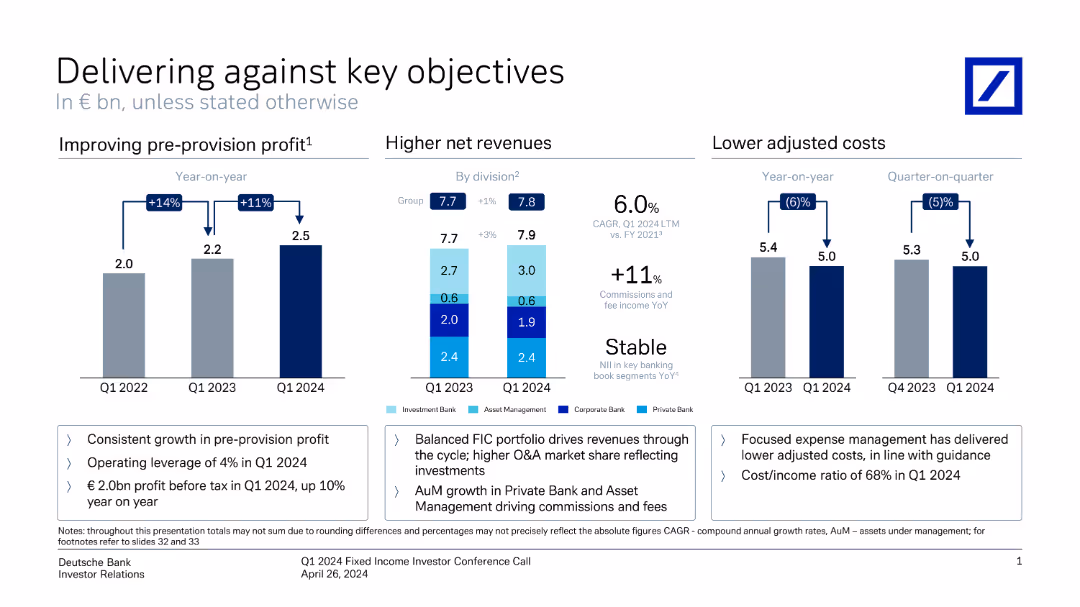
This slide contains three vertical column charts comparing pre-provision profit, net revenues, and adjusted costs over different periods. Annotations provide key metrics.
Financial Performance
Financial Services
It shows Deutsche Bank's performance metrics, highlighting improvements in profit, revenue, and cost management from Q1 2022 to Q1 2024.
profit, revenue, costs, financial performance, metrics, comparison, Deutsche Bank, investor relations, growth, Q1 2024
Multiple Chart
Deutsche Bank
Saved
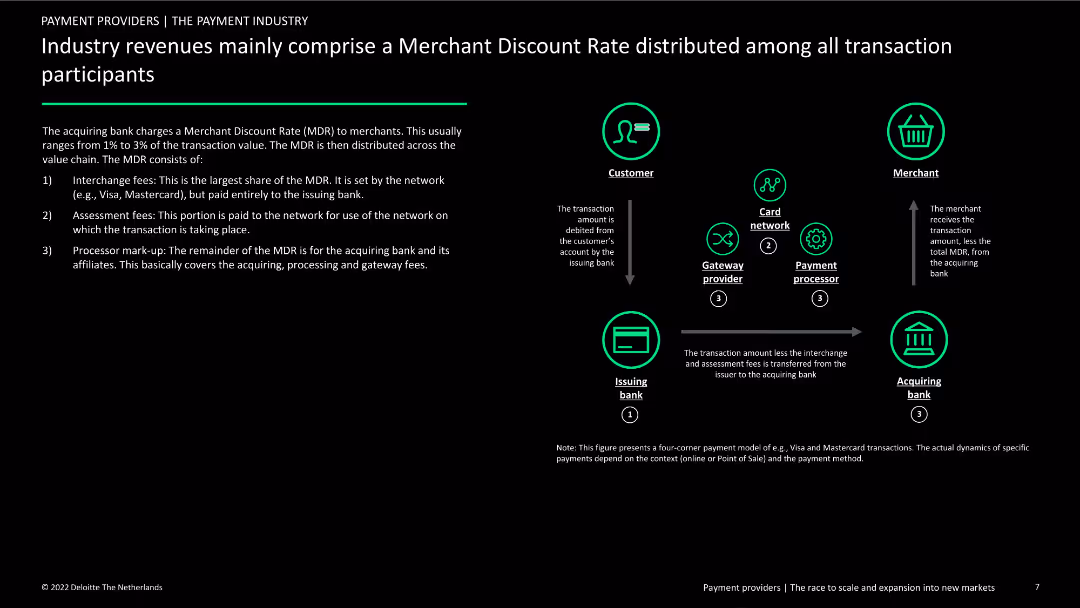
The slide describes the components of the Merchant Discount Rate (MDR) with a flow diagram showing how MDR is distributed among participants. Text details the breakdown of fees and the roles of different entities in the payment process.
Financial Performance
Financial Services
This slide provides an overview of the Merchant Discount Rate (MDR) in the payment industry, explaining how fees are distributed among banks, networks, and processors, and highlighting the financial implications for merchants and other stakeholders.
MDR, payment industry, fees, revenue distribution, roles
Diagram
Deloitte
Saved
This slide features a dominant title with bullet points below explaining the trend. There's a flow diagram on the right illustrating the software development life cycle. The design is clean with a balance between text and visuals, using blue highlights to emphasize key areas.
Market Analysis and Trends
Technology & Software
The slide explains next-generation software development tools and processes, emphasizing the software life cycle stages affected by these advancements. It seems to be a detailed breakdown designed for viewers with some background in the field, highlighting the impact of AI in software development.
Software Development, Tools, AI, Life Cycle, Trends, Analysis, Process Improvement
Header Vertical
McKinsey
Saved
Two pie charts comparing the next vehicle type preferences among current new and used vehicle owners. Charts are in teal and gray with labeled percentages. Simple, clear layout.
Market Analysis and Trends
Transportation & Logistics
This slide illustrates consumer preferences for vehicle type in future purchases based on their current vehicle's status (new or used). It highlights a stronger preference for new vehicles among current new vehicle owners.
Consumer behavior, vehicle preferences, new vs used, market analysis, purchasing intentions
Multiple Chart
Deloitte
Saved
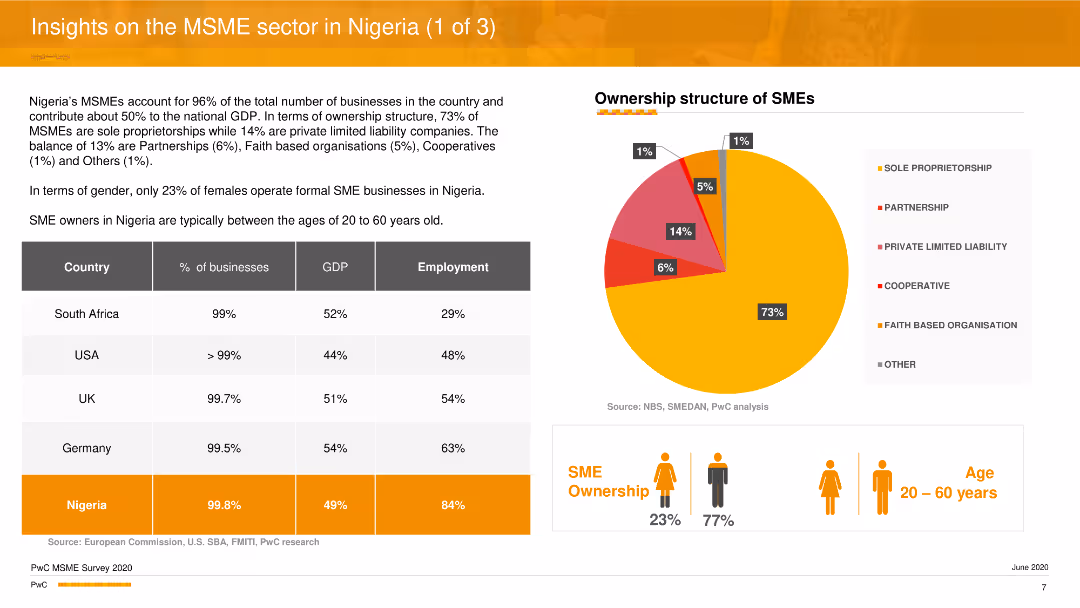
The slide features a pie chart showing the ownership structure of MSMEs in Nigeria, and a comparative table listing statistics on MSMEs in Nigeria versus other countries. Additional icons and text summarize key insights about gender distribution and age demographics of SME owners.
Industry Overview
Professional Services
The slide provides an overview of the MSME sector in Nigeria, highlighting the ownership structure, gender distribution, and age demographics of SME owners. It compares Nigerian MSMEs with those in other countries and discusses their contribution to the economy in terms of GDP and employment.
MSME sector, Nigeria, ownership structure, gender distribution, economic contribution
Mixed Chart
PwC/Strategy&
Saved
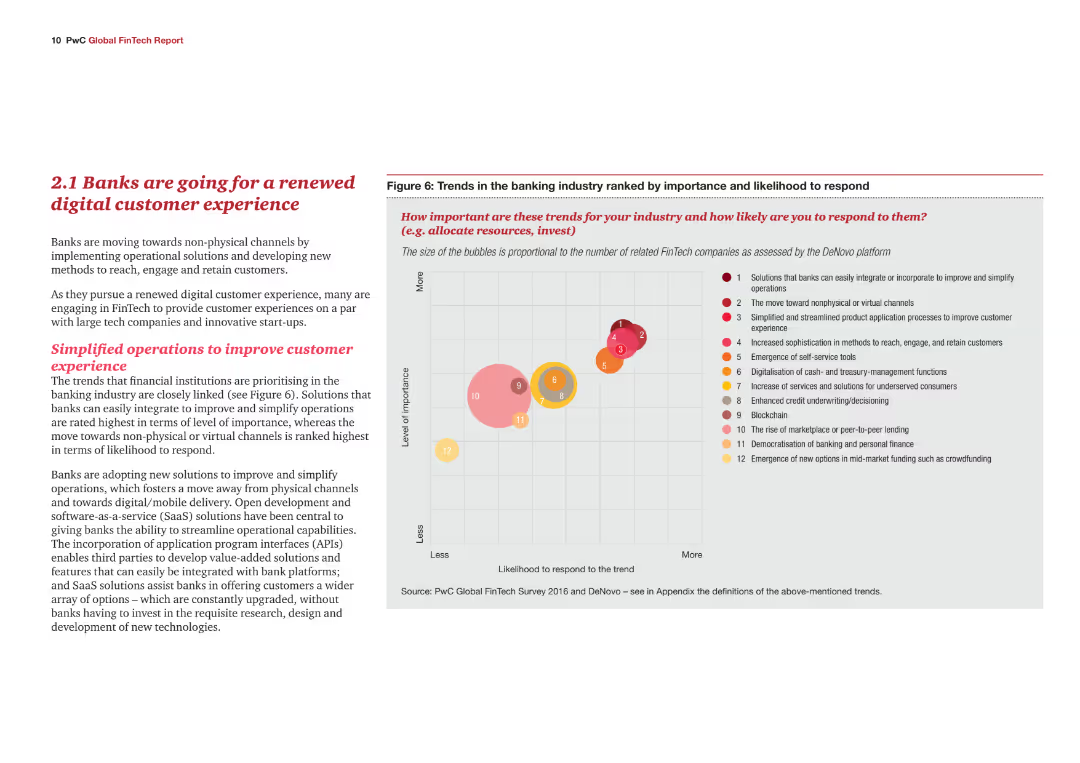
A content slide with text explaining the trends in the banking industry towards digital customer experiences. Includes a bubble chart ranking various trends in terms of importance and likelihood to respond.
Market Analysis and Trends
Financial Services
This slide highlights the shift in the banking industry towards enhancing digital customer experiences. It identifies key trends and their importance, supported by a bubble chart that ranks these trends based on their perceived significance and likelihood of adoption.
Banking, digital customer experience, trends, importance, likelihood to respond, bubble chart
Mixed Chart
PwC/Strategy&
Saved
Features three circular icons representing the food industry, consumers, and government, each linked to a key focus area. The design is clean with a blue color scheme.
Strategic Planning
Environmental Services & Sustainability
Discusses the need for a radical transformation in the food system, emphasizing the roles of various stakeholders including the food industry, consumers, and government in achieving sustainable practices.
food industry, sustainability, stakeholders, transformation
Pillar
Deloitte
Saved
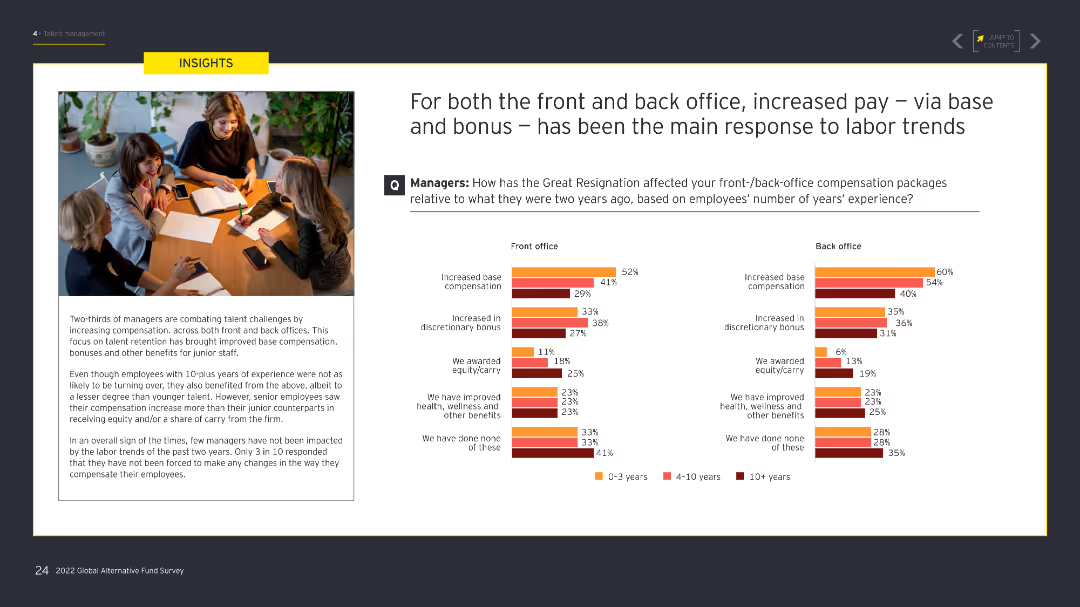
The slide features two column charts comparing the impact of the Great Resignation on front and back office compensation packages. An image on the left shows professionals in a casual meeting. The charts use different shades of orange and red to display data.
Human Resources and Talent Management
Financial Services
The slide outlines how managers have increased base compensation and discretionary bonuses to address labor challenges for both front and back offices, focusing on improving compensation to retain staff.
Compensation, labor trends, Great Resignation, front office, back office
Multiple Chart
EY
Saved
Detailed roadmap timeline outlining key milestones from Q4 2020 to the end of 2021 for vaccine distribution under various scenarios.
Regulatory and Compliance
Healthcare & Pharmaceuticals
Analyzes the projected timeline for widespread COVID-19 vaccine distribution in the U.S., including pre-conditions and milestones.
distribution, vaccine, timeline, COVID-19
Mixed Chart
BCG
Saved
Bar chart listing additional services consumers plan to acquire with their next vehicle, including insurance and roadside assistance. Simple and clean presentation.
Product and Service Analysis
Transportation & Logistics
This slide outlines the most common additional services that vehicle consumers intend to purchase or subscribe to, highlighting the high demand for vehicle insurance and roadside assistance.
Additional services, consumer planning, vehicle insurance, roadside assistance
Single Chart
Deloitte
Saved
This slide lists key technological advancements in space technology with corresponding images and descriptions.
Technology and Digital Transformation
Technology & Software
Discusses advancements in satellite technology, modular assembly, and the architectural shift towards LEO constellations.
satellite technology, LEO constellations, SWaP, assembly industrialization
Header Horizontal
McKinsey
Saved
The slide is populated with multiple bar charts detailing different business outcomes achieved through AI, colored in shades of blue to differentiate levels of achievement. The layout is straightforward and focuses on presenting the outcome data clearly.
Technology and Digital Transformation
Technology & Software
Reviews business outcomes from AI initiatives, with a focus on revenue generation and market expansion. Useful for evaluating the effectiveness of AI strategies and planning future business models in tech-driven industries.
AI outcomes, revenue generation, business models, effectiveness evaluation, tech-driven industries, market expansion
Multiple Chart
Deloitte
Saved
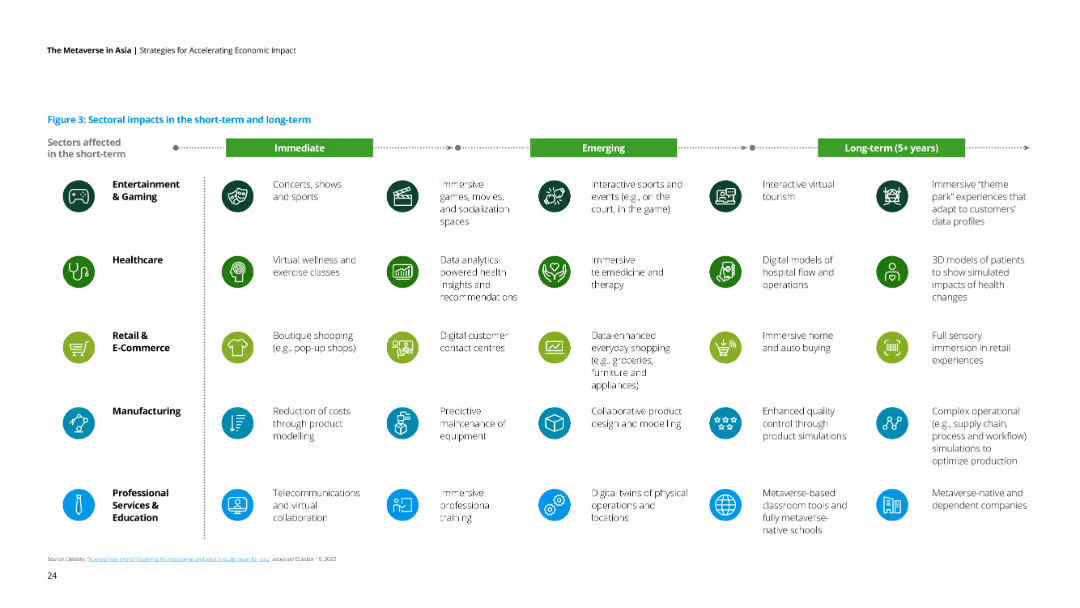
A table with icons and text divided into immediate, emerging, and long-term impacts across various sectors like gaming, healthcare, and e-commerce.
Market Analysis and Trends
Technology & Software
The slide outlines the short-term, emerging, and long-term impacts of the metaverse across multiple sectors.
metaverse, sector impacts, short-term, long-term, emerging trends
Table
Deloitte
Saved
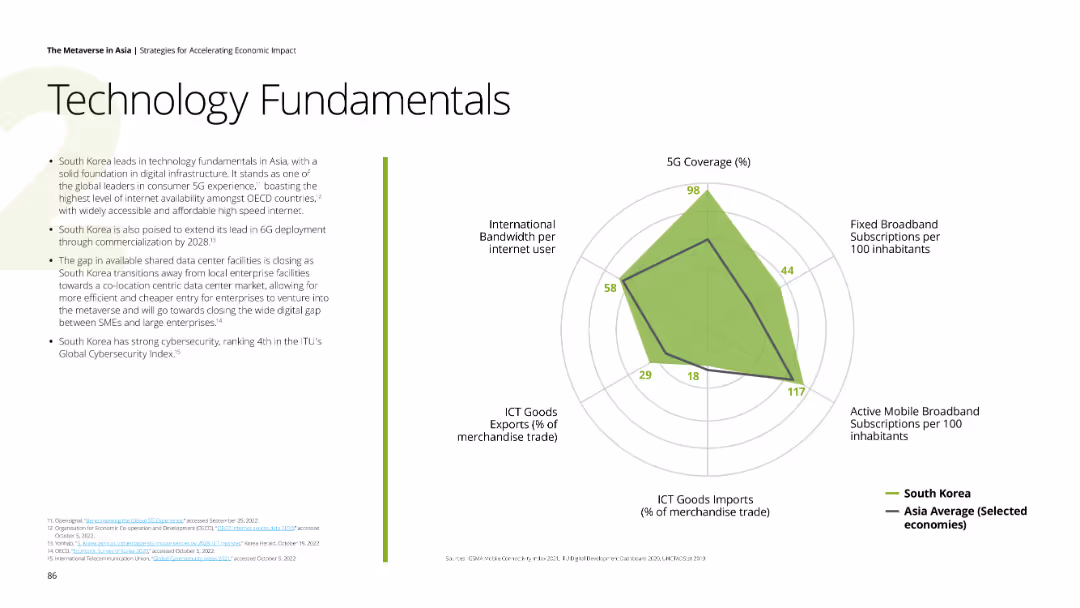
The slide features a radar chart comparing South Korea’s tech metrics against the Asia average. Textual information on the left discusses South Korea’s leadership in digital infrastructure and cybersecurity.
Technology and Digital Transformation
Telecommunications
Describes South Korea’s advancements in technology, 5G coverage, and cybersecurity, with a focus on future developments like 6G and shared data centers.
5G, cybersecurity, digital infrastructure, South Korea, 6G
Mixed Chart
Deloitte
Saved
A column chart comparing the approximate values lost by users during incidents such as hacking, fraud, or scams in 2023 and 2022.
Risk Assessment and Management
Financial Services
This slide displays the reported financial losses during incidents involving hacking or fraud on crypto trading platforms, comparing 2023 and 2022.
Value, loss, incident, hacking, fraud, 2023, 2022
Mixed Chart
IPSOS
Saved
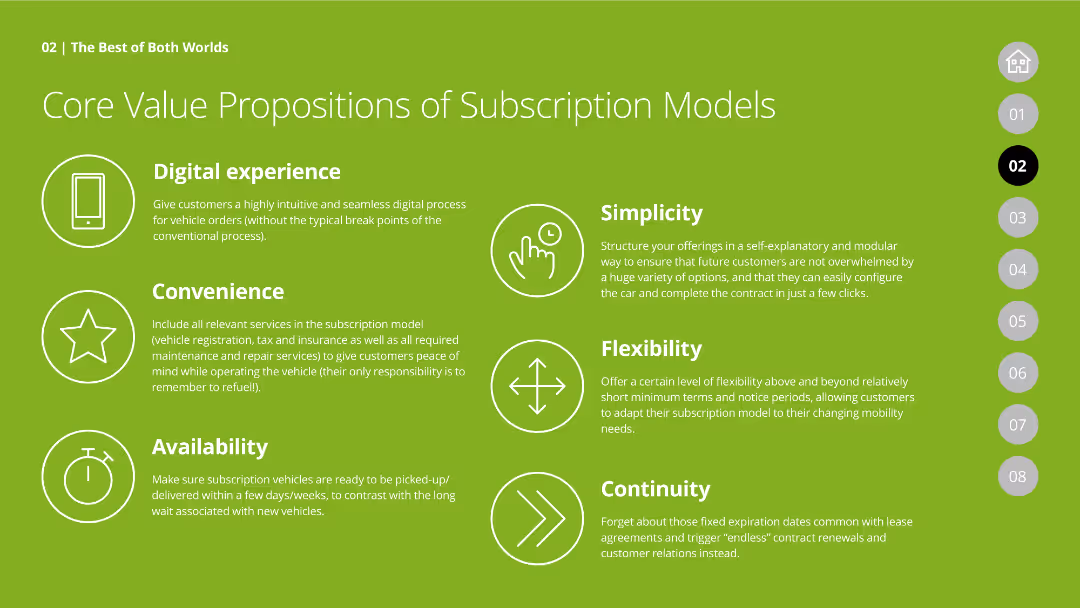
The slide lists core value propositions of subscription models with icons and descriptions for digital experience, convenience, simplicity, flexibility, availability, and continuity, presented on a green background.
Product and Service Analysis
Transportation & Logistics
Outlines the core benefits of subscription models for vehicles, emphasizing aspects like digital experience, convenience, and flexibility to appeal to consumers' changing preferences.
subscription models, core value propositions, digital experience, convenience, flexibility, vehicle subscription
Header Vertical
Deloitte
Saved
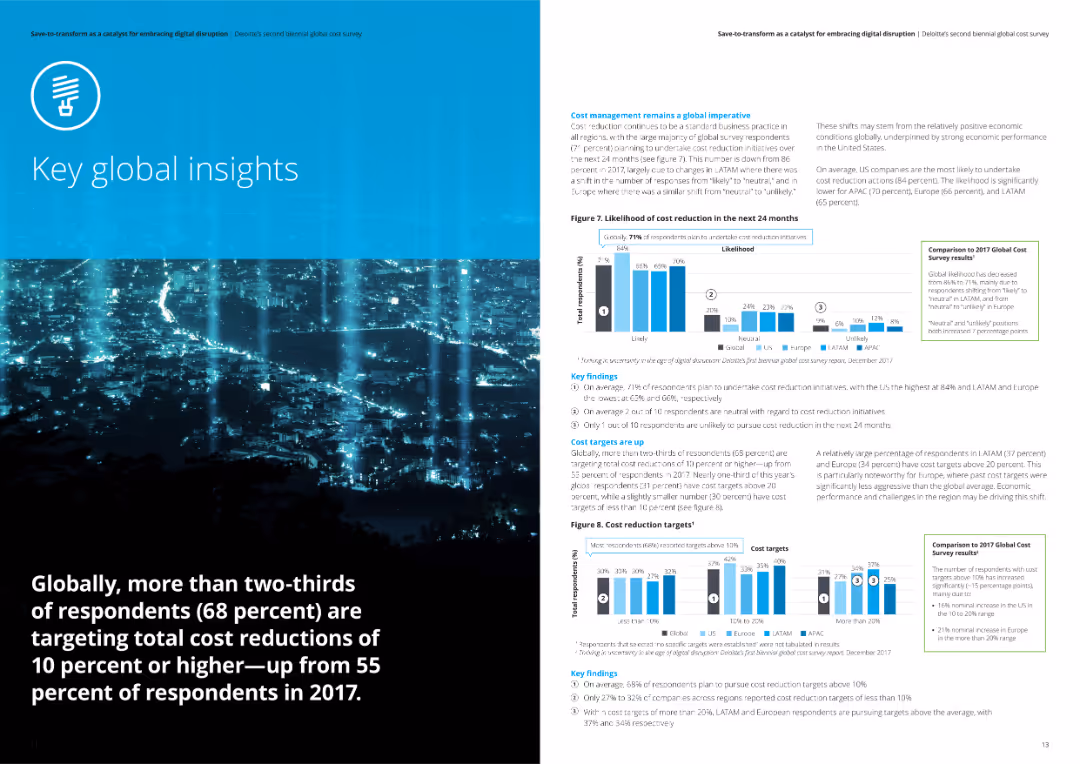
The slide includes a column chart and multiple pie charts analyzing the success rates of respondents in meeting cost reduction targets. It shows different levels of success across regions with key findings summarized on the right.
Performance Metrics and KPIs
Professional Services
This slide evaluates the success rates of meeting cost reduction targets from Deloitte's survey. It includes comparative data across regions and highlights key findings on the failure rates and levels of success in achieving cost savings.
cost targets, success rates, Deloitte, survey, cost reduction
Multiple Chart
Deloitte
Saved
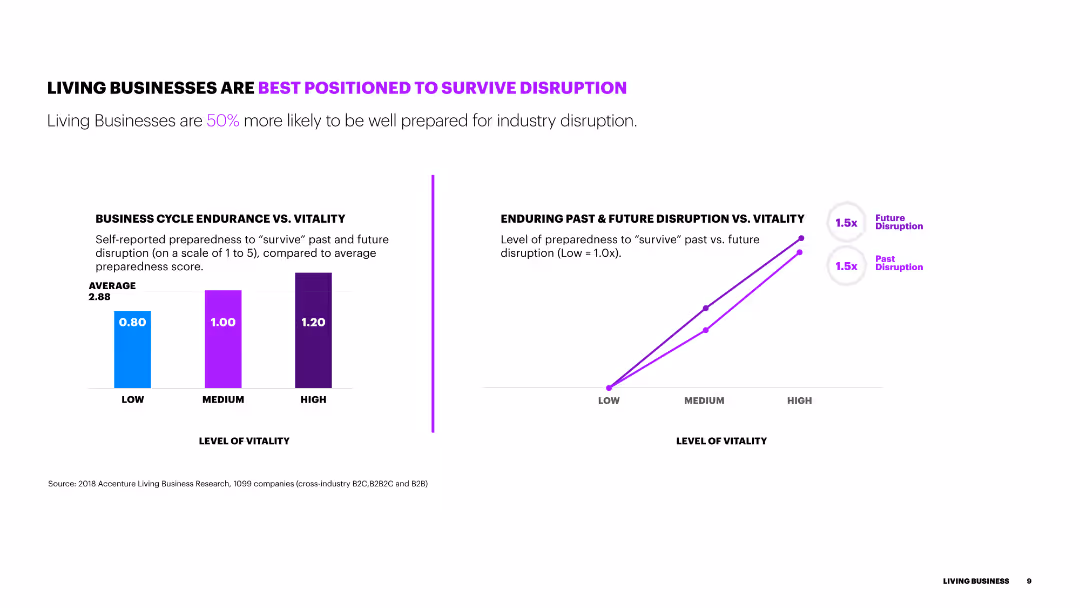
The slide includes two column charts showing the level of vitality and preparedness to survive disruption. It also features a line chart comparing past and future disruption preparedness levels.
Risk Assessment and Management
Financial Services
This slide shows how living businesses are better prepared for industry disruption, with visual data on their vitality levels and preparedness compared to average businesses.
disruption, vitality, preparedness, comparison, data, survival
Multiple Chart
Accenture
Saved
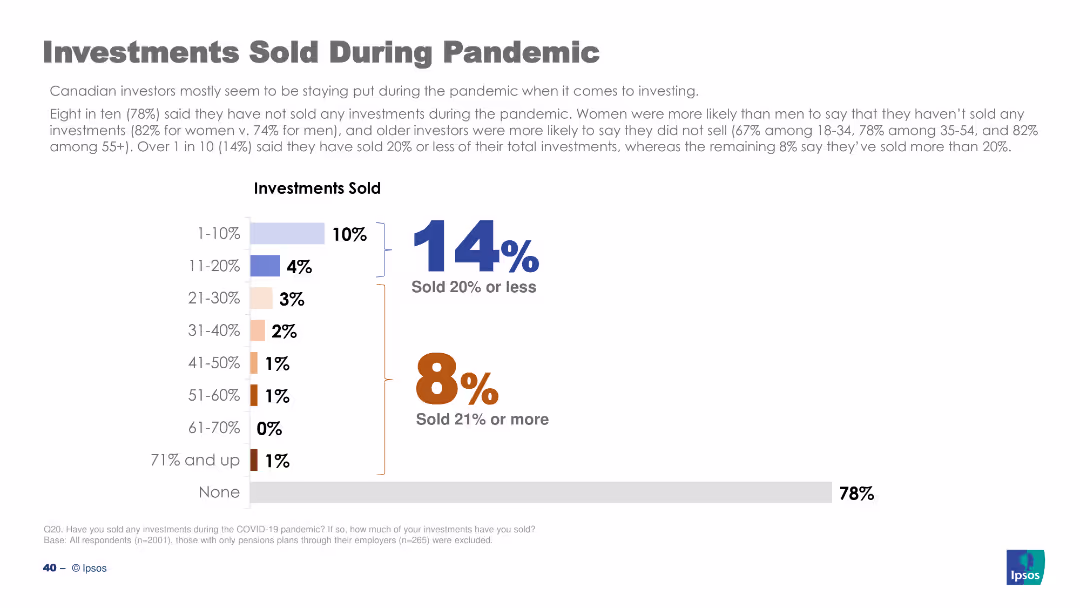
The slide features a column chart showing percentages of investments sold during the pandemic, with text describing the data. Clean white background.
Market Analysis and Trends
Financial Services
This slide presents data on the percentage of investments sold by Canadian investors during the pandemic, highlighting that most investors did not sell their investments.
investments sold, pandemic, Canadian investors, data analysis, COVID-19
Mixed Chart
IPSOS
Saved
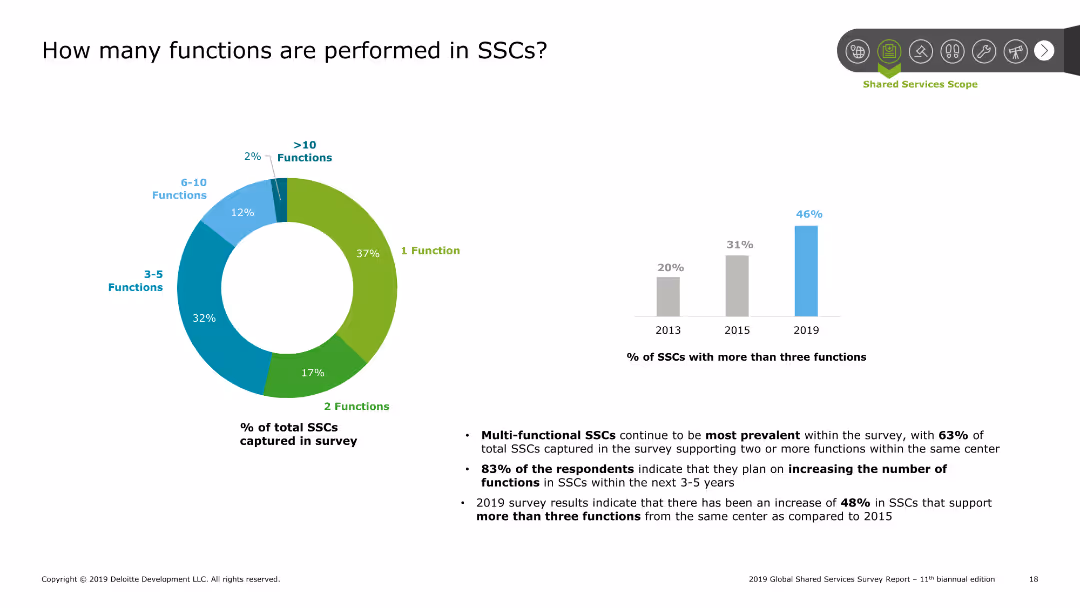
A doughnut chart showing the distribution of functions performed in SSCs. Additional bar chart on the right showing the percentage of SSCs with more than three functions over time.
Performance Metrics and KPIs
Professional Services
The slide details the number of functions performed in SSCs with a doughnut chart showing the distribution. Majority perform 1-2 functions. A bar chart indicates the growth in SSCs with more than three functions over recent years, highlighting an increase in multi-functional SSCs.
SSC, functions, distribution, multi-functional, growth
Multiple Chart
Deloitte
Saved
A bar graph depicting the global top ten vehicles sold between 2010-2019 with a side image of the F-Series.
Client Case Studies
Transportation & Logistics
Asserts the F-Series as the top-selling pickup globally over the past ten years.
F-Series, best-selling, pickup truck, global market
Single Chart
BCG
Saved
A column chart showcases commercial work done in Australia from FY07 to FY25 with actual data and projections. The chart includes annotations and a legend explaining scenario colors.
Market Analysis and Trends
Real Estate & Construction
Analyzes the growth trends in the Australian commercial sector, projecting future activities and the influence of economic changes on market conditions.
commercial, Australia, growth trends, projections, economic changes
Mixed Chart
Deloitte
Saved
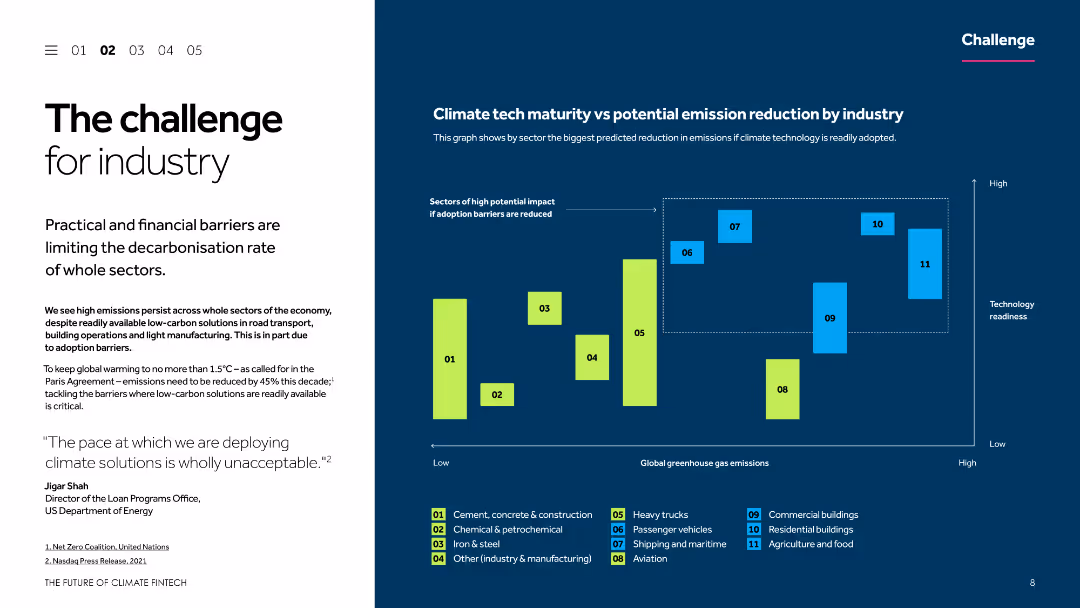
This slide uses a two-column layout with a text section on the left and a column chart on the right. The text describes the challenges faced by industries in decarbonization, while the chart illustrates the potential emission reduction by industry and technology readiness.
Risk Assessment and Management
Environmental Services & Sustainability
The slide discusses the practical and financial barriers limiting the decarbonization rate of various sectors. It includes a comparison of climate tech maturity versus potential emission reduction across different industries, emphasizing the need for overcoming adoption barriers.
Decarbonization, climate tech, emission reduction, industry challenges, technology readiness
Mixed Chart
Barclays
Saved
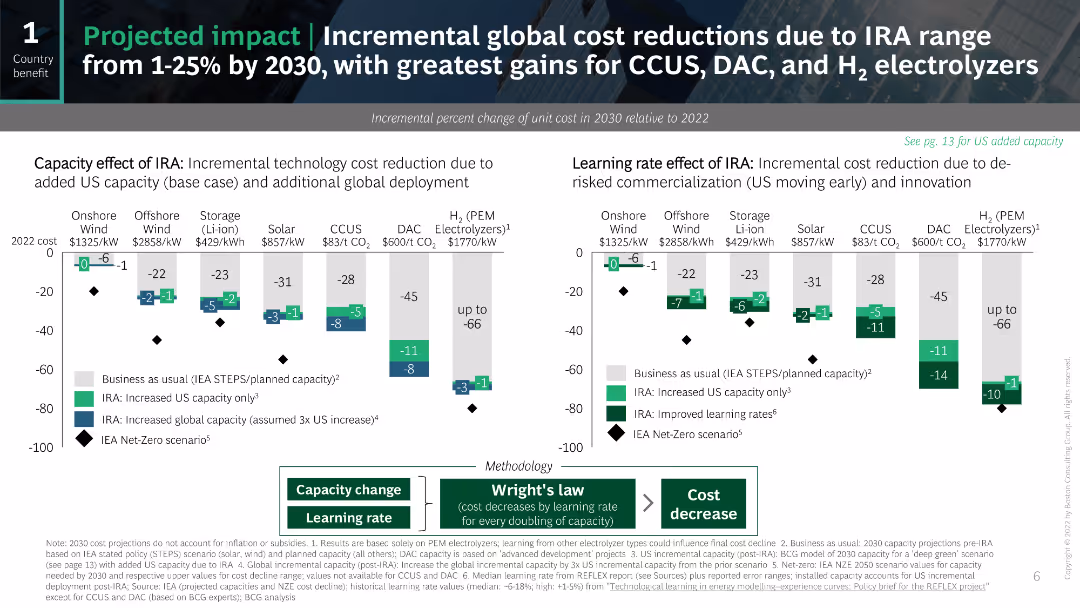
The slide features a series of column charts to show the incremental cost reductions and learning rate effects due to the IRA.
Market Analysis and Trends
Energy & Utilities
The slide projects cost reductions for various technologies due to the IRA and explains the methodology behind these projections.
IRA, cost reductions, projections, learning rate, technology
Multiple Chart
BCG
Saved
Previous
Next
If nothing, comes up, please save your slides first
Create a FREE account to continue browsing
Receive Instant Access to 1,000+ slides from companies like McKinsey, Google, and Goldman Sachs
First Name
Last Name
Email
Password
I agree to all
Terms & Privacy Policy
Thank you! Your submission has been received!
Oops! Something went wrong while submitting the form.
Have an account?
Sign in
Column Chart
Heatmap
Chevron
Org Chart
Infographic
Callouts
Timeline
List
Graphic
Picture
Process Flow
Diagram
Paragraph
Map
Table
Framework
Subtitle
Takeaway Box
Icon
Other Chart
Radar Chart
Waterfall Chart
Mekko Chart
Pie Chart
Scatter Plot
Line Chart
Bar chart
Bullet points