My Account
My Slides
Search by Category
Templates
Leave Feedback
Login
Logout
Get Started
Browse all Slides
Browse all Slides
Create a FREE Account
Instant access to 1,000+ real slides from top companies like McKinsey, BCG, Goldman Sachs, Google and many more!
First Name
Last Name
Email
Password
I agree to all
Terms & Privacy Policy
Thank you! Your submission has been received!
Oops! Something went wrong while submitting the form.
Have an account?
Sign in
Saved Slides
Infographic with forecasted US hydrogen demand across various sectors, accompanied by a description of hydrogen types and their applications in the power sector.
Market Analysis and Trends
Energy & Utilities
The slide discusses the forecasted demand for hydrogen in the US, breaking down usage by sector and explaining different types of hydrogen and their power sector applications.
Hydrogen, Demand forecast, Economy, Power sector, Applications
Mixed Chart
Roland Berger
Saved
The slide divides into four key strategy areas, each with corresponding icons and bulleted lists. The color scheme is consistent with the firm's branding.
Technology and Digital Transformation
Technology & Software
Discussing how technology strategy supports business priorities, this slide could be used for internal alignment and strategic communication.
technology strategy, business priorities, alignment, icons, digital transformation, JPMorgan
Pillar
JP Morgan
Saved
Features bulleted lists, bar graphs, and a mobile app interface highlighting physical and mental health strategies. The slide uses a mix of green and dark tones for visual separation.
Human Resources and Talent Management
Healthcare & Pharmaceuticals
Focuses on workplace safety and mental health management. It covers strategies like stress management, hygiene standards, and mental health training benefits, with a service provider example showing impact on stress and burnout rates.
Employee safety, Mental health, Stress management, Burnout, Hygiene
Header Vertical
BCG
Saved
Contains three charts: a line chart of LatAm y/y real GDP (2019 Q4 = 100) from 2015-2025F, a column chart of 2024F y/y real GDP, and a line chart of LatAm employment.
Market Analysis and Trends
Financial Services
Examines Latin America's economic performance in 2023 and provides forecasts for 2024, highlighting GDP, employment trends, and economic challenges.
Latin America, GDP, Employment, 2024, Trends
Multiple Chart
EY
Saved
A text-centric slide, it lists competitive advantages and guiding principles with minimal graphical elements.
Strategic Planning
Financial Services
The slide highlights the unique market position and strategic principles of a financial institution, aiming to convey its competitive edge and operational philosophy to stakeholders and potential partners.
differentiation, strategy, principles, competitive advantage, technology
Table
Goldman Sachs
Saved
Contains a large pie chart and three smaller ones, showing percentages of people aware of Generative AI, with demographic breakdowns (gender, income, age). Text blocks provide contextual data.
Industry Overview
Technology & Software
This slide presents data on consumer awareness of Generative AI, highlighting demographic disparities in familiarity with such technologies.
Generative AI, consumer awareness, demographic analysis, technology trends, market research
Multiple Chart
Deloitte
Saved
Image of a tree cross-section, with text discussing how organizations are redefining their purpose beyond profit.
Market Analysis and Trends
Professional Services
Explores how brands are shifting focus towards purpose-driven strategies, with insights from the Edelman Trust Barometer.
marketing, purpose, trends, strategy, organizations, branding, Edelman
Mixed Chart
Deloitte
Saved
The slide features percentage statistics in a column chart format with explanatory text beside each chart. Color coding is used to differentiate between the likelihood of increasing or maintaining usage.
Strategic Planning
Technology & Software
Focuses on the technological readiness of digital merchants in the Philippines and their anticipated adoption of digital platforms and financial services in the future.
Digital platforms, Financial services, Technological adoption, Future trends
Multiple Chart
Bain
Saved
The slide features a scatter plot comparing levelized cost of mobility (LCOM) and range for various car models, including FCEV and BEV.
Financial Performance
Energy & Utilities
The slide highlights the comparison of hydrogen cars and battery electric vehicles in terms of range and levelized cost of mobility, noting the higher TCO for mid-end BEVs.
LCOM, FCEV, BEV, range, TCO, comparison
Single Chart
Kearney
Saved
Displays a pie chart of sales distribution by product type, along with multiple product images with associated pricing, categorized into 'Base', 'Value up', and 'Premiumization'.
Product and Service Analysis
Consumer Goods
Provides a comparative analysis of Nestlé's product offerings by price segmentation, illustrating potential areas for value enhancement and premium product strategies. Ideal for discussing pricing strategies and market differentiation.
product analysis, pricing strategy, sales distribution, premium products, market differentiation
Mixed Chart
Deutsche Bank
Saved
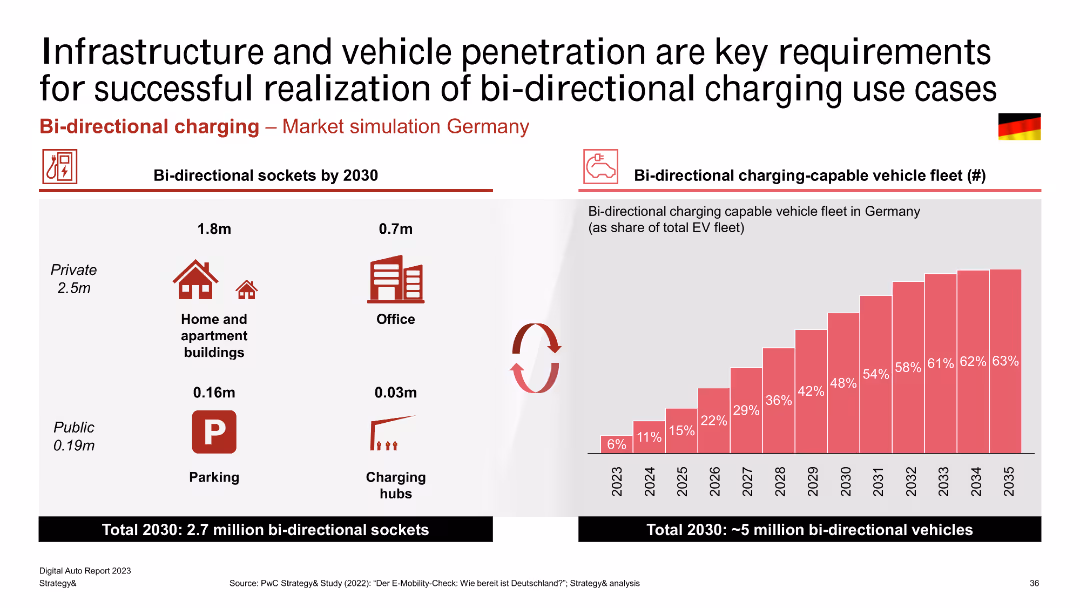
This slide presents a combination of infographics and column charts, highlighting projections for bi-directional sockets and vehicle fleet penetration in Germany by 2030. It includes icons and percentage bars.
Market Analysis and Trends
Energy & Utilities
The slide projects the number of bi-directional sockets and bi-directional charging-capable vehicles in Germany by 2030. It highlights the significant growth expected in private, office, and public charging hubs, emphasizing the infrastructure needed for this transition.
Bi-directional Charging, Infrastructure, Vehicle Penetration, Germany, Market Simulation, Charging Hubs, Projection
Mixed Chart
PwC/Strategy&
Saved
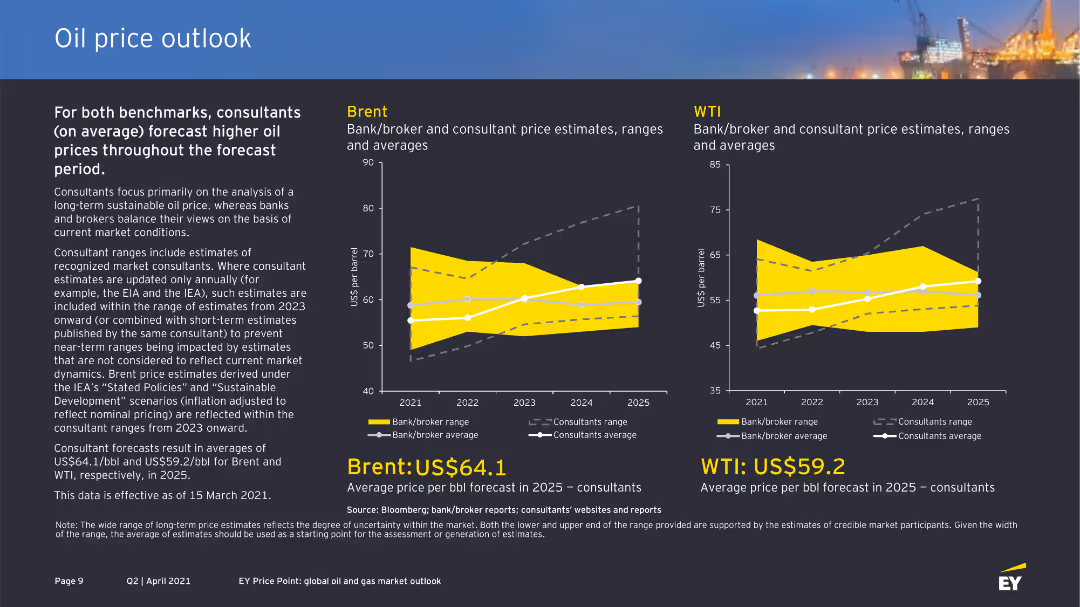
The slide presents two column charts comparing bank/broker and consultant price estimates for Brent and WTI oil prices from 2021 to 2025. The layout is clear with highlighted price forecasts and ranges.
Market Analysis and Trends
Energy & Utilities
This slide provides a comparison of Brent and WTI oil price forecasts by banks, brokers, and consultants, highlighting higher price expectations over the forecast period. It includes detailed estimates and influencing factors.
oil price, Brent, WTI, forecast, consultants, banks
Multiple Chart
EY
Saved
The slide features multiple column charts comparing China's recovery rates in various sectors to global rates. It includes categories like consumer products, fashion, energy, and travel. Background images correspond to each category.
Market Analysis and Trends
Financial Services
This slide shows China's recovery in various industries post-2021 compared to the world, focusing on sales growth and travel occupancy. Used for analyzing economic resilience and recovery trends.
China, recovery, consumer products, fashion, energy, tourism, sales growth, global comparison
Table
BCG
Saved
The slide features a large column chart on the left, a central section with color-coded contributing factors, and a final column chart on the right, providing a clear comparison of overhead ratios over time.
Operational Efficiency
Financial Services
Demonstrates the improvement in the overhead ratio at JPMorgan Chase & Co., driven by various factors, meant for showcasing efficiency gains to investors.
overhead ratio, efficiency, revenue growth, JPMorgan, investment, expense
Single Chart
JP Morgan
Saved
This slide contains a set of mini column charts and descriptive statistics detailing the performance of various regions in Asia, Europe, and the Americas.
Market Analysis and Trends
Consumer Goods
Discusses the luxury goods market performance in various regions, emphasizing Asia's growth and challenges in Europe and America due to socio-political issues.
Regional analysis, Asia, Europe, Americas
Mixed Chart
Bain
Saved
Title at the top with two bar charts below showing changes in consumer behavior, and quotes on the right side for emphasis.
Market Analysis and Trends
Retail & E-commerce
Reflects on how the pandemic has led consumers to reconsider their purchases with an emphasis on sustainability and ethics.
consumer habits, sustainability, ethical purchasing, waste reduction, pandemic impact, testimonials
Single Chart
Accenture
Saved
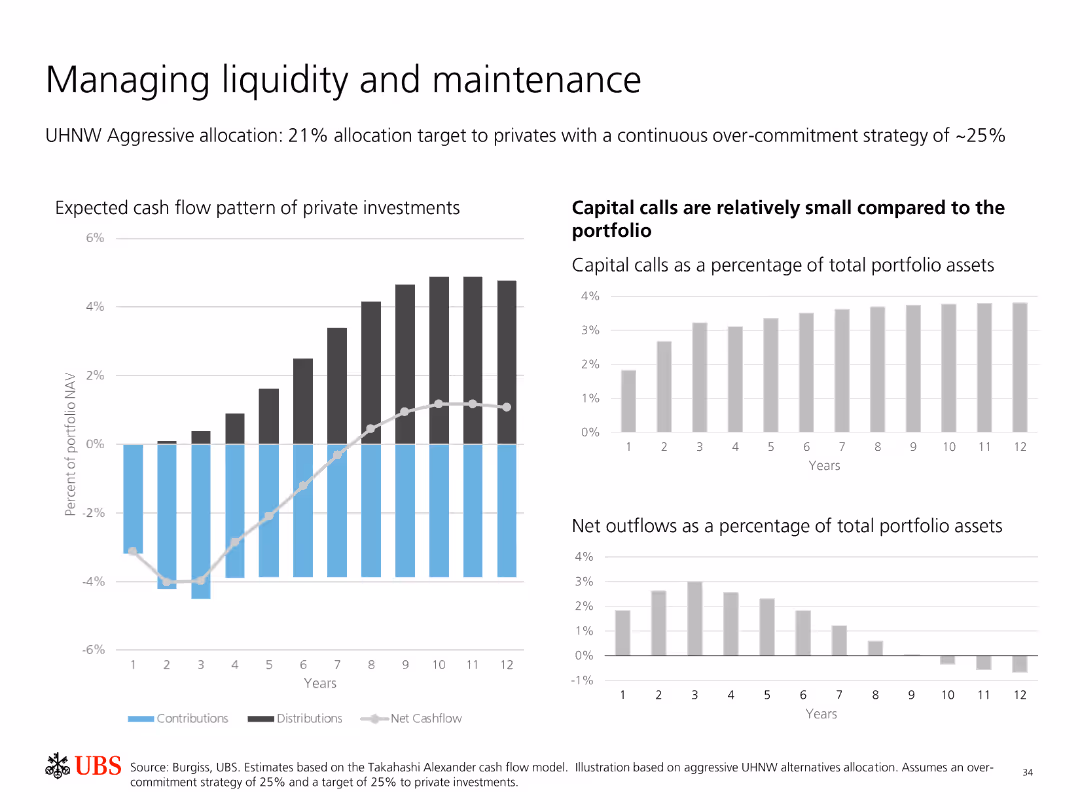
Contains multiple bar charts showing expected cash flow patterns of private investments, capital calls, and net outflows as a percentage of total portfolio assets.
Financial Performance
Financial Services
Analyzes liquidity management and maintenance in private investments, highlighting expected cash flows, capital calls, and net outflows relative to portfolio assets.
Liquidity Management, Private Investments, Cash Flow, Capital Calls, Net Outflows, Portfolio, Strategy, Analysis, Maintenance
Multiple Chart
UBS
Saved
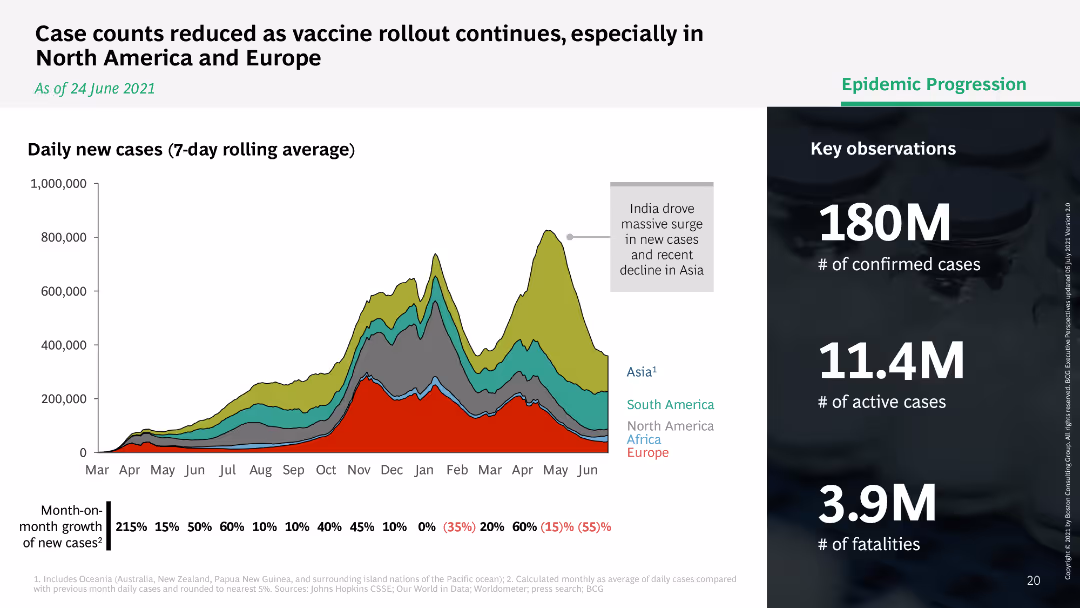
Line chart showing daily new COVID-19 cases by region with a legend indicating Asia, South America, North America, Africa, and Europe.
Market Analysis and Trends
Healthcare & Pharmaceuticals
Displays a 7-day rolling average of daily new COVID-19 cases by region, highlighting a decline in cases as vaccine rollout continues.
COVID-19, vaccine, cases, regions, decline
Mixed Chart
BCG
Saved
Shows a scatter plot diagrams and timelines illustrating the potential increase in emissions coverage with new tax credits.
Regulatory and Compliance
Environmental Services & Sustainability
Explores the impact of increased tax credits on emissions reductions across sectors, valuable for environmental policy making.
tax credits, emissions reductions, environmental policy, sustainability, sector analysis, climate change
Multiple Chart
BCG
Saved
This slide features multiple vertical bar (column) charts showing the S&P 500 sectors' current P/E ratios against 10-year highs, lows, and averages, with annotations for specific dates and a descriptive legend below. The layout is information-dense with a mix of vibrant colors for differentiation.
Financial Performance
Financial Services
The slide presents a comparative valuation analysis of S&P 500 sectors using current and historical P/E ratios, useful for financial analysts and investors.
S&P 500, valuation, P/E ratio, financial analysis, equity markets, historical comparison, investment, sector analysis
Single Chart
Morgan Stanley
Saved
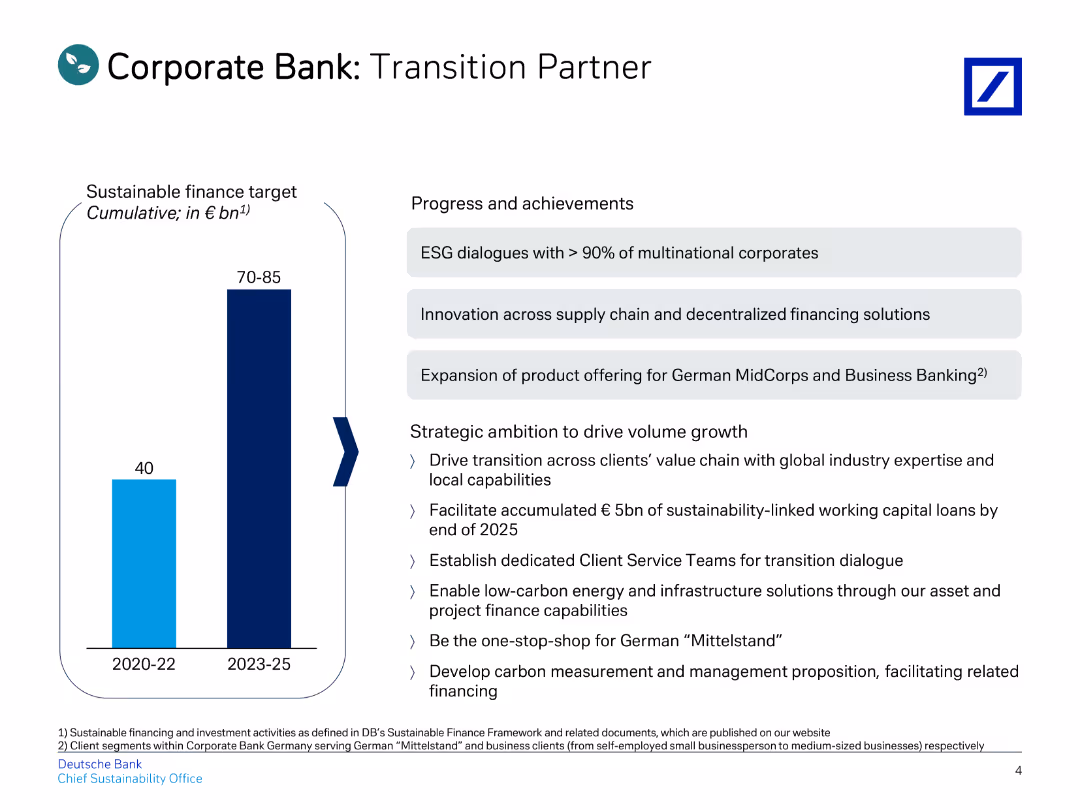
The slide includes a title, a vertical bar chart on the left, and a list of progress and achievements on the right.
Strategic Planning
Financial Services
Details the progress and achievements of the Corporate Bank, focusing on sustainable finance targets and strategic ambitions.
corporate, transition, sustainable, finance, strategy
Mixed Chart
Deutsche Bank
Saved
The slide is segmented into different sections with icons representing various end-markets, activities, and growth drivers. It provides insights into market growth prospects through 2022-2027 for different segments within the engineered fabrics and films industry.
Market Analysis and Trends
Industrial & Manufacturing
Analyzing the potential for market growth in various sectors related to engineered fabrics and films, this slide indicates where high-growth opportunities exist, guiding strategic planning for companies in these markets. It's tailored for executives and strategists focused on expanding their market reach.
market growth, end-markets, strategic planning, growth drivers
Table
Morgan Stanley
Saved
Contains stacked column charts for leverage exposure and risk-weighted assets, split into categories such as trading and lending.
Financial Performance
Financial Services
Analyzes the bank's exposure to different types of financial risk at the end of Q3 2023, presenting quantitative leverage and risk data. Used for evaluating financial stability.
leverage, risk, financial analysis, Q3 2023
Multiple Chart
Deutsche Bank
Saved
The slide features various bar graphs and pie charts detailing respondents' familiarity with different emerging technologies and their roles within organizations.
Technology and Digital Transformation
Technology & Software
The slide provides a profile of respondents' familiarity with emerging technologies, detailing the levels of familiarity, roles, and generations of respondents.
emerging tech, respondent profile, technology adoption, digital transformation, tech familiarity
Multiple Chart
EY
Saved
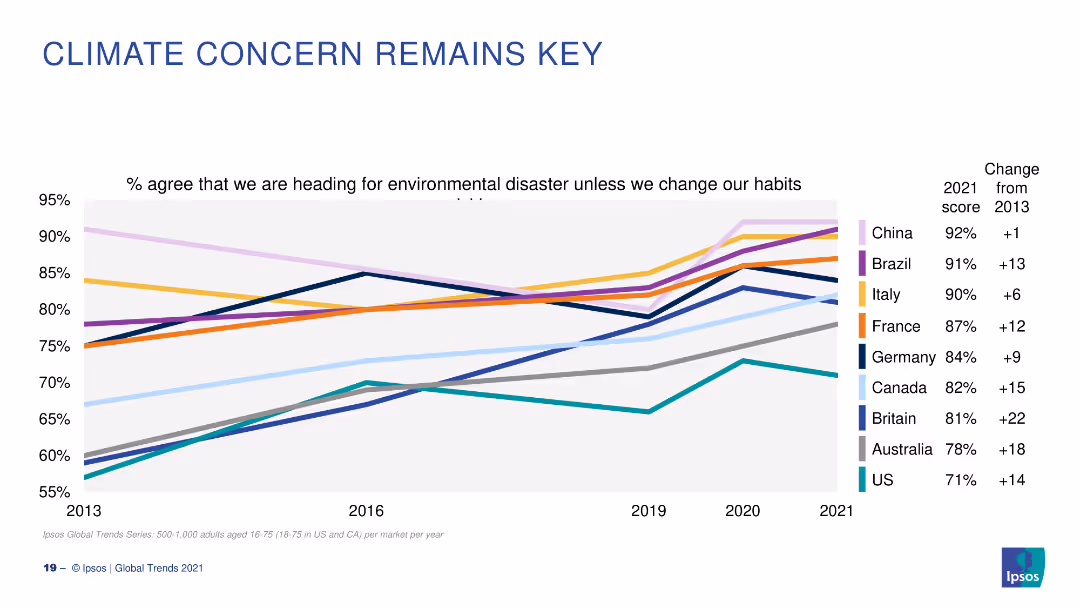
This slide features a line chart showing trends in climate concern over time across different countries. The lines are color-coded to distinguish between countries, with clear markers indicating significant changes.
Market Analysis and Trends
Environmental Services & Sustainability
The slide tracks the increasing concern about climate change from 2013 to 2021 in various countries, highlighting significant growth in awareness and urgency over the years. This can be used to analyze public sentiment trends, inform climate policy, and prioritize environmental actions.
climate concern, trend analysis, public sentiment, environmental awareness, global trends
Single Chart
IPSOS
Saved
Previous
Next
If nothing, comes up, please save your slides first
Create a FREE account to continue browsing
Receive Instant Access to 1,000+ slides from companies like McKinsey, Google, and Goldman Sachs
First Name
Last Name
Email
Password
I agree to all
Terms & Privacy Policy
Thank you! Your submission has been received!
Oops! Something went wrong while submitting the form.
Have an account?
Sign in
Column Chart
Heatmap
Chevron
Org Chart
Infographic
Callouts
Timeline
List
Graphic
Picture
Process Flow
Diagram
Paragraph
Map
Table
Framework
Subtitle
Takeaway Box
Icon
Other Chart
Radar Chart
Waterfall Chart
Mekko Chart
Pie Chart
Scatter Plot
Line Chart
Bar chart
Bullet points