My Account
My Slides
Search by Category
Templates
Leave Feedback
Login
Logout
Get Started
Browse all Slides
Browse all Slides
Create a FREE Account
Instant access to 1,000+ real slides from top companies like McKinsey, BCG, Goldman Sachs, Google and many more!
First Name
Last Name
Email
Password
I agree to all
Terms & Privacy Policy
Thank you! Your submission has been received!
Oops! Something went wrong while submitting the form.
Have an account?
Sign in
Saved Slides
The slide presents a column chart of CET1 capital and charts on risk-weighted assets and leverage ratio denominator.
Operational Efficiency
Financial Services
It illustrates significant reductions in financial resource consumption, showcasing CET1 capital and risk-weighted assets metrics.
financial resources, CET1 capital, risk-weighted assets, leverage, reductions
Multiple Chart
UBS
Saved
The slide presents a stacked column chart comparing expenses for two fiscal years, with annotations detailing contributing factors to changes in expenses.
Operational Efficiency
Financial Services
This slide analyzes expense growth, offering insights into cost management and areas where the company has invested or saved. It is useful for stakeholders interested in understanding the financial management and operational efficiency of the company.
expenses, fiscal year, cost management, operational efficiency
Single Chart
Citigroup
Saved
This slide contains three column charts comparing CET1 ratio, leverage ratio, and MREL/TLAC, each annotated with corresponding quarterly changes and numerical values. Detailed explanatory text and bullet points accompany the charts.
Financial Performance
Financial Services
This slide presents Q2 2023 financial metrics for Deutsche Bank, such as CET1 ratio, leverage ratio, and MREL/TLAC requirements, illustrating their changes over the quarter and factors affecting these metrics.
Financial metrics, CET1 ratio, leverage ratio, MREL, TLAC, quarterly comparison, Deutsche Bank
Multiple Chart
Deutsche Bank
Saved
Column chart with multiple categories showing where parents sought information for their child's social and emotional development, including books, professionals, and online sources.
Market Analysis and Trends
Healthcare & Pharmaceuticals
This slide presents survey data on where parents sought information for their child's social and emotional development, highlighting various sources and their popularity.
survey, child development, information sources, parents, data
Single Chart
IPSOS
Saved
This slide showcases comparative data through multiple donut charts, illustrating disparities in digital product ownership and service subscriptions between higher and lower income households.
Market Analysis and Trends
Technology & Software
Examines the digital divide by comparing access to technology and subscription services in different income brackets. Useful in discussions on socio-economic disparities and digital inclusion.
digital divide, income disparity, technology access, subscription services, socio-economic status, market analysis, consumer behavior, digital inclusion, accessibility, demographics
Multiple Chart
Deloitte
Saved
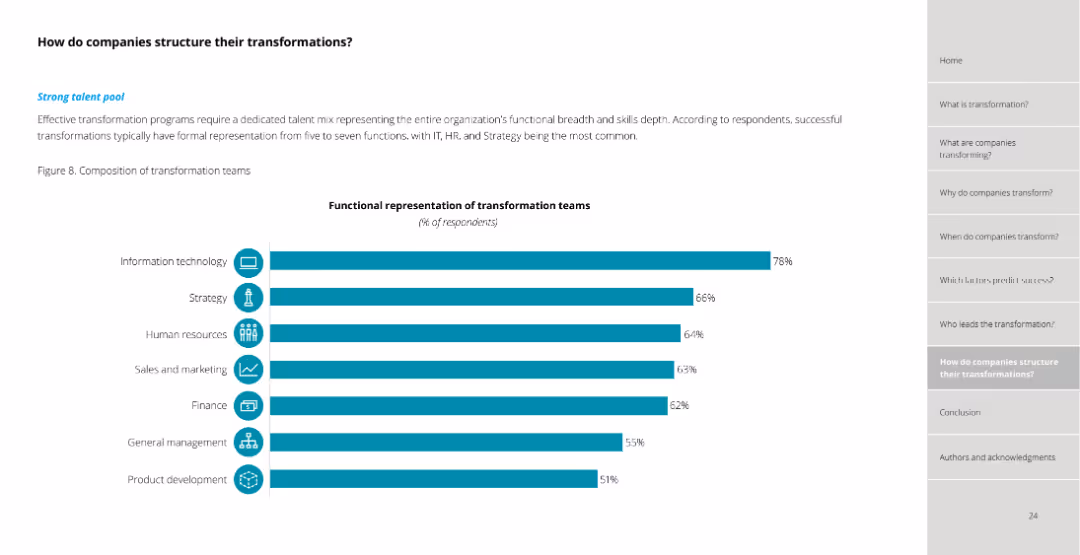
The slide includes a column chart showing the functional representation of transformation teams by percentage of respondents, listing roles like IT, Strategy, HR, Sales and Marketing, etc.
Organizational Structure and Change
Professional Services
Outlines how companies structure their transformation teams, highlighting the most common functional roles represented in successful transformation efforts based on survey data.
transformation teams, organizational structure, functional roles, survey data, transformation success
Single Chart
Deloitte
Saved
Column chart showing percentage agreement that mental health needs more attention, with countries sorted from highest to lowest agreement.
Customer and Market Segmentation
Healthcare & Pharmaceuticals
Highlights the importance of mental health globally, with Nigeria showing the highest agreement. Indicates the global trend toward prioritizing mental health along with physical health.
mental health, global, priority, survey, agreement
Multiple Chart
IPSOS
Saved
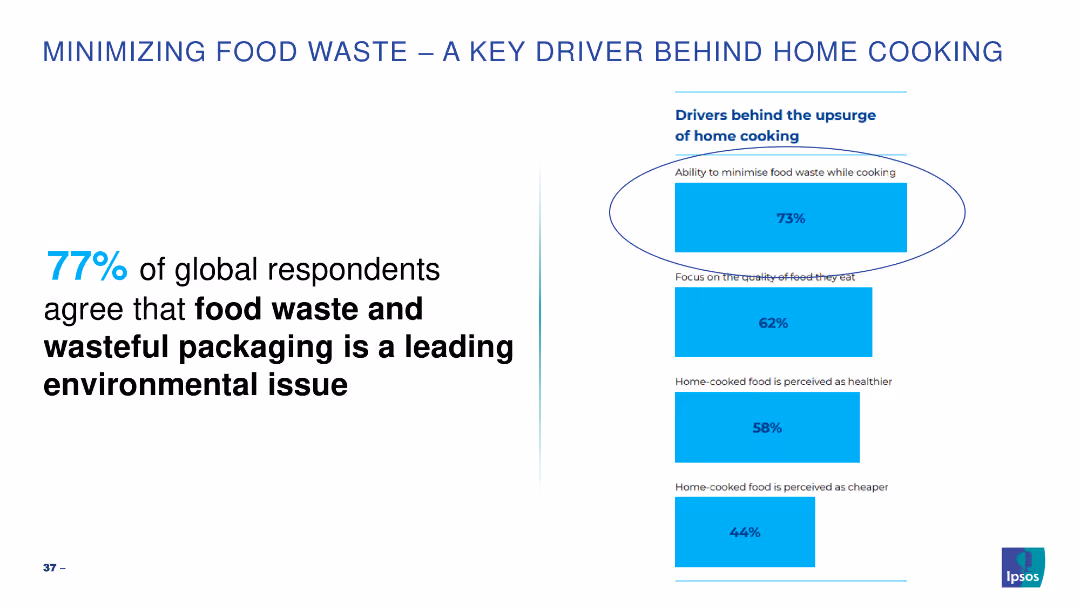
Simple bar chart highlighting key drivers for minimizing food waste while cooking.
Market Analysis and Trends
Environmental Services & Sustainability
Highlights the importance of minimizing food waste as a leading environmental issue.
food waste, cooking, environmental, global, drivers
Mixed Chart
IPSOS
Saved
Features a column chart displaying percentages of brands in different maturity stages, using varying shades of green. The design is straightforward, highlighting key data points effectively.
Market Analysis and Trends
Media & Entertainment
Analyzes the digital marketing maturity of Asia Pacific brands, showing only 2% are at the 'Multi-moment' maturity stage. It provides insights into the distribution of digital marketing maturity among these brands, useful for benchmarking and strategic planning in marketing initiatives.
digital marketing, Asia Pacific, brand maturity, multi-moment, marketing analysis, strategic planning, benchmarking, maturity distribution, column chart
Single Chart
BCG
Saved
Column charts comparing financial ratios and targets over time. Simple and clean layout.
Financial Performance
Energy & Utilities
Analyzes the financial strength of the company, highlighting debt management and financial targets.
financial, strength, debt, targets, management
Mixed Chart
Barclays
Saved
This slide features three main metrics: revenue, total installed base, and future revenue projections. It includes pie charts for product lines, geographies, and revenue models with purple color themes.
Financial Performance
Healthcare & Pharmaceuticals
Details the financial metrics and projections for the Molecular Diagnostics Business Unit, including product line distribution, geographical reach, and projected revenue from new product launches.
Revenue, Projections, Product, Geography, Healthcare
Multiple Chart
JP Morgan
Saved
The slide features a line chart tracking gross margin trends over a fiscal year and detailed tables showing gross margin percentage and account balances.
Financial Performance
Financial Services
This slide presents an analysis of gross margin trends, highlighting discrepancies in August that deviate from expectations, which necessitates further investigation.
gross margin, trend analysis, financial performance, sales, cost of sales
Mixed Chart
EY
Saved
Diagram explaining a holistic approach to managing financial crime, using four icons linked by arrows to represent different areas of focus: anti-bribery, anti-money laundering, anti-tax evasion, and sanctions.
Regulatory and Compliance
Financial Services
The slide describes Barclays' integrated strategy for financial crime prevention, emphasizing the synergy between different compliance areas and highlighting the supporting global finance function.
compliance, financial crime, anti-bribery, AML
Diagram
Barclays
Saved
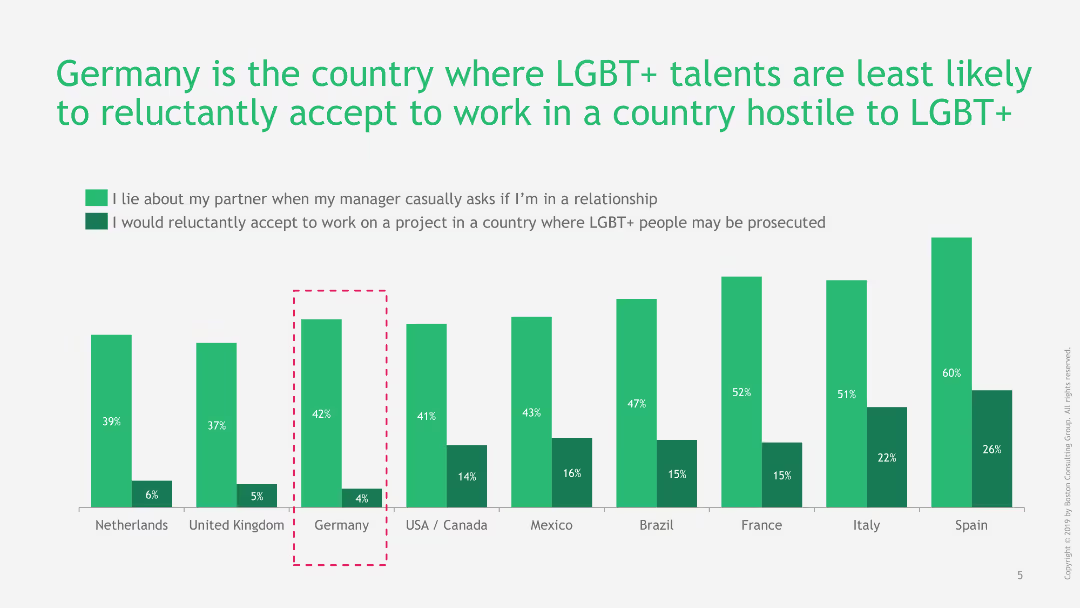
Column chart illustrating the willingness of LGBT+ talents to work in hostile countries and to lie about their partner. Green and dark green bars show different scenarios.
Regulatory and Compliance
Professional Services
The slide illustrates Germany's position where LGBT+ talents are least likely to accept work in hostile countries, and their tendency to lie about their partners when asked by managers.
LGBT+, Germany, workplace, hostile countries, diversity
Single Chart
BCG
Saved
Multiple bubble charts and graphs with annotations, a large header, and a footnotes section, against a purple background.
Product and Service Analysis
Technology & Software
Illustrates how online entertainment has become a significant leisure activity, especially post-COVID-19, with an increase in time spent on streaming and gaming.
online entertainment, COVID-19 impact, leisure activities, streaming, gaming, social media, user trends, time allocation
Multiple Chart
Accenture
Saved
The slide features a column chart displaying the percentage growth of urban agglomerations with the highest population growth from 2015-35. The chart differentiates between African and Asian cities. Below the chart are annotations and additional notes regarding urbanization trends in Africa.
Market Analysis and Trends
Technology & Software
This slide analyzes the fastest-growing cities in terms of population, comparing urban agglomerations in Africa and Asia. It highlights the impact of rapid urbanization on consumption expenditure in Africa, suggesting significant opportunities for economic growth in these regions.
urban growth, population, Africa, Asia, urbanization
Mixed Chart
LEK
Saved
Percentages and sector-specific icons representing various industries, discussing survey response distribution and focus areas.
Industry Overview
Professional Services
Provides an overview of industry responses to a global survey, focusing on shared services and sectoral breakdown.
shared services, survey, industry distribution, bar chart, operational efficiency
Pillar
Deloitte
Saved
Features a line graph charting the projected recovery of global luxury markets from 2010 to 2025, focusing on personal and experience-based goods. The slide includes future predictions with visual markers for expected recovery timelines.
Market Analysis and Trends
Consumer Goods
This slide forecasts the recovery trajectory of global luxury markets post-COVID-19, with a specific focus on the rebound of personal and experience-based luxury goods. It uses historical data to project future market recovery, providing a timeline and visual depiction of when various sectors might return to pre-pandemic levels.
recovery forecast, luxury markets, post-COVID, market projection, experience-based goods
Mixed Chart
Bain
Saved
The slide includes a donut chart showing investors' review of DEI composition among managers. On the left, there is an image of two professionals reviewing documents. The donut chart uses orange and red shades to indicate responses.
Human Resources and Talent Management
Financial Services
The slide emphasizes that while turnover and compensation have been short-term focuses, DEI remains a critical ongoing priority for investors, with many reviewing DEI composition to assess managers' effectiveness.
DEI, compensation, turnover, investor review, talent management
Mixed Chart
EY
Saved
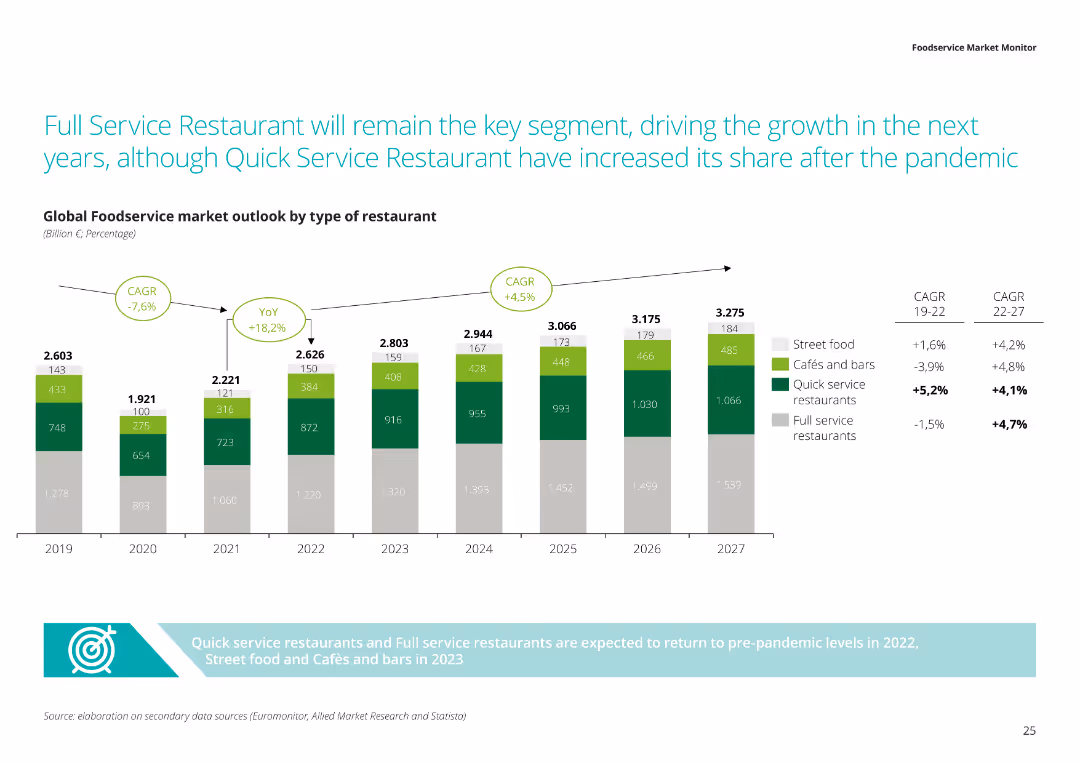
This slide contains a column chart illustrating the global foodservice market outlook by type of restaurant, including CAGR and YoY growth rates from 2019 to 2027.
Market Analysis and Trends
Hospitality & Tourism
It forecasts full-service restaurants leading growth in foodservice, despite quick service restaurants gaining share post-pandemic, with market sizes and growth rates by type.
Restaurant, Growth, Foodservice, Market Outlook, CAGR
Mixed Chart
Deloitte
Saved
Multiple line charts detailing the trade volume with Russia and the impact of geopolitical events.
Strategic Planning
Transportation & Logistics
Analyzes the shift in trade and corporate strategy in response to geopolitical tensions involving Russia.
Trade, Russia, Geopolitical, Strategy, Logistics, Transportation, Volume, Impact
Multiple Chart
PwC/Strategy&
Saved
The slide includes a horizontal bar chart showing the percentage of workforce with access to approved Generative AI tools. The bars are color-coded by levels of expertise, ranging from little to very high expertise.
Human Resources and Talent Management
Technology & Software
It examines the extent to which organizations are providing their workforce with access to approved Generative AI tools, highlighting disparities based on expertise levels and workforce penetration rates.
workforce, Generative AI, access, expertise, tools
Mixed Chart
Deloitte
Saved
Contains timelines and icons depicting hydrogen electrolysis capacity targets, infrastructure roadmaps, and targeted end-use sectors in a segmented layout.
Strategic Planning
Energy & Utilities
Discusses the Netherlands' hydrogen strategy focusing on developing infrastructure and scaling hydrogen use in various sectors by 2050, with specific targets for electrolysis capacity and transport applications.
Dutch, Hydrogen, Strategy, Infrastructure, Targets
Mixed Chart
McKinsey
Saved
The slide presents a structured layout with four sections, each containing logos of brands categorized under Professional products, Consumer products, L'Oréal Luxe, and Active cosmetics.
Market Analysis and Trends
Consumer Goods
This slide displays L'Oréal's diverse brand portfolio, segmented into various product categories with associated market share percentages, demonstrating the company's market positioning.
L'Oréal, brand portfolio, market share, consumer products, professional products
Table
Deutsche Bank
Saved
Includes two line graphs illustrating pre-tax income projections over a timeline, with legends and annotations.
Investment Analysis
Financial Services
Discusses future income estimates related to growth initiatives, aiming for a positive return on investment, suitable for investor relations or financial planning.
Growth Initiatives, Income Projections, Investment, ROI, Financial Planning, Trends, Analysis
Single Chart
Goldman Sachs
Saved
Previous
Next
If nothing, comes up, please save your slides first
Create a FREE account to continue browsing
Receive Instant Access to 1,000+ slides from companies like McKinsey, Google, and Goldman Sachs
First Name
Last Name
Email
Password
I agree to all
Terms & Privacy Policy
Thank you! Your submission has been received!
Oops! Something went wrong while submitting the form.
Have an account?
Sign in
Column Chart
Heatmap
Chevron
Org Chart
Infographic
Callouts
Timeline
List
Graphic
Picture
Process Flow
Diagram
Paragraph
Map
Table
Framework
Subtitle
Takeaway Box
Icon
Other Chart
Radar Chart
Waterfall Chart
Mekko Chart
Pie Chart
Scatter Plot
Line Chart
Bar chart
Bullet points