My Account
My Slides
Search by Category
Templates
Leave Feedback
Login
Logout
Get Started
Browse all Slides
Browse all Slides
Create a FREE Account
Instant access to 1,000+ real slides from top companies like McKinsey, BCG, Goldman Sachs, Google and many more!
First Name
Last Name
Email
Password
I agree to all
Terms & Privacy Policy
Thank you! Your submission has been received!
Oops! Something went wrong while submitting the form.
Have an account?
Sign in
Saved Slides
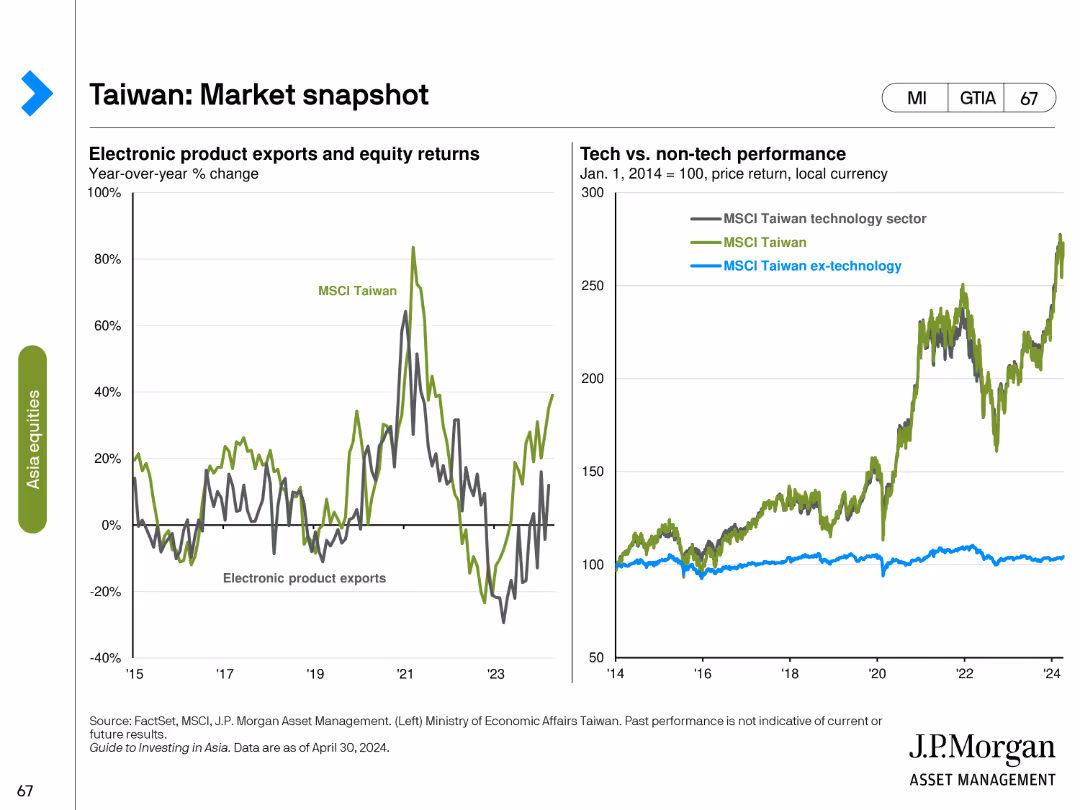
This slide includes two line charts: one showing electronic product exports and equity returns, and the other showing the performance of the MSCI Taiwan technology sector versus non-technology sectors.
Market Analysis and Trends
Financial Services
The slide provides an overview of Taiwan's market, focusing on the relationship between electronic product exports and equity returns, and comparing the performance of technology and non-technology sectors to identify key market drivers.
Taiwan, market snapshot, electronic exports, equity returns, MSCI Taiwan, technology sector, non-technology, market drivers, financial analysis, market overview
Multiple Chart
JP Morgan
Saved
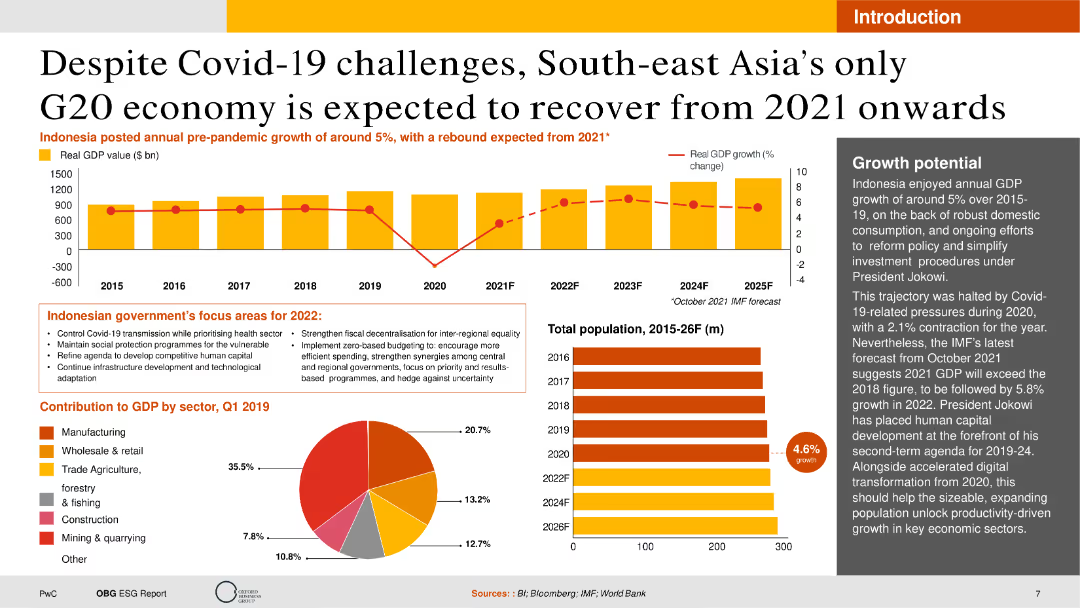
The slide contains a combination of text, a column chart showing GDP growth, and a pie chart detailing sector contributions to GDP. The layout is rich with data and visuals but remains clear and accessible.
Market Analysis and Trends
Financial Services
This slide provides an analysis of Indonesia's economic recovery post-Covid-19, focusing on GDP growth, government policies, and sector contributions. It's useful for understanding market recovery trends and economic forecasts.
GDP, Economic Recovery, Covid-19, Indonesia, Growth
Multiple Chart
PwC/Strategy&
Saved
The slide includes column charts illustrating investment in business divisions over time with projected future growth.
Strategic Planning
Financial Services
Discusses the strategic investment across various business divisions aiming to drive future financial returns and operational efficiency.
investments, strategy, growth, divisions, returns
Mixed Chart
Barclays
Saved
Pie chart of SUB loan book breakdown by sector, with bullet points on quality and performance of credit.
Risk Assessment and Management
Financial Services
Shows the composition of SUB loan book and emphasizes the low level of provisions for credit losses, highlighting strong loan quality.
Credit losses, SUB loan book, sector breakdown, loan quality, provisions
Mixed Chart
Credit Suisse
Saved
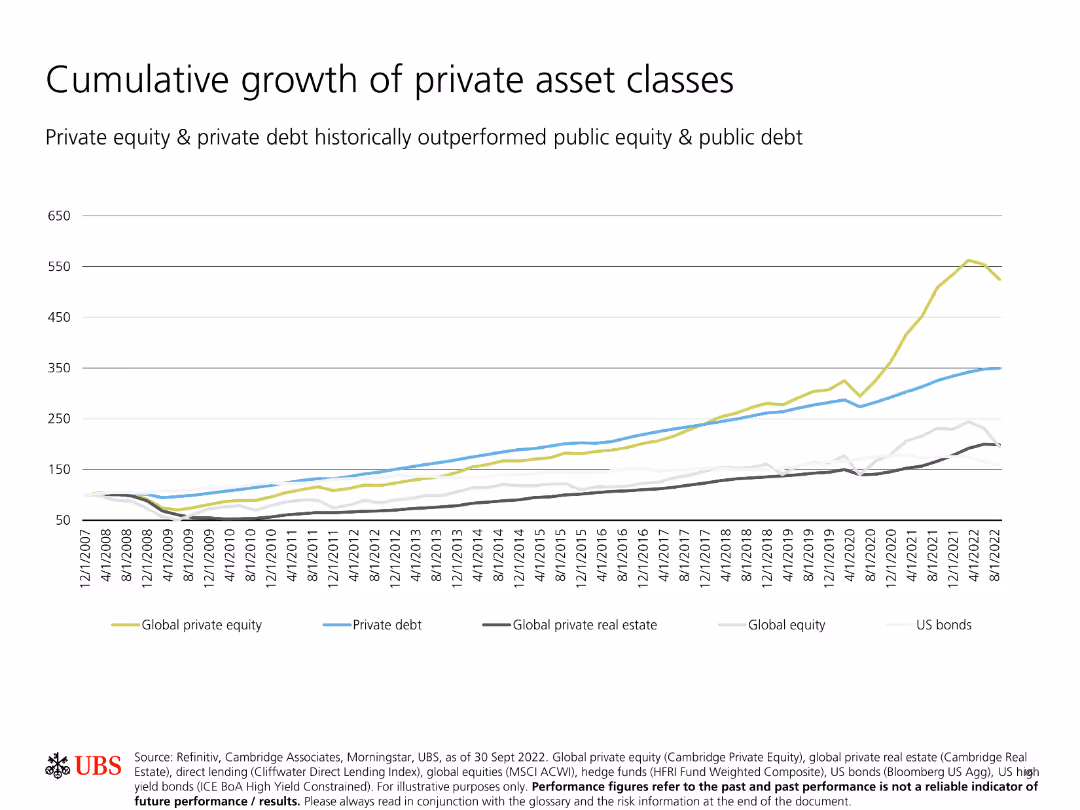
Shows a line chart comparing the cumulative growth of different private asset classes over time, including private equity, private debt, and global private real estate.
Investment Analysis
Financial Services
Illustrates the superior cumulative growth of private asset classes compared to public equity and debt, indicating stronger long-term performance.
Cumulative growth, private asset classes, private equity, private debt, real estate
Single Chart
UBS
Saved
The slide includes a vertical bar chart comparing net agreement with the statement on global citizenship across various countries.
Market Analysis and Trends
Technology & Software
The slide presents survey data showing mixed feelings about global citizenship, particularly in emerging markets.
Global citizenship, emerging markets, survey, public opinion, international trends
Mixed Chart
IPSOS
Saved
This slide presents a line chart showing the market performance of publicly listed companies in discrete automation over the last five years, categorized by segments like machine vision & sensors, drives/motion control, robotics, system integrators, and machine builders. It also includes logos of notable companies in each segment.
Market Analysis and Trends
Industrial & Manufacturing
The slide analyzes the market performance of companies in discrete automation, comparing segments like machine vision, drives, robotics, system integrators, and machine builders, with a focus on EV/EBITDA ratios.
Market Performance, Discrete Automation, Public Companies, Machine Vision, Robotics, System Integrators, Machine Builders, EV/EBITDA
Mixed Chart
LEK
Saved
Consists of multiple bar charts comparing factors influencing employee turnover.
Human Resources and Talent Management
Professional Services
Offers insights into the drivers of employee turnover, valuable for developing effective retention strategies.
Employee Turnover, Retention Strategies, Job Satisfaction, HR Management, Workforce Analysis
Single Chart
PwC/Strategy&
Saved
Bar charts displaying U.S. employment and revenue by sector during COVID-19, segmented by contact intensity and susceptibility to lockdown measures.
Market Analysis and Trends
Professional Services
Examines the impact of COVID-19 on various U.S. economic sectors, offering insights into employment and revenue changes under different restrictions.
COVID-19, economic sectors, employment, revenue, U.S., impact analysis, lockdown, sector analysis
Multiple Chart
BCG
Saved
This slide is simple yet striking with a central image of a sprouting plant overlaid with a cross-section line, symbolizing growth and investment in green technologies.
Investment Analysis
Environmental Services & Sustainability
This title slide introduces a section focused on identifying viable near-term investment opportunities in the green sector, setting the stage for detailed discussions on specific areas such as renewable energy or sustainable agriculture.
green investment, sustainability, growth opportunities, sectors
Title
Bain
Saved
The slide features a left panel with text about autonomy at work and a right panel with a horizontal bar chart depicting regional differences in providing autonomy to employees.
Human Resources and Talent Management
Professional Services
The slide discusses the importance of workplace autonomy, highlighting survey data on regional disparities in how much freedom employees are given to control their work and make decisions.
Workplace autonomy, employee freedom, regional disparities, survey data, control
Mixed Chart
PwC/Strategy&
Saved
It includes bar and pie charts showing market share gains in various business sectors and regions, with blue tones indicating growth.
Market Analysis and Trends
Financial Services
The slide presents market share growth in investment banking, markets, payments, and securities, highlighting improvements over peers.
market share, investment banking, securities, regional growth, financial analysis
Multiple Chart
JP Morgan
Saved
This is a detailed timeline slide showing the phases of the UK Platform Transformation Programme, with icons denoting the stages from design to phased migration. It features a balance between text and graphics to describe the progress and future steps of the program.
Operational Efficiency
Technology & Software
This slide provides a detailed look at the UK Platform Transformation Programme's stages and planned milestones, used to discuss the program's progress and future planning for successful migration.
Transformation, Milestones, Planning, Programme, Migration
Linear Flow
Morgan Stanley
Saved
The slide presents a blue and white color scheme with multiple charts and a detailed sidebar explaining economic impacts. It features a column chart showing the economic benefits from 2018 to 2020, and flow diagrams outlining benefits for different user groups.
Market Analysis and Trends
Financial Services
This slide analyzes the economic impacts of Copernicus satellite data on the insurance industry regarding natural disasters, highlighting its growing importance in risk assessment and policy pricing.
insurance, natural disasters, economic impacts, satellite data, Copernicus
Mixed Chart
PwC/Strategy&
Saved
Graphic illustration showing the convergence of marketing, sales, and services with icons and text, stressing on cross-functional collaboration.
Technology and Digital Transformation
Professional Services
Advocates for the removal of silos between marketing, sales, and services, suggesting a united approach with a focus on innovation and cross-channel effectiveness.
Marketing, Sales, Services, Innovation, Cross-Channel, Collaboration, Talent Management
Diagram
BCG
Saved
Slide with icons representing different support mechanisms alongside a green color scheme, and text blocks outlining the mismatches in resources for college decision-making.
Human Resources and Talent Management
Education & Training
Discusses the mismatch between the resources available and those desired by students for making informed decisions about college, with a focus on first-generation students.
resources, college, decision-making, first-gen, support
Pillar
BCG
Saved
Contains a bar chart and a photograph. Bar chart shows percentage of consumers who expect eco-friendly products. Photo shows people collaborating.
Customer and Market Segmentation
Environmental Services & Sustainability
Highlights the high consumer demand for eco-friendly products across different regions and emphasizes the importance of making these options widely available.
eco-friendly, consumer demand, market segmentation, partnerships, sustainability
Mixed Chart
Accenture
Saved
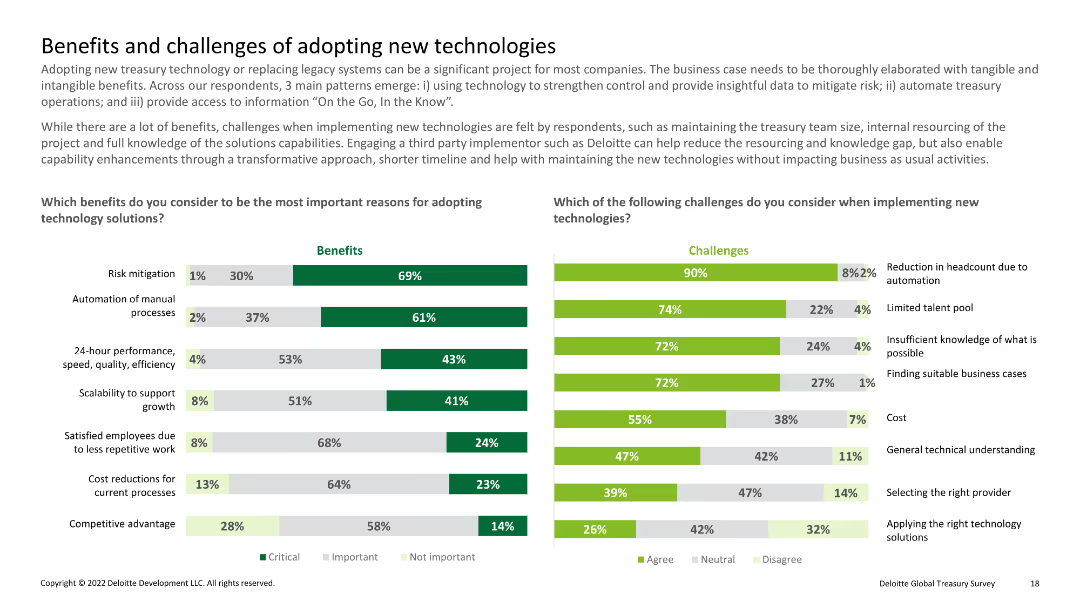
Dual column charts comparing benefits and challenges of new technology adoption, with categories like risk mitigation and cost
Technology and Digital Transformation
Financial Services
Highlights the benefits and challenges associated with adopting new treasury technologies, focusing on risk mitigation and operational efficiency.
New technology, benefits, challenges, treasury, adoption
Multiple Chart
Deloitte
Saved
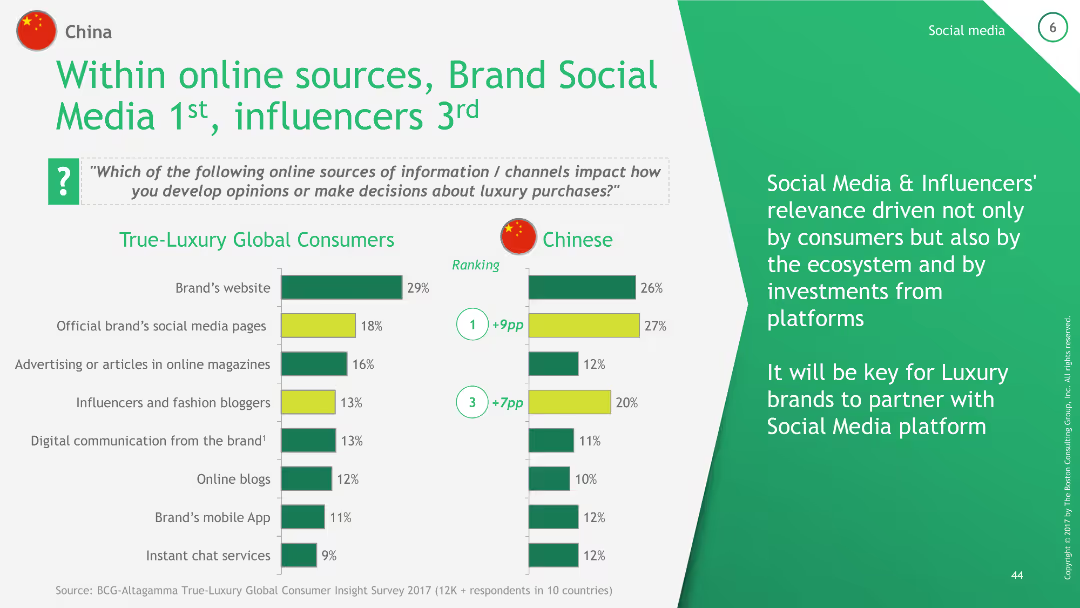
The slide contains a column chart comparing the relevance of various online sources of information for luxury purchases between True-Luxury Global Consumers and Chinese consumers. It ranks Brand's website, Official brand's social media pages, Advertising in online magazines, and Influencers.
Technology and Digital Transformation
Consumer Goods
This slide compares the relevance of different online sources of information for luxury purchases, emphasizing the higher importance of social media and influencers for Chinese consumers compared to global consumers.
China, social media, influencers, online sources, luxury
Multiple Chart
BCG
Saved
Features a concentric circle diagram highlighting six capability measures of operations maturity essential for integrating AI and new technologies.
Technology and Digital Transformation
Technology & Software
Discusses the foundational to advanced operational capabilities required for embedding AI in business processes, emphasizing data and automation, AI integration, and best practices.
AI, technology, capabilities, automation, integration
Table
Accenture
Saved
Dense text layout discussing the potential of GBS to streamline operations and enhance performance.
Strategic Planning
Professional Services
Outlines approaches to optimize global shared services through outsourcing and centralization.
GBS, optimization, shared services, outsourcing, centralization
Mixed Chart
Deloitte
Saved
Large column chart with annotations on the right. Color-coded elements differentiate data points.
Financial Performance
Financial Services
This slide highlights the financial performance of Macquarie Asset Management, with a focus on income related to specific transactions. It's intended for analyzing financial results and understanding factors affecting performance, useful for investor briefings and performance assessments.
asset management, income, performance, financial
Mixed Chart
Morgan Stanley
Saved
The slide features multiple column charts showing growth in different sectors of Thailand's digital economy with forecast data. It's color-coded for clarity.
Market Analysis and Trends
Technology & Software
Shows the anticipated impact of travel recovery on Thailand's digital economy, suggesting a significant push towards growth by 2025.
Thailand, Digital Economy, Travel Recovery, Growth Impact, E-commerce, Online Travel, Transport, Food, 2025
Multiple Chart
Bain
Saved
Column chart showing top concerns for digital health adoption, such as patient privacy and talent shortage, across SEA countries.
Technology and Digital Transformation
Healthcare & Pharmaceuticals
This slide discusses the primary concerns regarding digital health adoption in SEA, highlighting patient privacy and the shortage of skilled talent.
Patient privacy, digital health, concerns, SEA, talent shortage
Multiple Chart
LEK
Saved
This slide features two sets of column charts comparing fiscal year results with annotations explaining each financial figure. The color red is used for textual emphasis and outlining chart areas.
Financial Performance
Industrial & Manufacturing
It's a financial report slide transitioning from EBITA to net results, showing year-over-year changes. Such a slide would be used in financial presentations to stakeholders to outline the company’s financial health and operational results.
Financial Report, EBITA, Net Result, Fiscal Year, Corporate Finance
Multiple Chart
Goldman Sachs
Saved
Previous
Next
If nothing, comes up, please save your slides first
Create a FREE account to continue browsing
Receive Instant Access to 1,000+ slides from companies like McKinsey, Google, and Goldman Sachs
First Name
Last Name
Email
Password
I agree to all
Terms & Privacy Policy
Thank you! Your submission has been received!
Oops! Something went wrong while submitting the form.
Have an account?
Sign in
Column Chart
Heatmap
Chevron
Org Chart
Infographic
Callouts
Timeline
List
Graphic
Picture
Process Flow
Diagram
Paragraph
Map
Table
Framework
Subtitle
Takeaway Box
Icon
Other Chart
Radar Chart
Waterfall Chart
Mekko Chart
Pie Chart
Scatter Plot
Line Chart
Bar chart
Bullet points