My Account
My Slides
Search by Category
Templates
Leave Feedback
Login
Logout
Get Started
Browse all Slides
Browse all Slides
Create a FREE Account
Instant access to 1,000+ real slides from top companies like McKinsey, BCG, Goldman Sachs, Google and many more!
First Name
Last Name
Email
Password
I agree to all
Terms & Privacy Policy
Thank you! Your submission has been received!
Oops! Something went wrong while submitting the form.
Have an account?
Sign in
Saved Slides
This slide contains two column charts showing the growth of branch count and deposits per branch from 2017 to 2022, with comparative data points.
Operational Efficiency
Financial Services
Highlights the growth strategy of the branch network with data on branch counts and deposit per branch, indicating operational expansion and optimization.
branch growth, deposits, network optimization, banking, financial services, CAGR, market expansion, operational efficiency, Chase
Multiple Chart
JP Morgan
Saved
The slide includes text boxes outlining key figures and commitments for future dates, and the 'Act4nature International' logo.
Strategic Planning
Environmental Services & Sustainability
Outlines Michelin's environmental performance in 2022 and its commitments for 2030 to reduce the impact of its operations on biodiversity and ecosystems, highlighting progress and future targets.
Biodiversity, Ecosystems, Environmental Impact, Michelin, Commitments, Sustainability, Life Cycle Analysis, Raw Materials, 2030 Targets, Act4nature
Table
Morgan Stanley
Saved
Features a central circular diagram with Telemedicine at the core, surrounded by four connected circles representing different sectors. The slide uses a clean and simple design with blue and grey colors.
Market Analysis and Trends
Healthcare & Pharmaceuticals
The slide discusses the rapid expansion and commercial interest in Telemedicine platforms during the COVID-19 pandemic, highlighting partnerships and market consolidation as key trends.
Telemedicine, COVID-19, Expansion, Partnerships, Market Consolidation, Healthcare, Platforms, Commercial Interest, Trends, Land Grab
Mixed Chart
Bain
Saved
Includes icons and arrows illustrating migration drivers across political, social, economic, and environmental categories.
Market Analysis and Trends
Government & Public Sector
Discusses comprehensive factors influencing migration decisions globally.
migration, drivers, social, economic, global
Diagram
Roland Berger
Saved
The slide features a column chart showing the increase in WM client assets from 2019 to 2023, alongside initiatives to drive fee-based flows, with text boxes highlighting these initiatives.
Strategic Planning
Financial Services
The slide discusses the significant opportunity to drive fee-based flows from existing brokerage assets at Morgan Stanley, emphasizing growth in WM client assets and strategic initiatives.
Fee-Based Flows, Brokerage Assets, Morgan Stanley, Client Assets, Strategic Initiatives, Column Chart, 2019-2023
Mixed Chart
Morgan Stanley
Saved
This slide features three column charts comparing the "Worst case," "Base case," and "Best case" scenarios for 2019 with data points and percentages.
Market Analysis and Trends
Consumer Goods
Analyzes different growth scenarios for the luxury goods market in 2019 based on the holiday season's performance, Hong Kong's situation, and the US/China trade war.
Market scenarios, Growth impact, Trade war
Multiple Chart
Bain
Saved
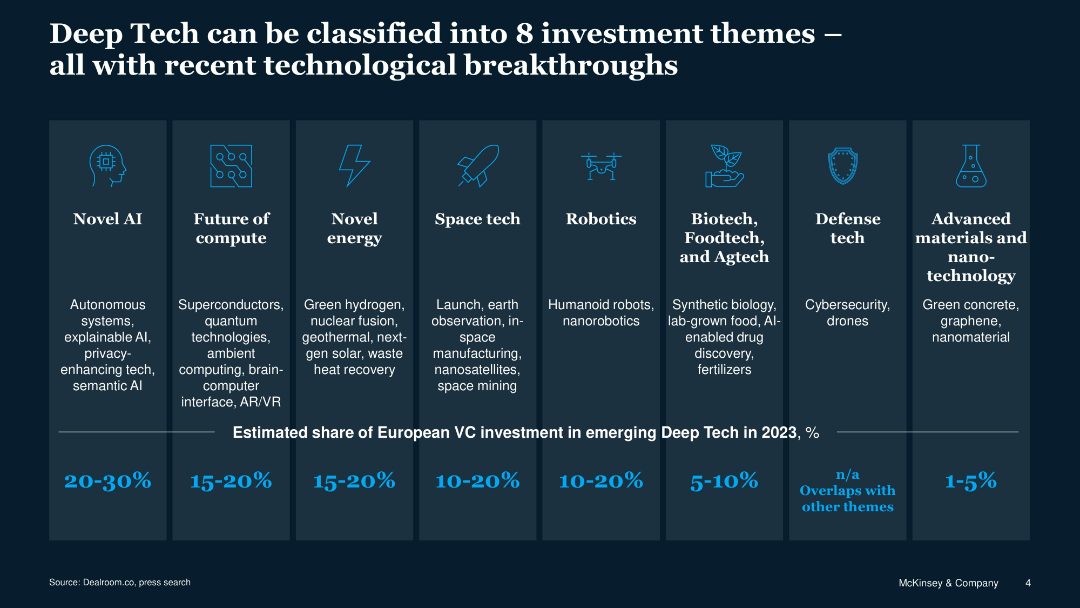
Grid layout with 8 vertical panels, each describing a different Deep Tech category; includes icons and text per panel
Product and Service Analysis
Artificial Intelligence
Categorizes Deep Tech into 8 investment themes such as Novel AI, Future of Compute, Robotics, and Space Tech, and shows their share in European VC investment in 2023.
Deep Tech, VC, themes, investment, AI, robotics, space, compute, biotech
Pillar
McKinsey
Saved
The slide presents statistical data regarding the significance of survey results in a formatted text layout with bullet points and headers.
Performance Metrics and KPIs
Telecommunications
This slide explains the statistical significance and methodology behind a survey conducted by NBN Co, detailing confidence levels and sample sizes.
statistical significance, survey, methodology, NBN Co, data analysis, sample size
Table
Accenture
Saved
Contains icons and a list of different educational initiatives by governments worldwide to bridge the tech education gap, alongside images of a globe and a person.
Human Resources and Talent Management
Education & Training
Summarizes various global efforts to enhance tech education, including opening new tech programs and online learning. Useful for policy discussions or educational development meetings.
education, global, government, tech, initiatives
Table
McKinsey
Saved
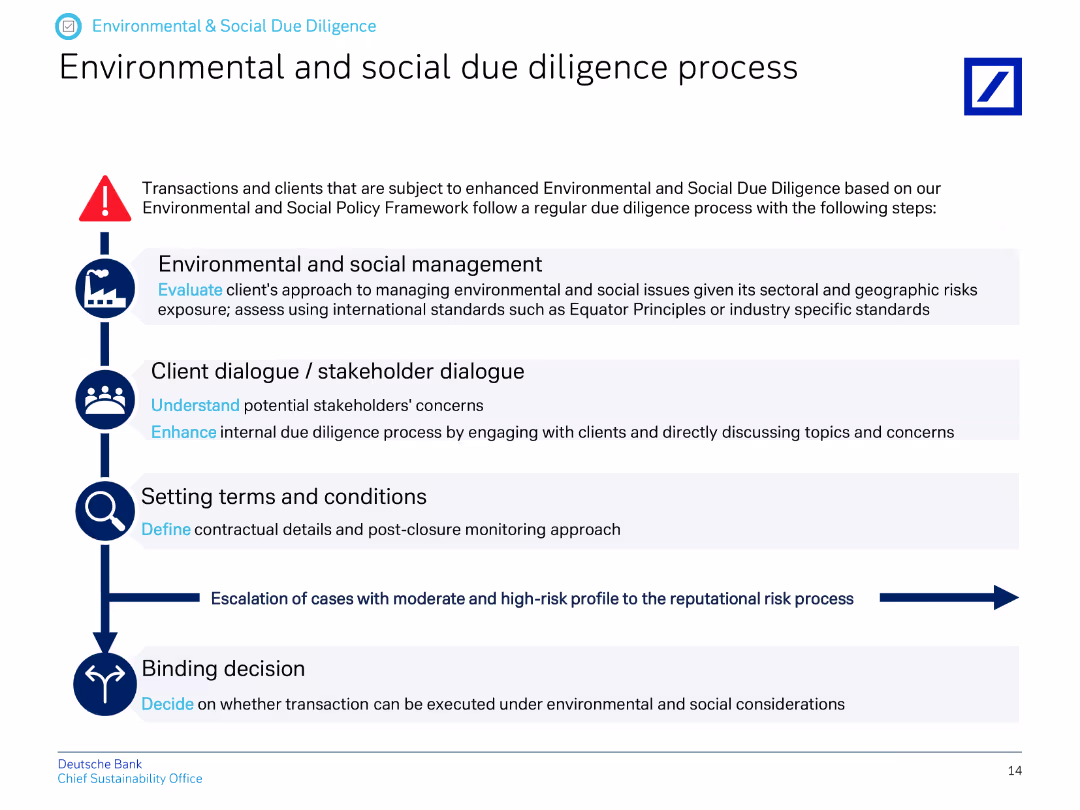
The slide presents a vertical flow chart outlining the steps in the environmental and social due diligence process.
Regulatory and Compliance
Financial Services
This slide explains the process for environmental and social due diligence, detailing steps from management to stakeholder dialogue, setting terms, and making binding decisions.
due diligence, environmental process, social process, stakeholder dialogue, terms and conditions, decision-making
Vertical Flow
Deutsche Bank
Saved
The slide presents future projections using a bar chart showing the digital economy's growth, driven by tier 2 and 3 cities, with accompanying explanatory text.
Market Analysis and Trends
Technology & Software
Forecasts the increasing contribution of tier 2 and 3 cities to Indonesia's digital economy by 2025, indicating significant growth in e-commerce and other sectors.
forecast, digital economy, tier cities, Indonesia, growth, e-commerce, payments
Multiple Chart
Kearney
Saved
Multiple data presentations including column chart for operational business revenue over years and a set of block diagrams illustrating future growth strategies.
Strategic Planning
Financial Services
Analyzes the bank's business diversification and revenue growth across different sectors, emphasizing strategic investments and initiatives aimed at securing a more stable and profitable financial future.
revenue growth, business diversification, strategic investments, financial planning, sector analysis
Mixed Chart
Deutsche Bank
Saved
Diagrams showing the integration of various types of credit data to enhance financial inclusion, with clear visual representation of data relationships.
Industry Overview
Financial Services
Explains how Experian integrates various data types to enhance credit visibility and predictability, aiming to improve financial inclusion with new analytical tools.
financial inclusion, credit data, analytics, visibility, predictability
Diagram
Barclays
Saved
Slide displays a bar chart with timelines for anticipated productivity improvements from AI, with a focus on the next three years.
Technology and Digital Transformation
Technology & Software
Predicts the timeline for noticeable productivity improvements due to AI implementation across the surveyed companies.
AI, productivity, timeline, improvements, technology
Single Chart
Deloitte
Saved
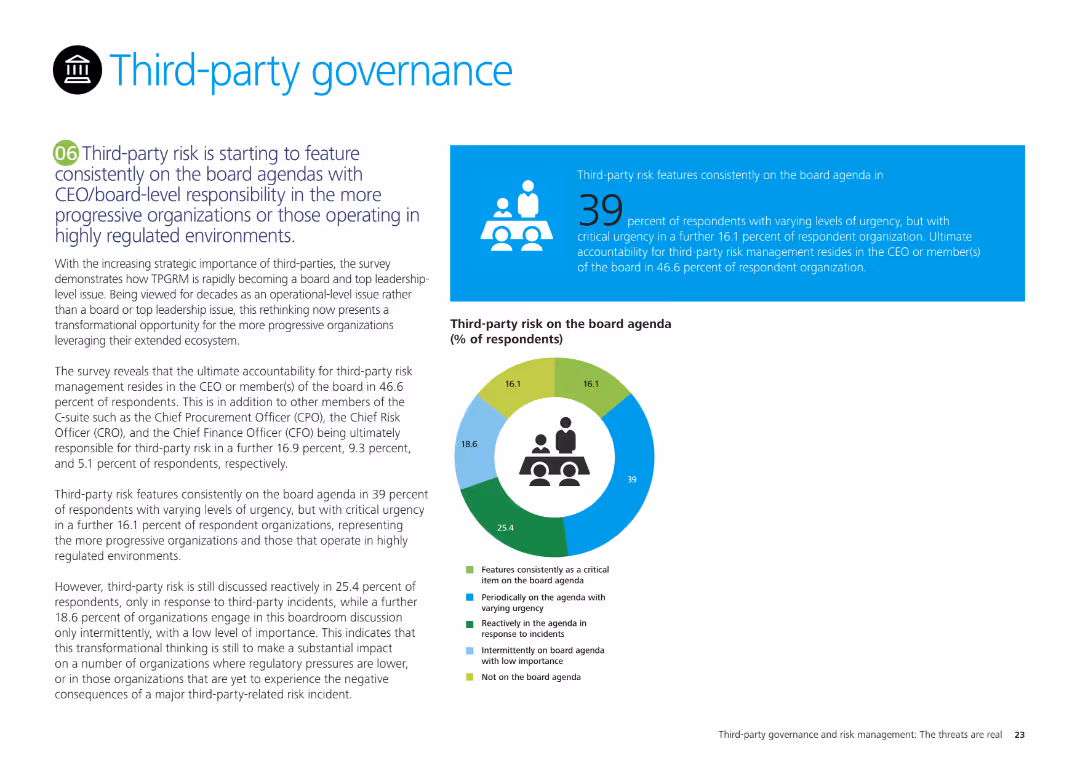
The slide features a pie chart showing the percentage of third-party risk on board agendas and a text box discussing third-party governance trends.
Regulatory and Compliance
Professional Services
It highlights the growing importance of third-party risk in board agendas, detailing survey results on the frequency and urgency of third-party risk discussions at the board level.
Third-party governance, board agendas, risk management, survey results, compliance
Mixed Chart
Deloitte
Saved
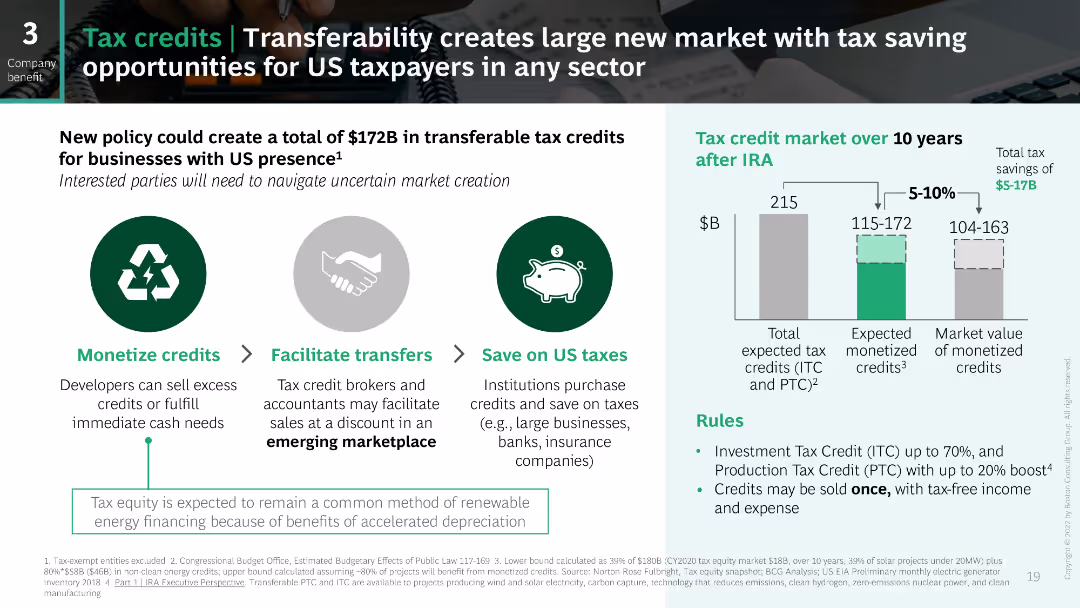
The slide features a column chart showing the potential size of the tax credit market over 10 years following the IRA. It includes icons and text to explain the benefits of transferable tax credits and the expected market value. The design is clean and professional.
Financial Performance
Financial Services
This slide explains the potential financial benefits and market opportunities of transferable tax credits introduced by the IRA, projecting the total market size and the expected monetized value of these credits over the next decade.
tax credits, IRA, financial benefits, market size, transfer
Mixed Chart
BCG
Saved
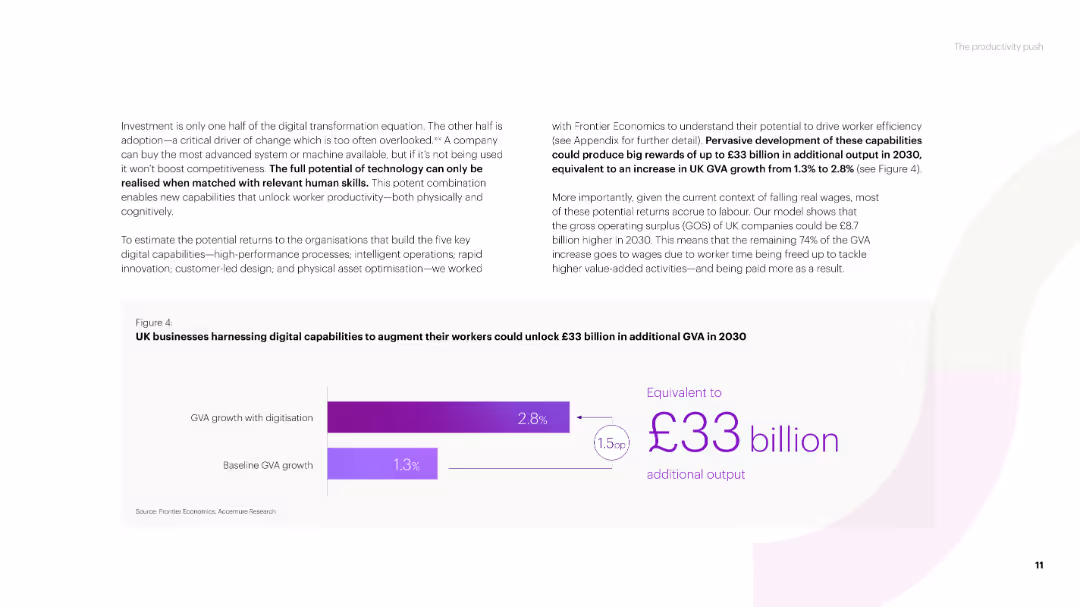
A text-heavy slide with a title and several paragraphs discussing the potential of technology for business growth. Includes a column chart showing GVA growth with digitization versus baseline GVA growth in the UK.
Strategic Planning
Technology & Software
The slide emphasizes the importance of digital capabilities for business productivity, projecting significant additional GVA growth for UK businesses by 2030 through the adoption of technology.
technology potential, digital capabilities, GVA growth, UK businesses, productivity
Mixed Chart
Accenture
Saved
Features a bar chart with color-coded bars, alongside bulleted lists of key findings related to governance roles within shared services. The visual elements are clearly separated from textual elements for easy reading.
Organizational Structure and Change
Professional Services
Explores the roles of regional and global process owners within shared services, focusing on their impact on efficiency and effectiveness. This slide is suitable for discussions on structuring governance to enhance organizational processes.
Process owners, shared services, governance, efficiency, effectiveness
Mixed Chart
Deloitte
Saved
The slide presents a statement on talent recruitment priorities with an arrow pointing towards the statistic that 87% of companies prefer cultural fit. It features a bar graph with percentages of respondents and statements on recruitment strategies. The design uses contrasting colors to distinguish between different categories of responses.
Human Resources and Talent Management
Professional Services
This slide addresses a contradiction in recruitment strategy where a significant majority of companies favor cultural fit over innovative thinking. It uses a bar graph to depict responses of all participants, and includes direct quotes from companies explaining their approach towards balancing cultural fit and diversity of thought in their hiring processes.
talent recruitment, cultural fit, disruptive thinking, company strategy, hiring, innovation, survey
Text Only
Kearney
Saved
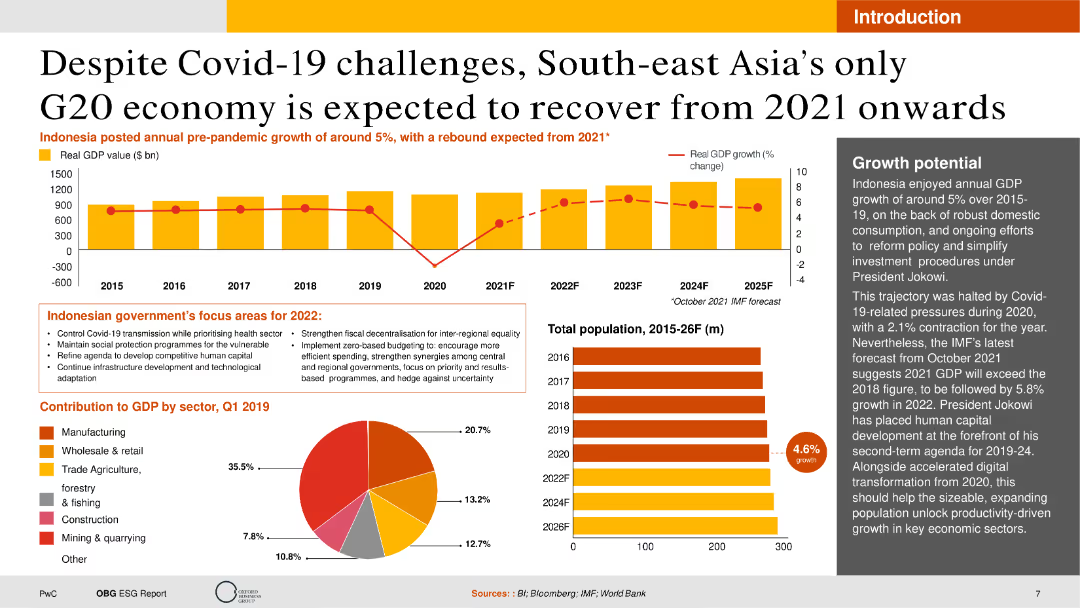
The slide contains a combination of text, a column chart showing GDP growth, and a pie chart detailing sector contributions to GDP. The layout is rich with data and visuals but remains clear and accessible.
Market Analysis and Trends
Financial Services
This slide provides an analysis of Indonesia's economic recovery post-Covid-19, focusing on GDP growth, government policies, and sector contributions. It's useful for understanding market recovery trends and economic forecasts.
GDP, Economic Recovery, Covid-19, Indonesia, Growth
Multiple Chart
PwC/Strategy&
Saved
Line graph showing trends in technology investments over time, accompanied by a column chart comparing technology and business capabilities.
Technology and Digital Transformation
Technology & Software
Analyzes the impact of strong technology and business capabilities on long-term profitable growth, highlighting the importance of strategic investments.
technology investments, profitable growth, business capabilities, long-term, strategic investments, trends, line graph, bar chart
Multiple Chart
Accenture
Saved
Features a self-assessment of company capabilities in areas like supply chain and risk management, illustrated with bar graphs and a color-coded rating system.
Operational Efficiency
Financial Services
Evaluates organizational capabilities in handling uncertainties, identifying areas like supply chain resilience and digital sales as needing improvement, and suggesting potential strategic actions to enhance these capabilities.
capabilities assessment, supply chain resilience, risk management, strategic actions
Table
BCG
Saved
The slide presents a linear progression of trends and impacts in a data-driven format. Key trends and challenges are highlighted with icons and brief descriptions, each marked with a red dot. The red-to-black gradient emphasizes the flow from current trends to delayed impacts.
Risk Assessment and Management
Professional Services
This slide is utilized to describe the current macroeconomic challenges and uncertainties. It emphasizes trends like natural resource shortages, global food pricing disruption, and financial market instability, leading to potential delayed impacts such as technological disruption and geopolitical realignment.
Macro Environment, Challenges, Trends, Uncertainty, Risks, Geopolitical, Technological, Economic Slowdown
Linear Flow
Bain
Saved
Slide with textual content and icons, comparing objectives, strengths, and opportunities in two-column format. Uses iconography for visual emphasis on certain points.
Strategic Planning
Financial Services
Communicates strategies and objectives of a financial institution, illustrating the foundation of strengths and addressing opportunities.
strategies, objectives, banking, growth, opportunities, strengths, financial planning, market share, customer experience, innovation
Table
JP Morgan
Saved
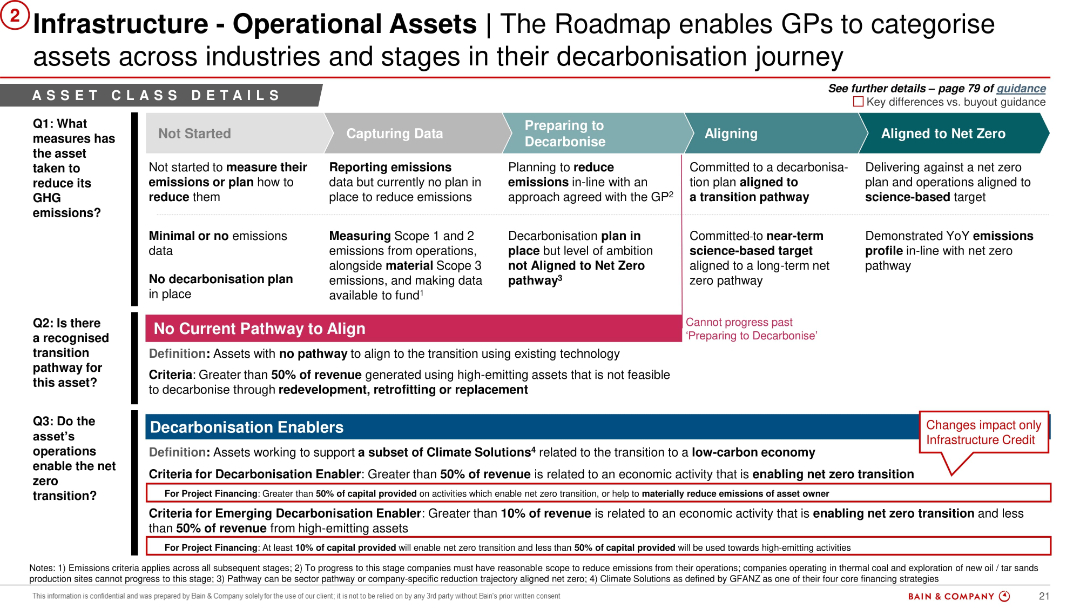
Complex matrix-style slide with color-coded rows and columns. Three main questions structure the content with row-wise answers. Special colored callouts for "No Current Pathway" and "Decarbonisation Enablers".
Strategic Planning
Energy & Utilities
Categorizes infrastructure assets based on their emissions measures, potential for transition, and alignment feasibility. Includes definitions for assets with no alignment pathway and introduces Decarbonisation Enablers for infrastructure credit. Serves as a guidance framework for asset classification.
infrastructure, emissions, GHG, decarbonisation, roadmap, net zero, operational assets, transition
Linear Flow
Bain
Saved
Previous
Next
If nothing, comes up, please save your slides first
Create a FREE account to continue browsing
Receive Instant Access to 1,000+ slides from companies like McKinsey, Google, and Goldman Sachs
First Name
Last Name
Email
Password
I agree to all
Terms & Privacy Policy
Thank you! Your submission has been received!
Oops! Something went wrong while submitting the form.
Have an account?
Sign in
Column Chart
Heatmap
Chevron
Org Chart
Infographic
Callouts
Timeline
List
Graphic
Picture
Process Flow
Diagram
Paragraph
Map
Table
Framework
Subtitle
Takeaway Box
Icon
Other Chart
Radar Chart
Waterfall Chart
Mekko Chart
Pie Chart
Scatter Plot
Line Chart
Bar chart
Bullet points