My Account
My Slides
Search by Category
Templates
Leave Feedback
Login
Logout
Get Started
Browse all Slides
Browse all Slides
Create a FREE Account
Instant access to 1,000+ real slides from top companies like McKinsey, BCG, Goldman Sachs, Google and many more!
First Name
Last Name
Email
Password
I agree to all
Terms & Privacy Policy
Thank you! Your submission has been received!
Oops! Something went wrong while submitting the form.
Have an account?
Sign in
Saved Slides
Slide with three columns comparing different aspects of supply chain disruptions with icons, charts, and highlighted text.
Market Analysis and Trends
Transportation & Logistics
Analyzes global supply chain disruptions due to COVID-19, aimed at logistics professionals for strategic planning.
supply chain, production, logistics, transportation, customer demand, COVID-19, global impact, market analysis
Header Horizontal
McKinsey
Saved
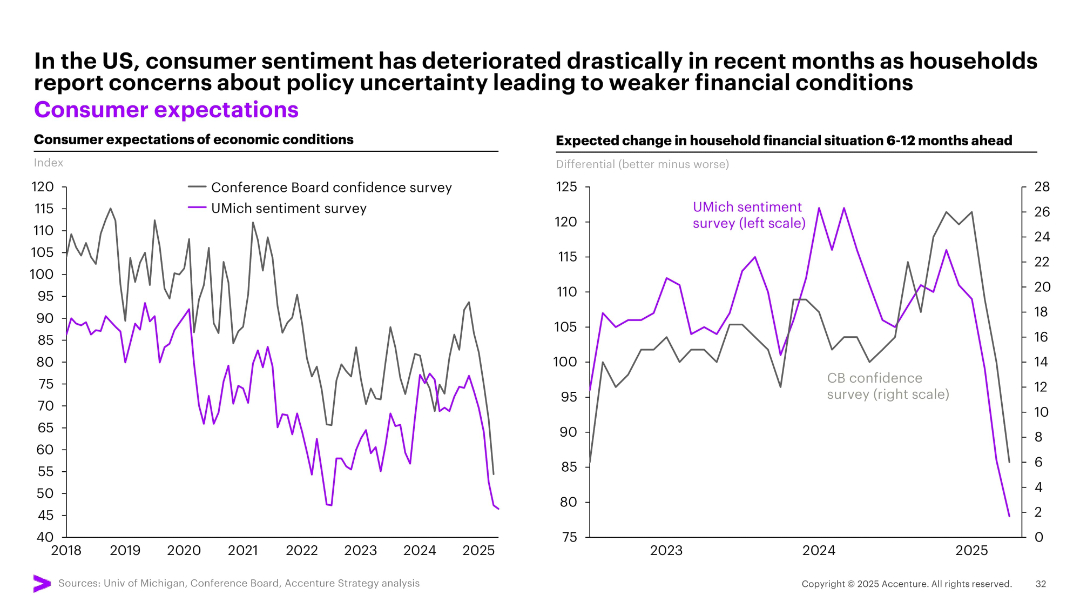
Dual line charts comparing US consumer expectations from two different sentiment surveys over time.
Market Analysis and Trends
Financial Services
The slide shows a marked decline in consumer sentiment in the US based on two major surveys (Conference Board and UMich), reflecting rising concerns over future economic and financial conditions amid policy uncertainty.
consumer sentiment, US economy, surveys, financial outlook, expectations, decline, uncertainty, economic mood
Multiple Chart
Accenture
Saved
Contains a line chart comparing the revenue trends for traditional TV and OTT video in the Asia Pacific region, excluding Mainland China, from 2016 to 2025. The slide also features text discussing the impact of consumer behavior shifts and technological advancements on these media formats, particularly highlighting the influence of COVID-19 and 5G on market trends.
Market Analysis and Trends
Media & Entertainment
Offers a broader regional perspective on the growth of OTT video services compared to traditional TV, emphasizing the slow but steady increase in OTT revenues across the Asia Pacific region. This slide provides context for the larger shifts in media consumption patterns influenced by technological and societal changes.
OTT, traditional TV, Asia Pacific, revenue trends, growth, COVID-19, 5G, line chart
Mixed Chart
PwC/Strategy&
Saved
The slide contains a column chart comparing older worker employment rates across various countries and a text section estimating the potential GDP boost from increased employment rates.
Market Analysis and Trends
Financial Services
The slide discusses the economic impact of increasing older worker employment rates, highlighting the potential GDP boost for OECD countries if they reach New Zealand's levels.
Employment, GDP, Economic impact, OECD, Older workers
Multiple Chart
PwC/Strategy&
Saved
Features two line charts comparing wage inflation measures and core inflation trends, with annotations for clarity. It uses a dual-axis for percentage comparison.
Financial Performance
Financial Services
Discusses the discrepancy between wage and price inflation, emphasizing their high rates, possibly used in financial reviews or policy discussions.
wage inflation, price inflation, economic trends, financial reviews, policy discussions
Multiple Chart
Citigroup
Saved
Features a global map showing countries with varying levels of commitment to achieving net-zero emissions. The countries are color-coded based on their current commitment status, ranging from no target to net-zero commitments, with a legend explaining the color coding.
Regulatory and Compliance
Environmental Services & Sustainability
Analyzes global commitments to achieving net zero emissions, highlighting the disparities in climate ambition across different regions. Useful for evaluating the progress and commitments of countries in terms of climate action.
Net zero, Climate commitments, Global analysis, 2050
Mixed Chart
BCG
Saved
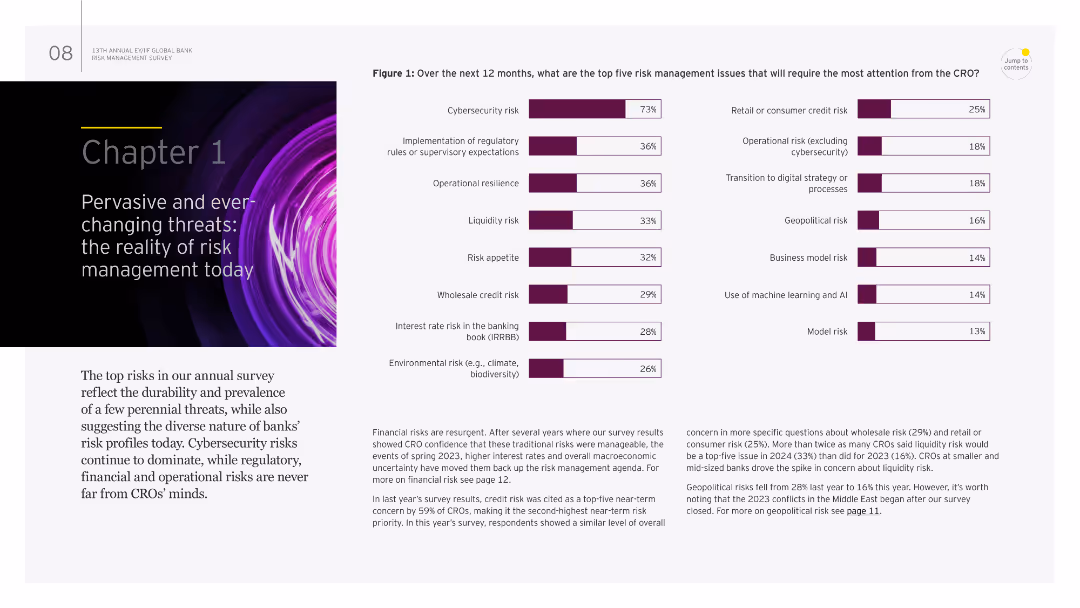
The slide features a mix of text and a column chart. It highlights the top risk management issues for the next 12 months, such as cybersecurity risk and regulatory expectations.
Risk Assessment and Management
Financial Services
It provides an overview of the most pressing risk management challenges, including cybersecurity and regulatory changes, emphasizing the dynamic nature of these threats. This slide is useful for risk assessment and management strategies.
risk management, cybersecurity, regulatory expectations, operational resilience, threats
Multiple Chart
EY
Saved
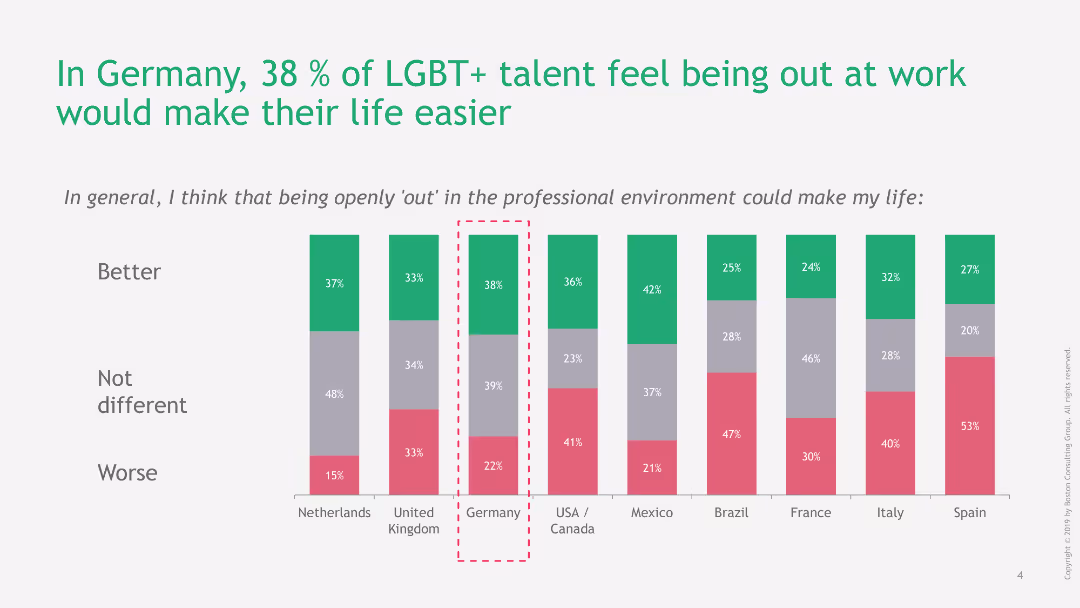
Column chart showing percentages of LGBT+ talents' opinions on how being out would affect their work life. Green, gray, and red bars represent different impacts.
Regulatory and Compliance
Professional Services
The slide presents data on the perceived impact of being openly out at work among LGBT+ talents, with a focus on Germany where 38% feel it would improve their life.
LGBT+, Germany, workplace, diversity, life impact
Single Chart
BCG
Saved
Four column charts comparing survey findings in wealth & regulation, digital transformation, risk & reputation, and strategy & governance.
Market Analysis and Trends
Financial Services
Highlights key survey findings in four areas: regulatory concerns, digital transformation urgency, risk management issues, and strategy & governance priorities.
wealth, regulation, digital transformation, risk management, strategy, governance
Multiple Chart
EY
Saved
Three segmented boxes describing different blockchain ecosystems: DCEP RMB payment system, private domestic blockchains, and global trade connectivity. Each segment includes key players and functionalities.
Technology and Digital Transformation
Technology & Software
Outlines three major blockchain ecosystems in China: DCEP payment system for digital transactions, private domestic blockchains for B2B transactions, and global trade connectivity.
Blockchain, ecosystems, China, DCEP, RMB payment system, private blockchains, global trade, connectivity, B2B transactions, digital payments
Table
EY
Saved
A detailed text layout with three columns providing information on Swiss Bank, Share-Backed Lending, and IB Leveraged Finance portfolios. Text boxes highlight forward-looking risk management measures for each portfolio.
Risk Assessment and Management
Financial Services
Provides an in-depth look at selected portfolios, their investment grade ratings, exposure levels, and forward-looking risk management measures. It focuses on high-quality assets, conservative lending standards, and de-risking strategies.
Swiss Bank, Share-Backed Lending, IB Leveraged Finance, risk management, portfolios
Table
Credit Suisse
Saved
The slide presents a two-column text format with a small section in the lower right corner depicting a U.S. map with colored dots indicating branch locations. The colors correspond to a legend identifying various cities. The layout is well-organized and easy to follow.
Financial Performance
Financial Services
Highlights the expansion of community centers and the role of Community Managers. It discusses trust-building with clients and providing financial education, with a focus on minority communities. The map shows branch locations across the U.S.
Community Banking, Financial Education, Branch Expansion, Trust-Building, Minority Communities, U.S. Map, Community Managers
Boxed
JP Morgan
Saved
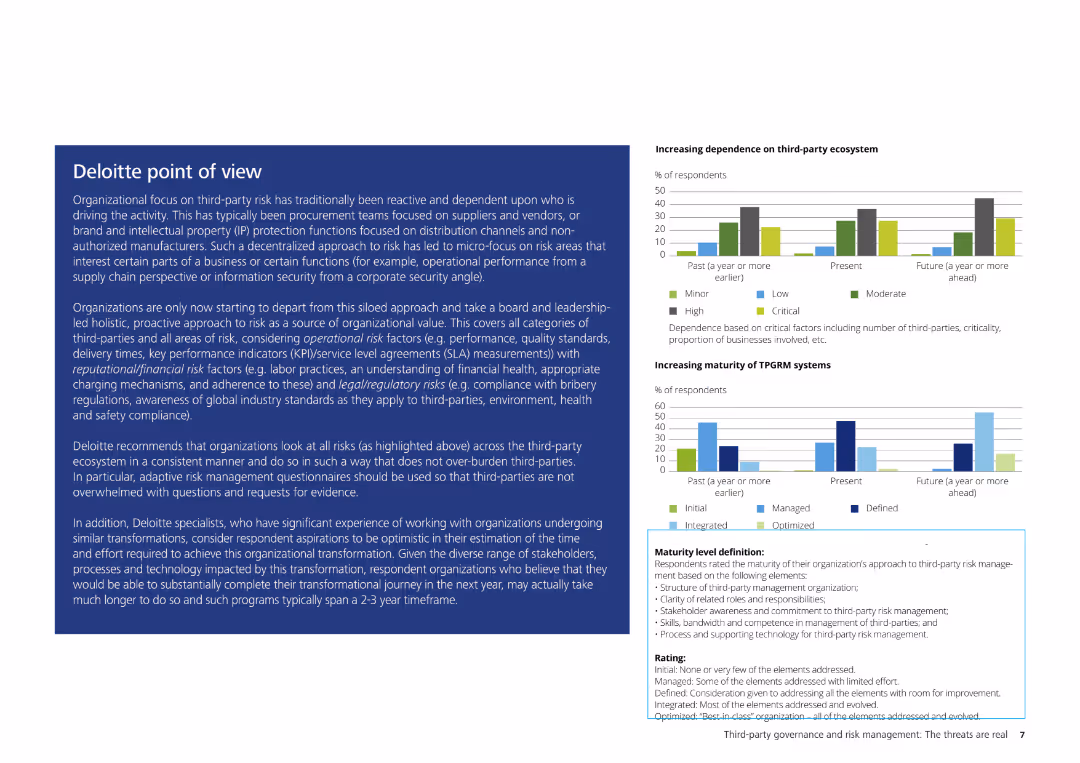
The slide contains a detailed text description of Deloitte's perspective on third-party risk, accompanied by small charts illustrating increasing dependence on third-party ecosystems and the maturity of TPRGM systems.
Risk Assessment and Management
Professional Services
This slide provides Deloitte's perspective on third-party risk management, highlighting the importance of a proactive, holistic approach to risk. It discusses various risk factors and offers recommendations for improving third-party risk management processes.
Deloitte, third-party risk, risk management, TPRGM systems, professional services, risk assessment, organizational strategy
Multiple Chart
Deloitte
Saved
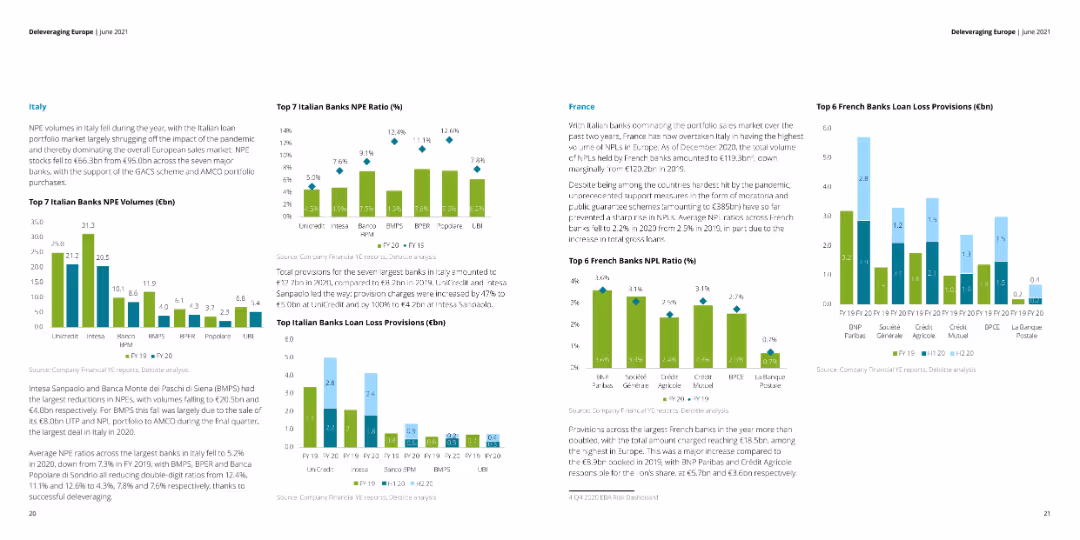
The slide features multiple column charts showing NPE volumes, NPE ratios, and loan loss provisions for top banks in Italy and France. Text sections provide detailed explanations of the charts.
Financial Performance
Financial Services
This slide analyzes the NPE volumes, NPE ratios, and loan loss provisions for the top banks in Italy and France. It discusses the impact of the pandemic and government support schemes on the financial metrics.
NPE volumes, NPE ratios, loan loss, Italy, France
Multiple Chart
Deloitte
Saved
Line graph comparing consumer sentiment over time in five countries regarding the ongoing impact of COVID-19.
Market Analysis and Trends
Consumer Goods
Tracks changes in consumer sentiment during the COVID-19 pandemic across different regions, useful for market analysis in consumer goods industries.
COVID-19, consumer sentiment, market analysis, trends, regions
Single Chart
BCG
Saved
The slide features a bar chart showing percentages of respondents' management of their primary investment accounts. Each bar represents a different management method.
Investment Analysis
Financial Services
The slide presents survey data on how respondents manage their primary investment accounts, including using advisors, self-directed investment, and online advisors.
investment, advisor, portfolio, self-directed, online
Single Chart
IPSOS
Saved
The slide features bar charts showing risks and opportunities percentages. Text boxes detail risks and opportunities, and a summary box highlights key takeaways.
Market Analysis and Trends
Transportation & Logistics
It shows survey results indicating a high need for repositioning in automotive functions due to digitalization, with focus on production, procurement, and logistics.
Digitalization, automotive, risks, opportunities, production, procurement, logistics
Multiple Chart
Roland Berger
Saved
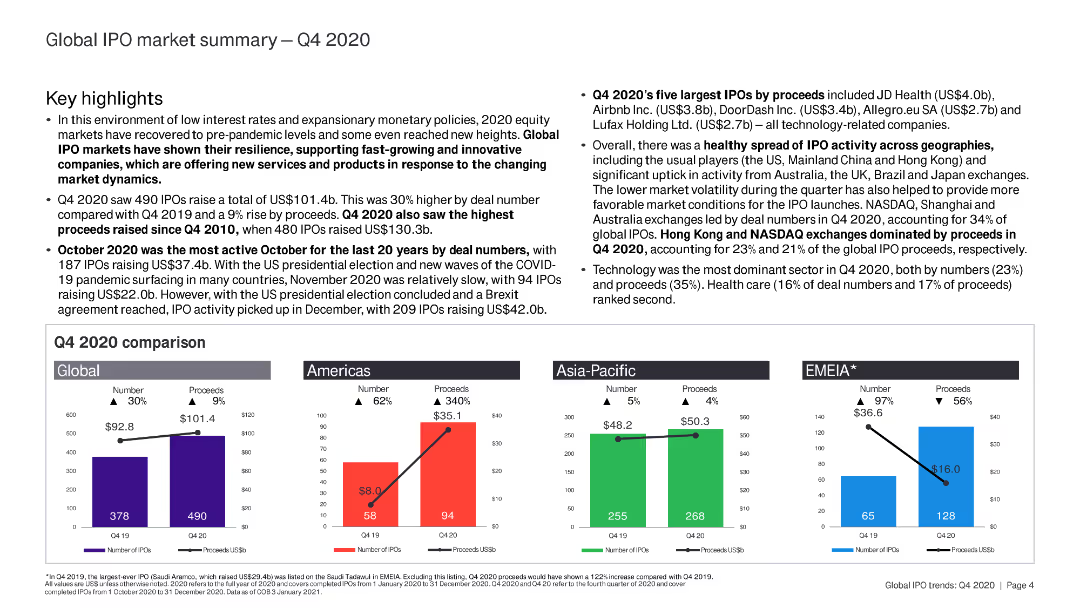
The slide is text-heavy with key highlights and comparative analysis of IPO markets in Q4 2020. It includes small bar charts for regional comparisons.
Market Analysis and Trends
Financial Services
This slide summarizes the global IPO market in Q4 2020, covering key highlights, largest IPOs, and regional analysis.
IPO, Q4 2020, global market, key highlights, regional analysis
Multiple Chart
EY
Saved
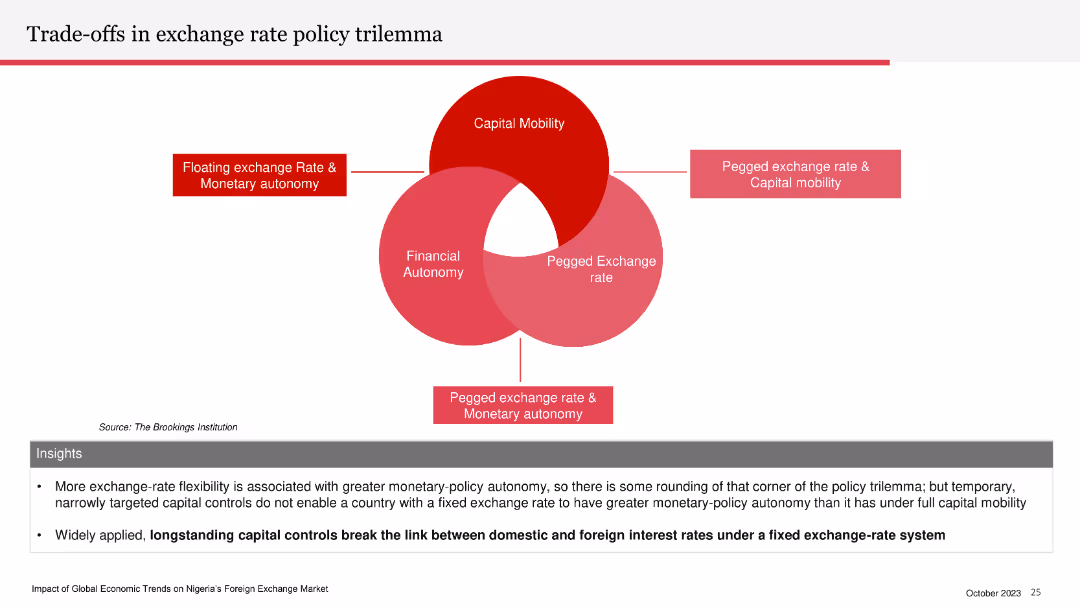
Venn diagram illustrating the exchange rate policy trilemma: capital mobility, financial autonomy, and pegged exchange rate. Insights section below.
Strategic Planning
Financial Services
The slide explains the trade-offs involved in exchange rate policy, emphasizing the limitations of having a fixed exchange rate, capital mobility, and monetary autonomy simultaneously. It highlights the impact of capital controls on interest rates.
exchange rate, policy trilemma, capital mobility, financial autonomy, pegged rate
Diagram
PwC/Strategy&
Saved
Contains stacked bar charts with detailed legends to explain subscriber behaviors related to costs, using a clean and effective layout.
Financial Performance
Media & Entertainment
Provides a detailed look at the financial aspects affecting consumer decisions in video streaming services, emphasizing the impact of cost on service cancellation. Important for financial analysis within the media sector.
streaming, costs, financial analysis, consumer decisions
Single Chart
Deloitte
Saved
Features a column chart depicting digital insurance APE/GWP growth, with projections for 2025. The slide is split between the chart and text analysis, highlighted by colored circles that connect to corresponding explanations.
Market Analysis and Trends
Financial Services
It analyzes the shift in insurance purchase behaviors moving online, disruption of traditional channels, and the rise in general and life insurance sectors' growth. The slide further explores continuous innovation in insurance products amid the digital push.
digital insurance, online transition, innovation, growth, APE/GWP
Mixed Chart
Bain
Saved
The slide contains two charts: a cumulative line chart showing QT start-ups founded from 2001 to 2022, and a column chart showing the number of QT start-ups founded per year. Includes text explaining reasons for the slowdown.
Market Analysis and Trends
Financial Services
This slide highlights the slowdown in the rate of QT start-up creation in 2022 despite record investment, citing lack of talent, few working use cases, and investor trends as potential causes.
start-up creation, investment, market trends, quantum technology, growth slowdown
Multiple Chart
McKinsey
Saved
This slide displays a purple bar chart comparing the share of tasks that can be reinvented by technology across various industries. The layout is split into two columns, with the left showing the percentage of tasks and the right depicting the share of worked hours in 2021.
Strategic Planning
Professional Services
It analyzes the potential for technology-driven job reinvention across industries, presenting augmentation and automation prospects. This slide could be used to discuss workforce transformation trends and the impact of technology on employment across different sectors.
Workforce, Automation, Technology, Job Reinvention, Industry Comparison, Augmentation, Employment Trends, 2021, US Workers, Technology Impact
Single Chart
Accenture
Saved
Text-heavy, focused on leveraging internal and external GBS services to enhance service quality and efficiency and colored pie charts
Strategic Planning
Professional Services
Describes strategic sourcing and the role of shared services in driving company-wide cost savings and service improvement.
strategic sourcing, GBS, services, cost savings, efficiency
Multiple Chart
Deloitte
Saved
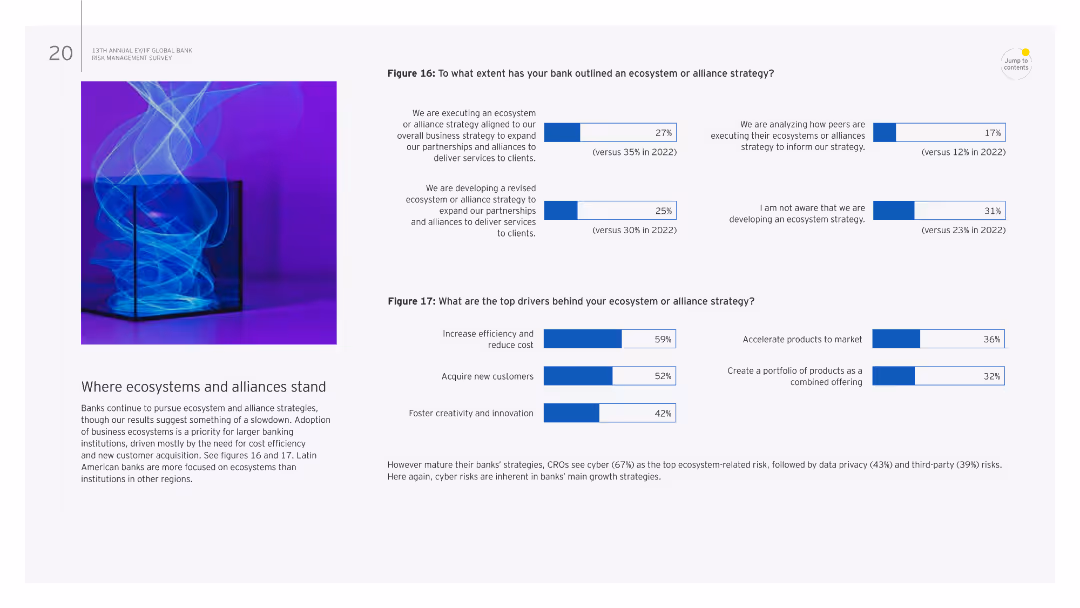
The slide features text and two column charts. The charts detail the extent of ecosystem or alliance strategies and top drivers behind these strategies.
Strategic Planning
Financial Services
It discusses the current state of ecosystem and alliance strategies in banks, including the extent of implementation and key drivers such as efficiency and innovation.
Ecosystems, alliances, strategies, efficiency, innovation
Multiple Chart
EY
Saved
Previous
Next
If nothing, comes up, please save your slides first
Create a FREE account to continue browsing
Receive Instant Access to 1,000+ slides from companies like McKinsey, Google, and Goldman Sachs
First Name
Last Name
Email
Password
I agree to all
Terms & Privacy Policy
Thank you! Your submission has been received!
Oops! Something went wrong while submitting the form.
Have an account?
Sign in
Column Chart
Heatmap
Chevron
Org Chart
Infographic
Callouts
Timeline
List
Graphic
Picture
Process Flow
Diagram
Paragraph
Map
Table
Framework
Subtitle
Takeaway Box
Icon
Other Chart
Radar Chart
Waterfall Chart
Mekko Chart
Pie Chart
Scatter Plot
Line Chart
Bar chart
Bullet points