My Account
My Slides
Search by Category
Templates
Leave Feedback
Login
Logout
Get Started
Browse all Slides
Browse all Slides
Create a FREE Account
Instant access to 1,000+ real slides from top companies like McKinsey, BCG, Goldman Sachs, Google and many more!
First Name
Last Name
Email
Password
I agree to all
Terms & Privacy Policy
Thank you! Your submission has been received!
Oops! Something went wrong while submitting the form.
Have an account?
Sign in
Saved Slides
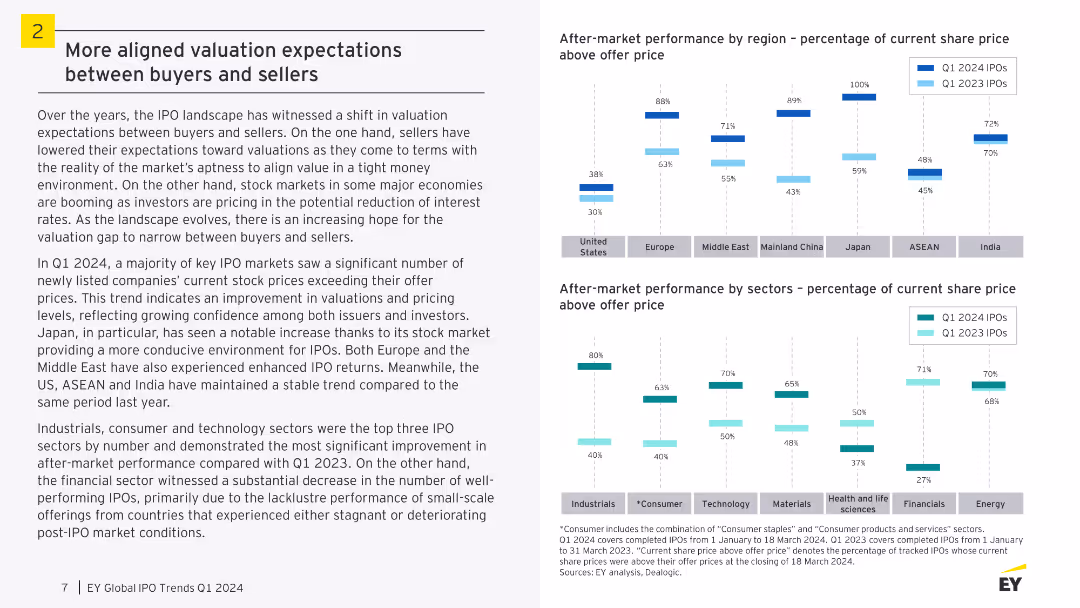
A slide with two column charts comparing after-market performance by region and sectors. The visual complexity is moderate, focusing on column charts with comparative data.
Market Analysis and Trends
Financial Services
The slide discusses the shift in valuation expectations in the IPO landscape, with improved confidence among issuers and investors. It highlights the after-market performance of IPOs in different regions and sectors, showing significant improvements in specific areas.
IPO, Valuation, Buyers, Sellers, Performance, Market
Multiple Chart
EY
Saved
Slide with a dual layout, left side with a photo of foliage, right side with text and two pie charts in red and grey tones illustrating statistical data.
Corporate Finance and Valuation
Government & Public Sector
This slide discusses the shift in corporate goals towards ethical values and social responsibility, highlighting the expectations and perceptions of companies and their employees.
Ethics, Responsibility, Environment, Social, Corporate
Mixed Chart
PwC/Strategy&
Saved
A doughnut chart in the center showing the distribution of crypto asset ownership categories, with percentages indicated in different colors.
Market Analysis and Trends
Financial Services
Presents data on crypto asset ownership among Canadians, highlighting the percentages of current and previous owners, and the breakdown of asset categories.
crypto ownership, crypto assets, investment funds, market analysis, financial services
Mixed Chart
IPSOS
Saved
Column chart showing the annual total music revenue in Scandinavia, split by physical, live, and digital music from 2014 to 2023.
Market Analysis and Trends
Media & Entertainment
The slide highlights trends in the music industry in Scandinavia, emphasizing the steady growth in live and digital music revenues.
music industry, revenue growth, digital music, Scandinavia
Single Chart
PwC/Strategy&
Saved
A stacked bar graph shows the growth of different deal sizes over time, with a focus on larger-ticket and mega rounds. The accompanying text analyzes the trend towards bigger investments.
Investment Analysis
Financial Services
This slide showcases the shift in the venture investing market towards larger-ticket funding rounds, particularly mega rounds over the past two decades. It highlights the increase in average deal size, driven by these substantial investments, and the implications for startups and investors alike. The slide provides a comprehensive view of investment strategies and market responses to evolving business models and funding needs.
funding rounds, mega rounds, venture capital, investment trend, deal size
Mixed Chart
Oliver Wyman
Saved
Slide includes a title at the top, followed by a two-column layout with one column dedicated to methodology description and the other to pie and bar charts displaying demographic data such as ethnicity, age, seniority, and LGBT percentage.
Market Analysis and Trends
Professional Services
The slide presents demographic breakdowns from a survey of 5,000 women across 10 countries, detailing ethnicity, age, seniority, and LGBT representation in the professional environment.
demographics, survey, methodology, ethnicity, age, seniority, professional, representation
Mixed Chart
Deloitte
Saved
The slide features a column chart depicting managers' top three talent management priorities. On the left side, there is an image of a group of professionals in a meeting. The chart uses a mix of orange and red shades to represent different priorities.
Human Resources and Talent Management
Financial Services
The slide highlights that retaining talent is the top priority for managers, followed by hiring/recruiting and ensuring an inclusive culture. It shows that talent retention is critical, particularly in EMEA and Asia-Pacific regions.
Talent retention, recruiting, inclusive culture, diversity, hybrid work, employee productivity
Mixed Chart
EY
Saved
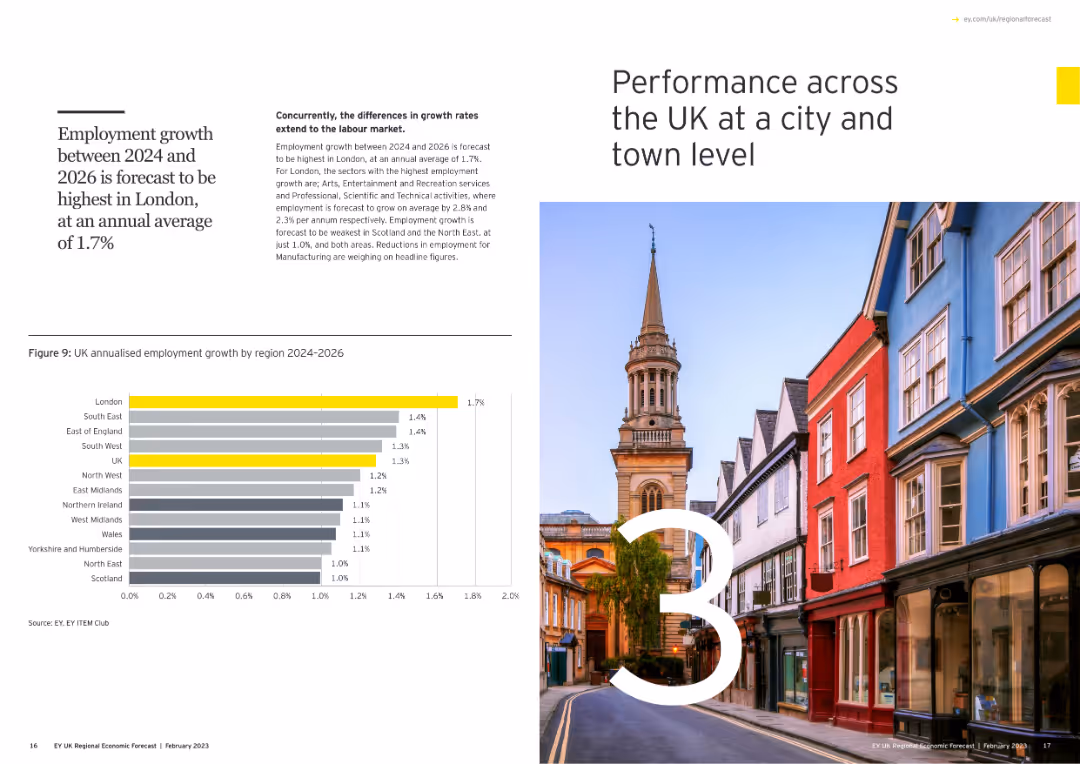
Includes a large number "3" with an image of a cityscape, and a column chart showing annualized employment growth by region for 2024-2026.
Market Analysis and Trends
Government & Public Sector
Examines city and town level performance across the UK, forecasting employment growth from 2024 to 2026, with a focus on regional disparities.
city performance, UK, employment growth, regions, column chart
Mixed Chart
EY
Saved
Left side features a text list with associated percentages, indicating priorities. The right side shows an image of people in a discussion.
Strategic Planning
Government & Public Sector
Survey results showing where respondents believe Greece should focus to maintain its competitive position, including education, reducing taxes, and innovation support.
Greece, competitiveness, education, innovation, strategic priorities
Mixed Chart
EY
Saved
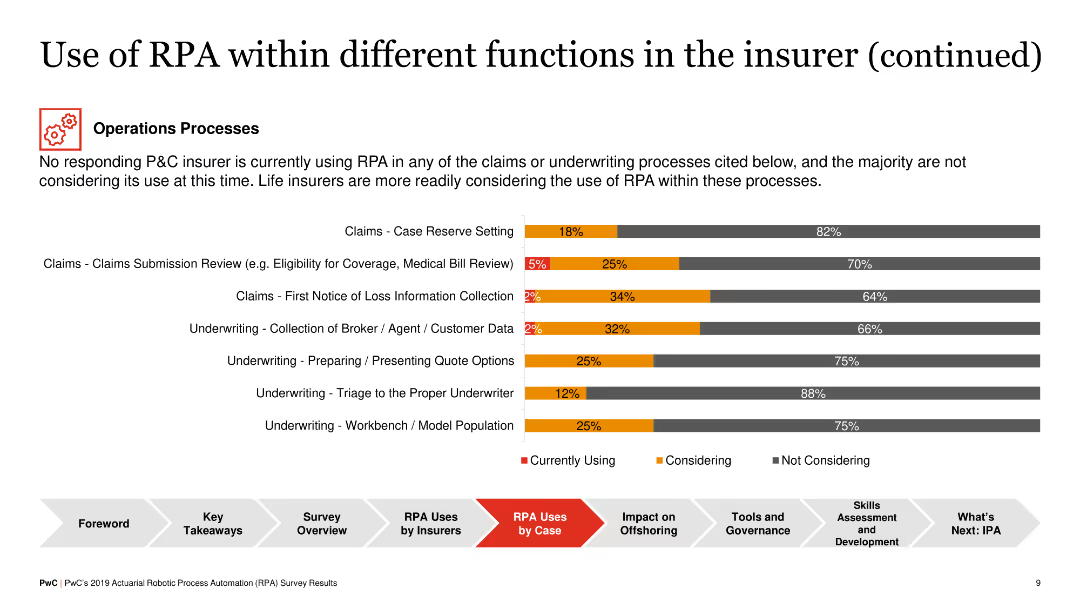
Horizontal bar chart illustrating RPA adoption in operations processes such as claims processing and underwriting, showing different levels of adoption across functions.
Operational Efficiency
Financial Services
This slide highlights the RPA adoption in operational processes within insurance, particularly in claims and underwriting, with life insurers showing more readiness to adopt RPA compared to P&C insurers.
RPA, Operations, Insurance, Claims, Underwriting
Single Chart
PwC/Strategy&
Saved
The slide contains several rectangular callout boxes with icons, a column chart, and text descriptions. It uses a blue and white color palette and has a balanced distribution of visuals and text.
Strategic Planning
Financial Services
Outlines a strategic plan for a wealth franchise, detailing service offerings like full-service, remote advice, and self-directed investing. It serves to illustrate the comprehensive approach to client service across multiple channels, aimed at capturing a larger share of the investment wallet.
Wealth franchise, Strategic plan, Service offerings, Investment, Channels
Mixed Chart
JP Morgan
Saved
The slide features a column chart comparing net interest income under different interest rate scenarios and a line chart of historical interest rates.
Risk Assessment and Management
Financial Services
The slide explains the impact of interest rate changes on net interest income over a three-year period, using illustrative examples.
interest rates, sensitivity, financial, performance, net interest income, risk management
Multiple Chart
UBS
Saved
Features a central triangle with each vertex labeled with a question about work, worker, or workplace. It shows the contrast between future and current work options through a graphical element representing a spectrum.
Strategic Planning
Technology & Software
Examines the disruptors in the future of work, focusing on who can do the work, where, and how. This slide is beneficial for strategic planning regarding workforce evolution.
Disruptors, Future of Work, Strategy, Workforce
Diagram
Deloitte
Saved
The slide features three donut charts showing the diversification of UBS's wholesale funding by source, maturity, and currency for 2Q23, providing a visual representation of funding distribution.
Financial Performance
Financial Services
The slide explains UBS's wholesale funding diversification, highlighting the distribution of funding by source, maturity, and currency for the second quarter of 2023, to showcase the bank's funding strategy and risk management.
wholesale funding, diversification, source, maturity, currency
Multiple Chart
UBS
Saved
This slide includes a column chart comparing the capital expenditure outlook on medical devices/equipment across different regions over three time periods.
Strategic Planning
Healthcare & Pharmaceuticals
This slide discusses the optimistic outlook on future capital expenditure by hospitals, highlighting expected increases in spending on medical devices and equipment.
capital expenditure, medical devices, equipment, hospital spending, regional comparison
Single Chart
LEK
Saved
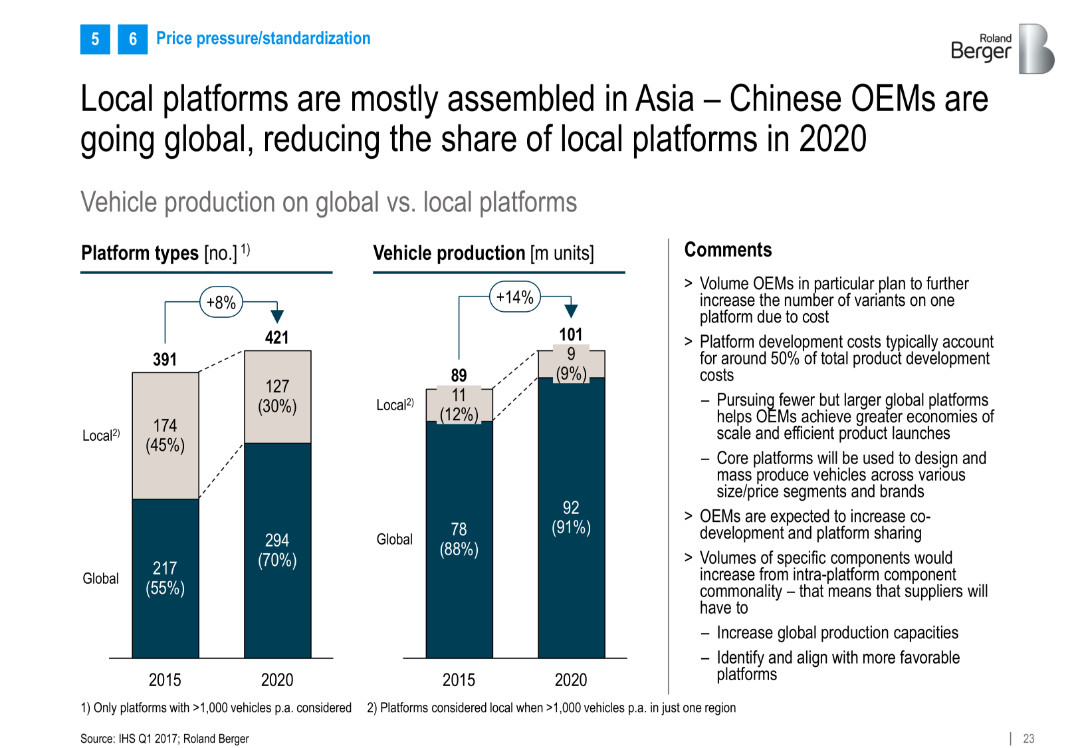
Dual bar charts comparing global vs. local platform types and vehicle production in 2015 vs. 2020; supported by commentary on platform strategies
Operational Efficiency
Industrial & Manufacturing
Analyzes the shift toward global vehicle platforms, especially by Chinese OEMs. Highlights economies of scale and reduced share of local platforms, with implications for co-development and supplier alignment.
global platforms, local platforms, OEM strategy, vehicle production, Asia, China, platform sharing
Multiple Chart
Roland Berger
Saved
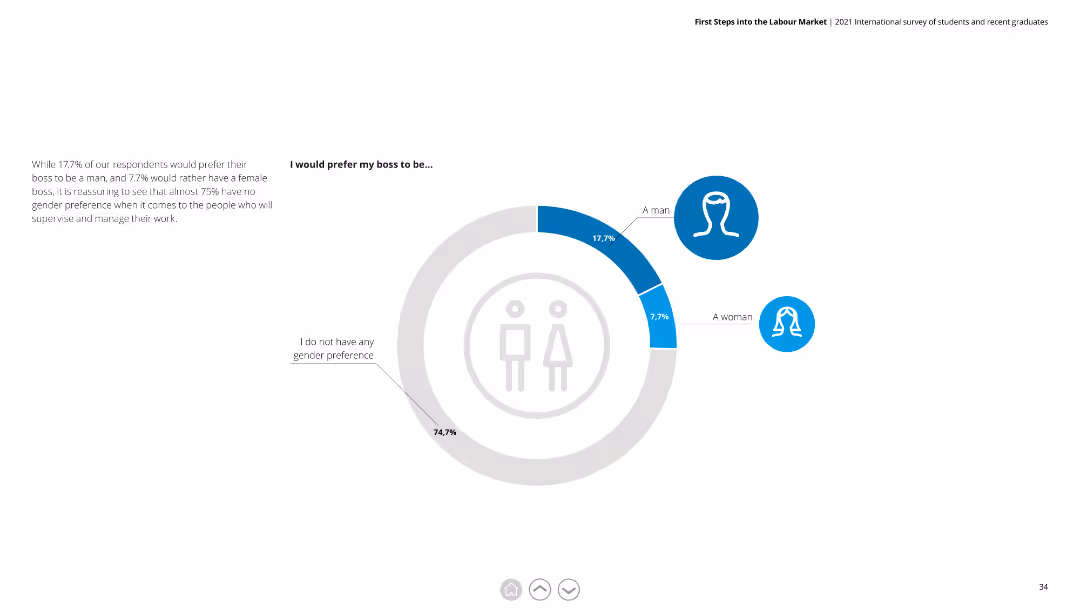
Donut chart showing gender preferences for bosses among respondents, with detailed text explaining the lack of strong gender preference for supervisors.
Human Resources and Talent Management
Education & Training
This slide presents preferences for the gender of bosses among respondents, highlighting a significant majority with no gender preference in choosing their boss.
gender preference, boss, supervisor, managerial preferences, young professionals
Mixed Chart
Deloitte
Saved
Column chart with different concerns people have during COVID-19, showing data comparison between May 2020 and Dec 2020.
Market Analysis and Trends
Healthcare & Pharmaceuticals
Highlights major worries about physical and mental health of family and friends during COVID-19, comparing data between two time points.
COVID-19, mental health, physical health, comparison, family concerns
Single Chart
IPSOS
Saved
The slide shows bar charts comparing concerns of different generations about technology impacting their jobs and the adequacy of training provided by employers.
Market Analysis and Trends
Professional Services
Examines generational differences in perceptions of technology's impact on job security and training adequacy. It serves to inform HR strategies to address specific concerns and training needs across different age groups, promoting a more inclusive approach to technology adoption in the workplace.
generational impact, technology training, job security, HR strategies, workforce development
Multiple Chart
PwC/Strategy&
Saved
This slide features no visual data but offers a text-heavy approach with bulleted lists for clarity on recommendations related to gender equality in the workplace.
Strategic Planning
Professional Services
Provides a summary of recommendations for organizations to improve gender equality, focusing on core enablers. It could be used as a closing slide in strategic meetings focused on diversity and inclusion or as a standalone reference in educational settings on corporate governance.
recommendations, gender equality, workplace, strategy
Multiple Chart
Deloitte
Saved
Features column charts and annotations emphasizing the growth in industry gross balances and systematic wallet growth.
Investment Analysis
Financial Services
The slide details the expansion in client financing for equities, highlighting significant increases and revenue gap bridging strategies.
equities, client financing, gross balances, systematic growth, revenue gap, market analysis, investment banking
Multiple Chart
Goldman Sachs
Saved
Column chart showing semiconductor investment projects and a pie chart of low-carbon mobility projects by country.
Market Analysis and Trends
Technology & Software
Highlights investments in semiconductors and low-carbon mobility in Europe, focusing on leading countries.
semiconductors, low-carbon, mobility, investment, Europe
Multiple Chart
EY
Saved
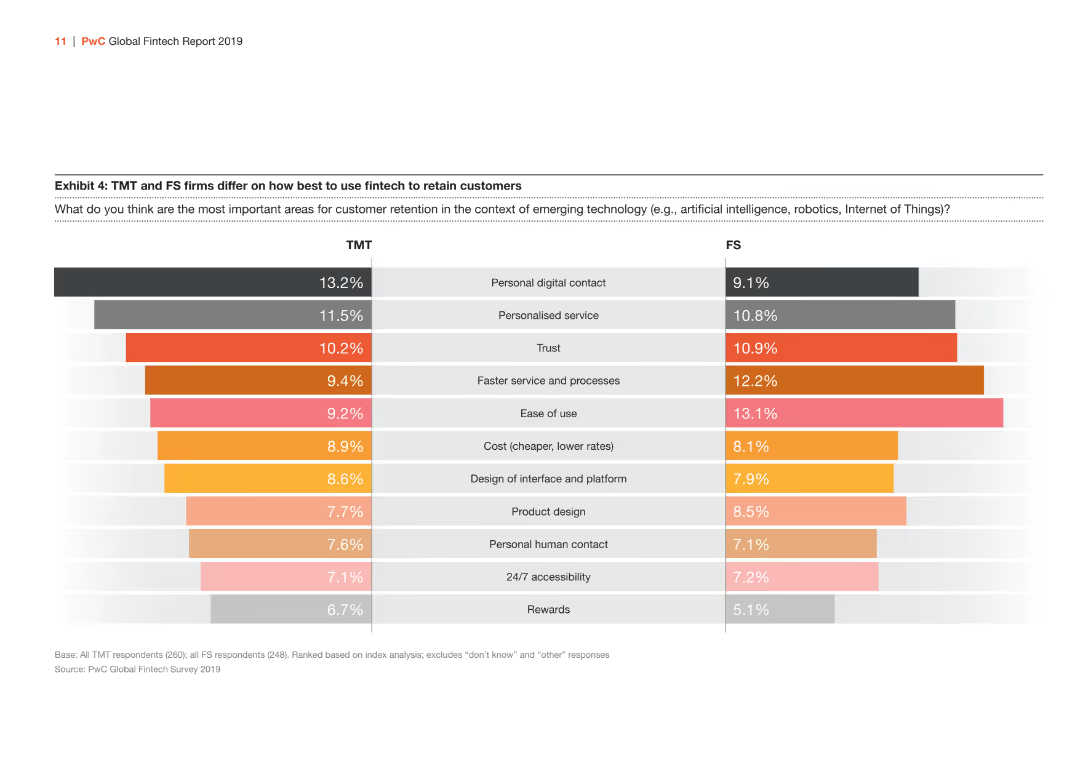
The slide features a bar chart comparing TMT and FS firms on important areas for customer retention through fintech. The bars are orange, red, and gray.
Market Analysis and Trends
Financial Services
Comparison of TMT and FS firms on the importance of various factors like personal digital contact, personalized service, and trust in retaining customers through fintech.
fintech, customer retention, TMT, FS, comparison
Multiple Chart
PwC/Strategy&
Saved
Presents a timeline with icons and process maps outlining the steps to identify SG&A improvement opportunities.
Operational Efficiency
Professional Services
Describes a fast-track approach to identifying and implementing cost-saving measures across an organization.
SG&A, cost-saving, operational, improvement, timeline
Diagram
Deloitte
Saved
Map and text slide providing an overview of A.T. Kearney’s global presence, client base, and team structure.
Industry Overview
Professional Services
Provides an overview of A.T. Kearney's global scale in consulting across various industries, functions, and geographies, with significant client and team details.
consulting, global, industries, clients, team
Graphic
Kearney
Saved
Previous
Next
If nothing, comes up, please save your slides first
Create a FREE account to continue browsing
Receive Instant Access to 1,000+ slides from companies like McKinsey, Google, and Goldman Sachs
First Name
Last Name
Email
Password
I agree to all
Terms & Privacy Policy
Thank you! Your submission has been received!
Oops! Something went wrong while submitting the form.
Have an account?
Sign in
Column Chart
Heatmap
Chevron
Org Chart
Infographic
Callouts
Timeline
List
Graphic
Picture
Process Flow
Diagram
Paragraph
Map
Table
Framework
Subtitle
Takeaway Box
Icon
Other Chart
Radar Chart
Waterfall Chart
Mekko Chart
Pie Chart
Scatter Plot
Line Chart
Bar chart
Bullet points