My Account
My Slides
Search by Category
Templates
Leave Feedback
Login
Logout
Get Started
Browse all Slides
Browse all Slides
Create a FREE Account
Instant access to 1,000+ real slides from top companies like McKinsey, BCG, Goldman Sachs, Google and many more!
First Name
Last Name
Email
Password
I agree to all
Terms & Privacy Policy
Thank you! Your submission has been received!
Oops! Something went wrong while submitting the form.
Have an account?
Sign in
Saved Slides
The slide contains a large title at the top, a significant central column chart detailing revenue from Canadian media spend, and a smaller red arrow chart highlighting a 4% gap.
Market Analysis and Trends
Media & Entertainment
This slide addresses the revenue missed by national brands in Canada due to media spending, quantifying the potential increase in sales.
media spend, revenue gap, sales increase, Canadian advertisers, optimization
Single Chart
Accenture
Saved
The slide includes a column chart comparing challenges in upskilling initiatives, with different colors representing the beginning and advanced stages of such programs.
Organizational Structure and Change
Professional Services
Discusses the initial challenges organizations face when starting upskilling programs, such as motivation, resource allocation, and employee retention.
Upskilling Challenges, Resource Allocation, Employee Retention, Skill Development
Single Chart
PwC/Strategy&
Saved
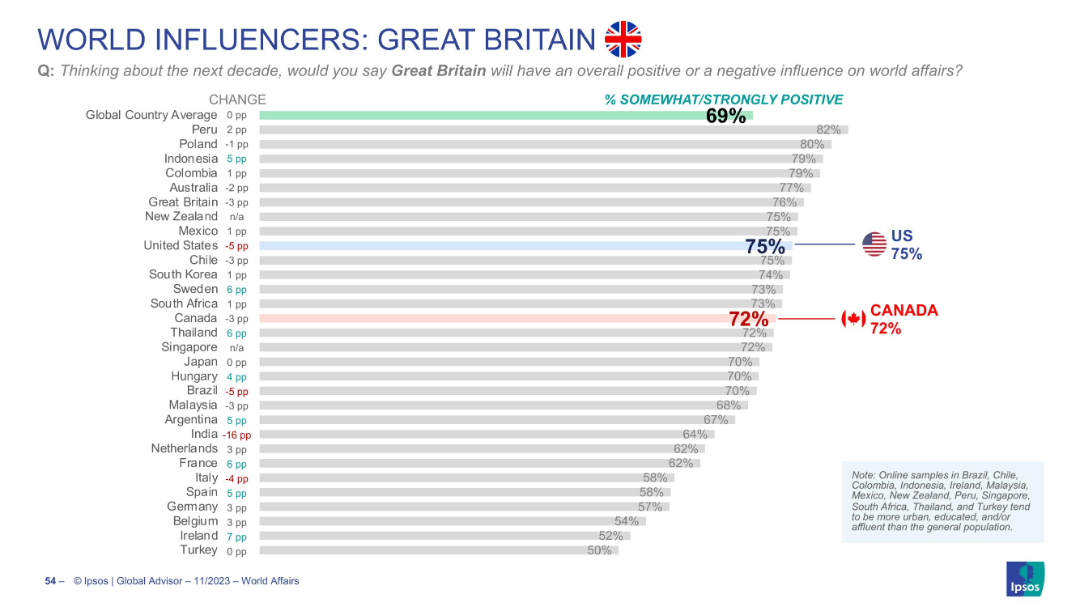
Horizontal bar chart showing international perceptions of the UK’s global influence
Market Analysis and Trends
Government & Public Sector
Surveys global sentiment toward Great Britain’s influence. The global average is 69%. Canada rates it 72%, U.S. at 75%. Results show small shifts in opinion across countries.
Great Britain, UK, global sentiment, Canada opinion, US opinion, Ipsos, bar chart, soft power, international views
Single Chart
IPSOS
Saved
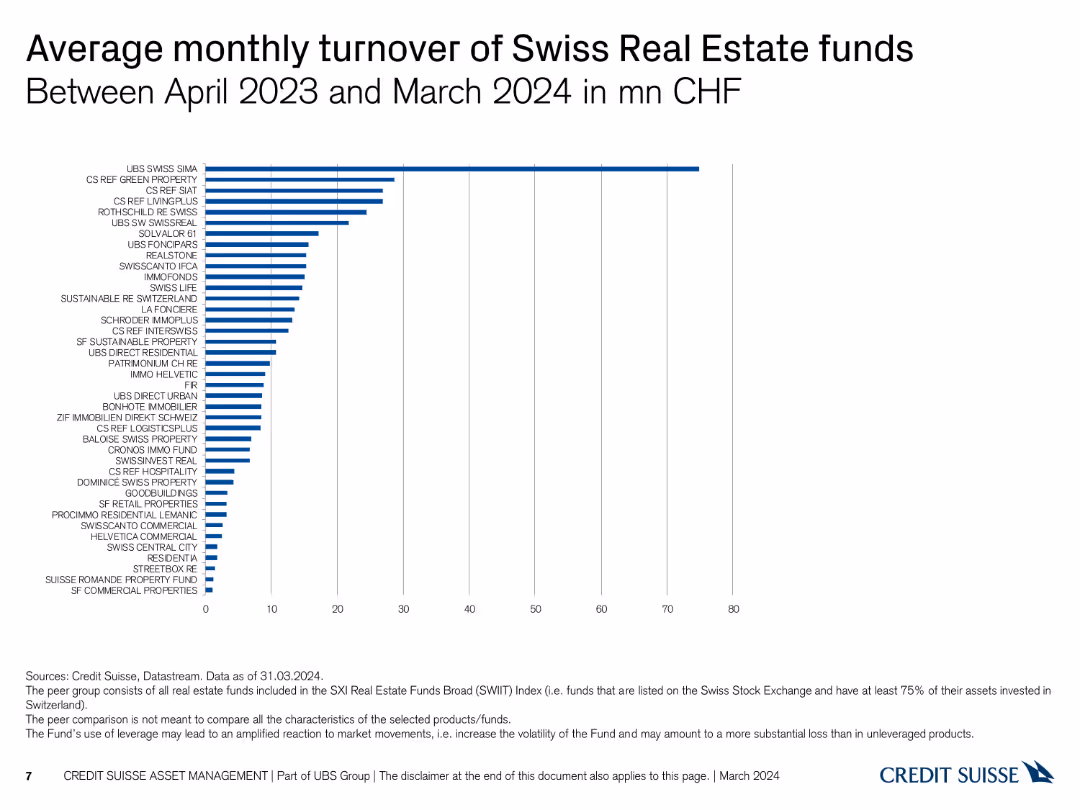
The slide displays a column chart illustrating the average monthly turnover in CHF for various Swiss Real Estate funds between April 2023 and March 2024, with bars in blue.
Financial Performance
Real Estate & Construction
This slide shows the average monthly turnover of different Swiss Real Estate funds, helping to analyze liquidity and fund performance over the specified period.
turnover, real estate, average, monthly, funds
Single Chart
Credit Suisse
Saved
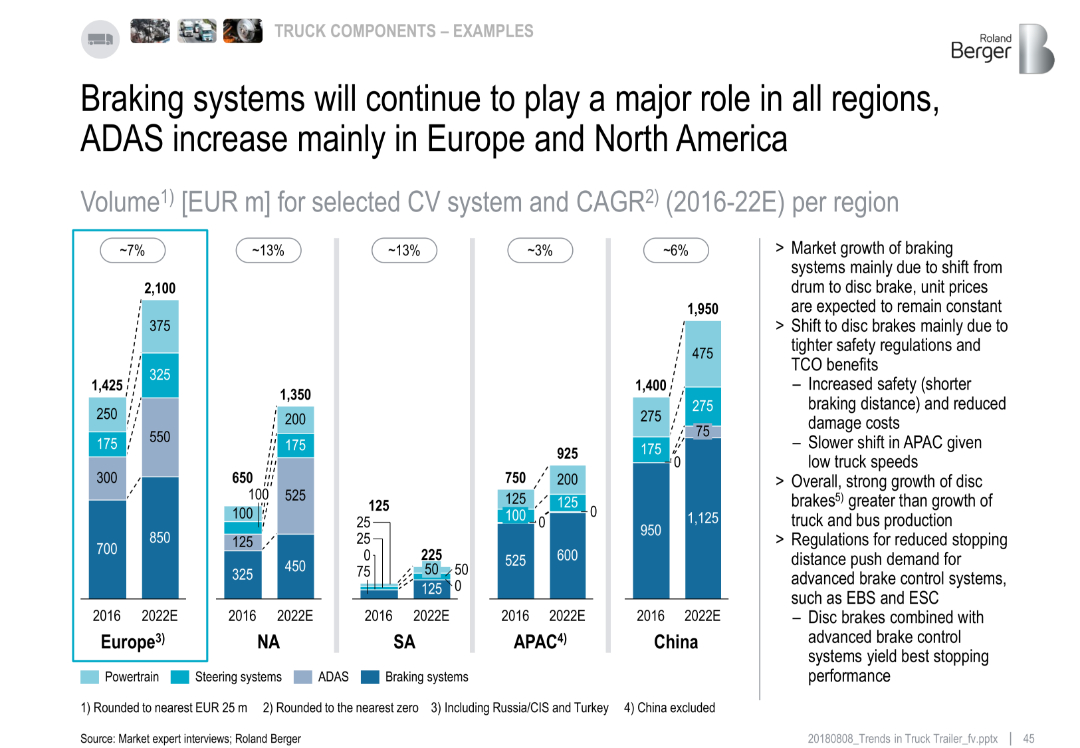
Stacked bar charts of CV system market volume by region (2016 vs. 2022E); text highlights drivers of brake market
Market Analysis and Trends
Industrial & Manufacturing
The slide emphasizes braking systems as the largest contributor across all regions. Europe and NA show major ADAS growth. The market shift from drum to disc brakes, due to regulations and safety, drives the increased demand. APAC shows the slowest transition.
braking, ADAS, disc brakes, market volume, regional trends, safety, 2022 forecast
Multiple Chart
Roland Berger
Saved
Diagrams and bullet points explain the consumer payment process, the management of funds by an eCommerce platform, and flexible payouts to merchants, alongside benefits listed at the bottom.
Operational Efficiency
Financial Services
Illustrates the end-to-end wholesale payment solutions and benefits for eCommerce platforms, emphasizing operational efficiency and treasury optimization, suitable for discussions on improving eCommerce payment systems.
eCommerce, Wholesale Payments, Treasury, Operational Efficiency, Payouts
Linear Flow
JP Morgan
Saved
Simplified flowchart with three main phases of change management: Installation, Realization, and Repeatability. Highlights key challenges at each stage with corresponding icons.
Organizational Structure and Change
Professional Services
Highlights the difficulties in achieving successful change management in organizations, focusing on the stages from strategy deployment to embedding new capabilities, and the common stalling points.
Change Management, Challenges, Organization, Strategy
Linear Flow
Kearney
Saved
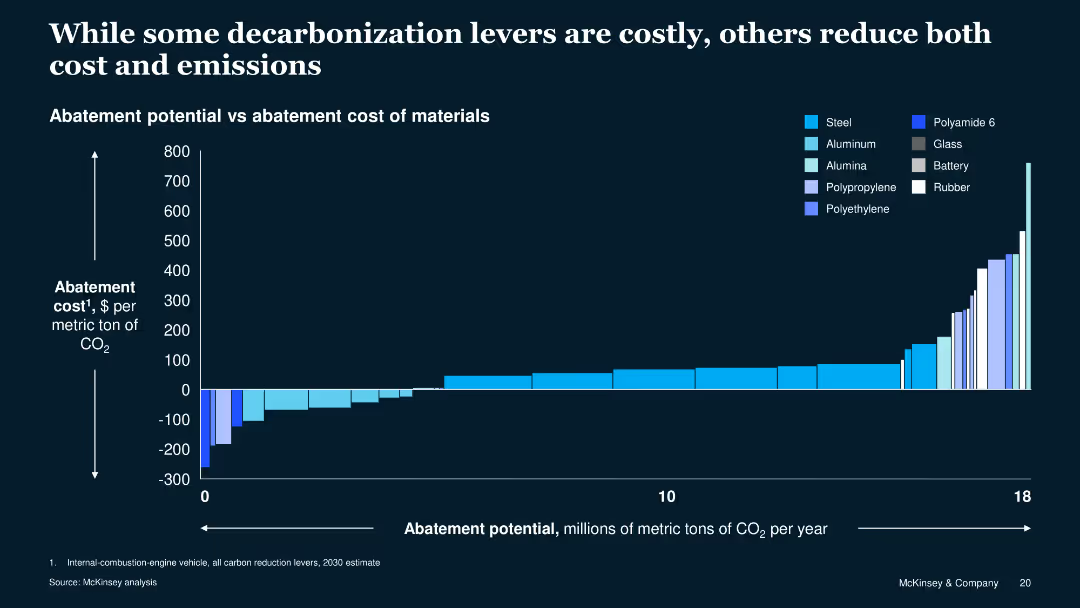
The slide includes a column chart showing abatement potential versus cost for various materials. The chart uses different shades of blue to represent different materials.
Operational Efficiency
Energy & Utilities
This slide compares the cost and potential CO2 reduction of various materials used in manufacturing, illustrating that some options can reduce both costs and emissions.
abatement, cost, emissions, materials, comparison, manufacturing, energy, efficiency, sustainability, decarbonization
Single Chart
McKinsey
Saved
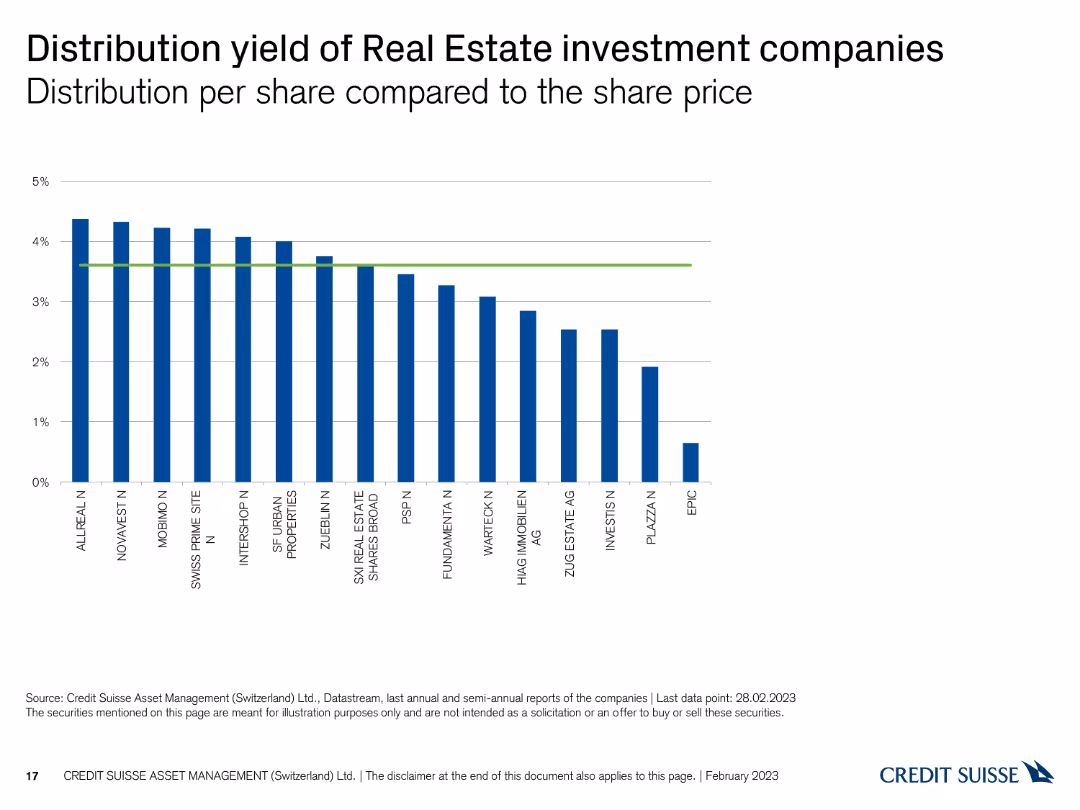
This slide displays a column chart showing the distribution yield per share for Swiss real estate investment companies, with vertical bars representing yield percentages and a green reference line.
Financial Performance
Real Estate & Construction
The slide presents the distribution yields of real estate investment companies, comparing their returns. It is used for evaluating income potential and investment performance.
Real estate, distribution yield, investment companies, returns, comparison
Single Chart
Credit Suisse
Saved
The slide shows a line graph of COVID-19 test results in Ontario, indicating the waves of the pandemic.
Risk Assessment and Management
Healthcare & Pharmaceuticals
It presents data on the fluctuating positive COVID-19 test results over time, highlighting key dates and events.
COVID-19, test results, waves, Ontario, line graph, pandemic, positive, data, key dates, events
Single Chart
IPSOS
Saved
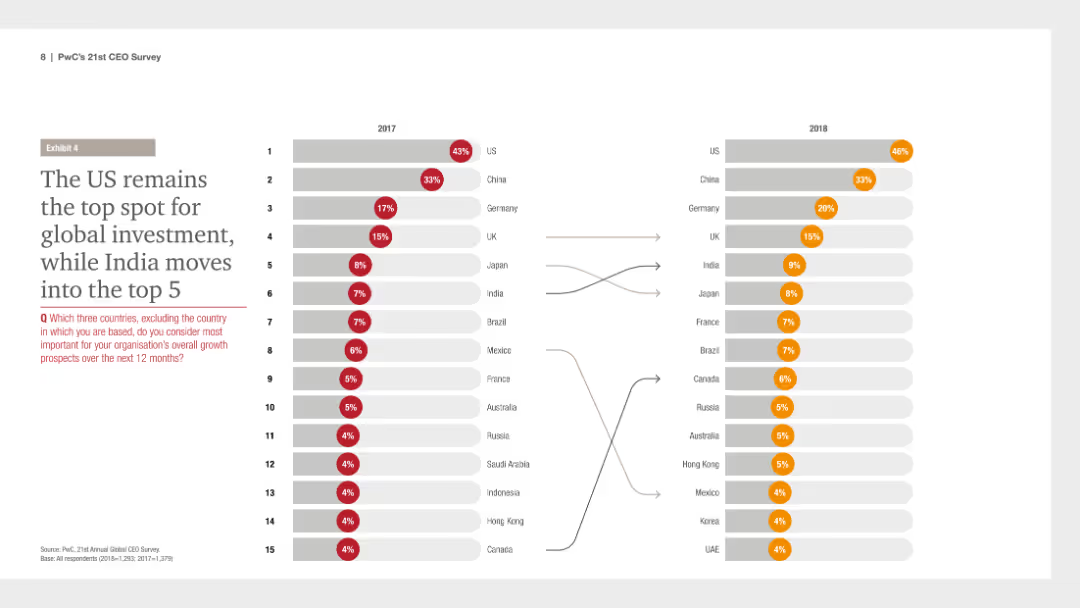
The slide features a column chart comparing the top countries for global investment in 2017 and 2018, with countries listed and color-coded to show changes in ranking.
Investment Analysis
Financial Services
It presents data showing that the US remains the top destination for global investment in 2018, with India entering the top 5, indicating shifts in global investment preferences.
global investment, US, India, top destinations, 2017 vs 2018, financial survey, PwC, CEO Survey, column chart
Multiple Chart
PwC/Strategy&
Saved
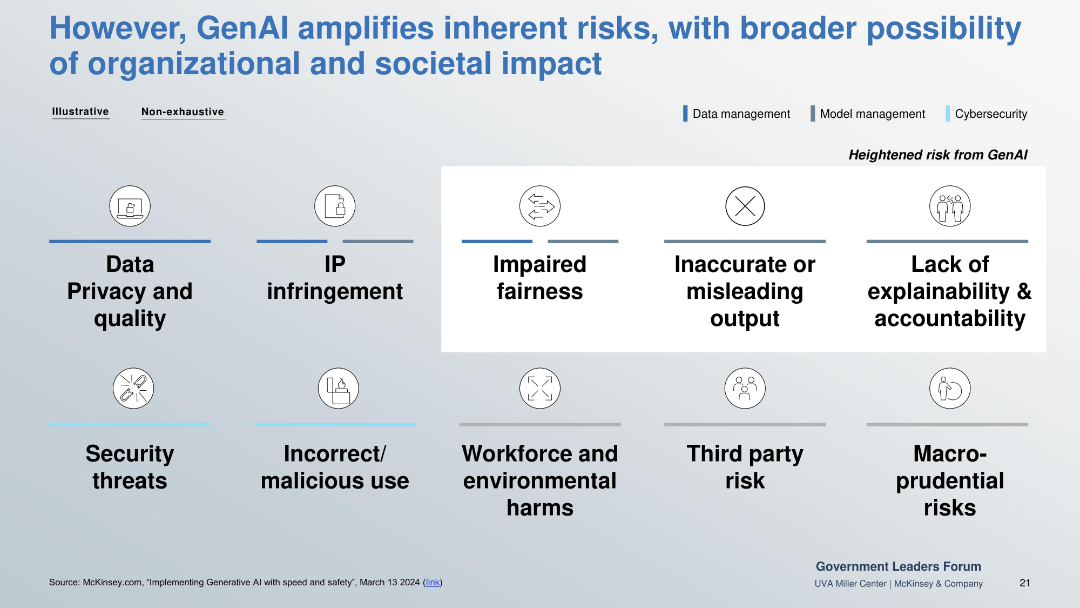
Grid layout of risks across three color-coded domains: data, model, and cybersecurity. Highlights central risks like fairness, accuracy, and explainability.
Risk Assessment and Management
Government & Public Sector
Identifies risks amplified by GenAI such as data privacy, IP infringement, fairness, inaccurate outputs, and malicious use. Emphasizes broader organizational and societal implications.
AI risk, explainability, fairness, cybersecurity, IP, privacy, malicious use
Table
McKinsey
Saved
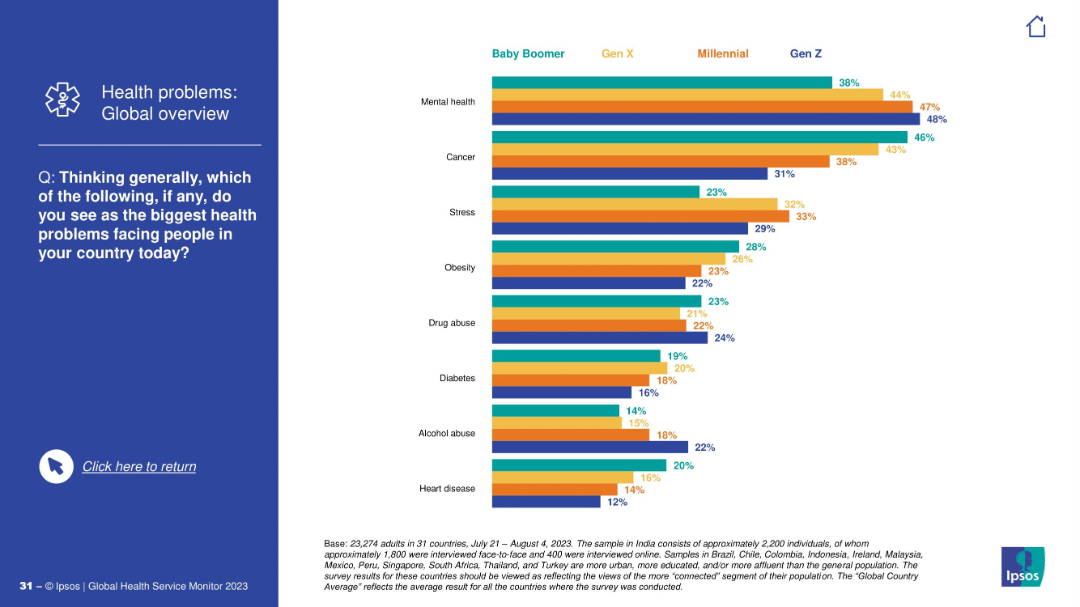
Multi-colored horizontal bar chart comparing generational views on health problems.
Market Analysis and Trends
Healthcare & Pharmaceuticals
This slide shows generational perspectives (Boomers to Gen Z) on health issues like mental health, cancer, stress, and obesity. Mental health tops concerns for younger generations, while cancer is more prominent among older cohorts.
generational trends, mental health, cancer, stress
Mixed Chart
IPSOS
Saved
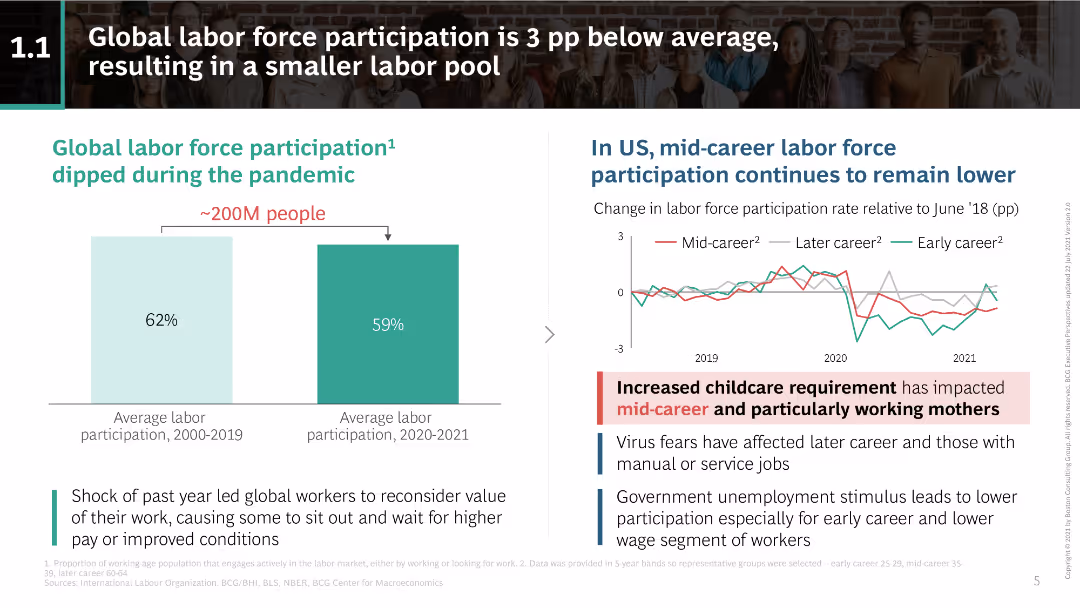
Column chart showing labor force participation pre and during pandemic; line chart displaying US mid-career labor force participation trends.
Market Analysis and Trends
Financial Services
Discusses the decline in global labor force participation during the pandemic and the continuous lower participation of mid-career workers in the US.
labor force participation, pandemic impact, US labor trends, mid-career workers, childcare requirement, virus fears, unemployment stimulus
Multiple Chart
BCG
Saved
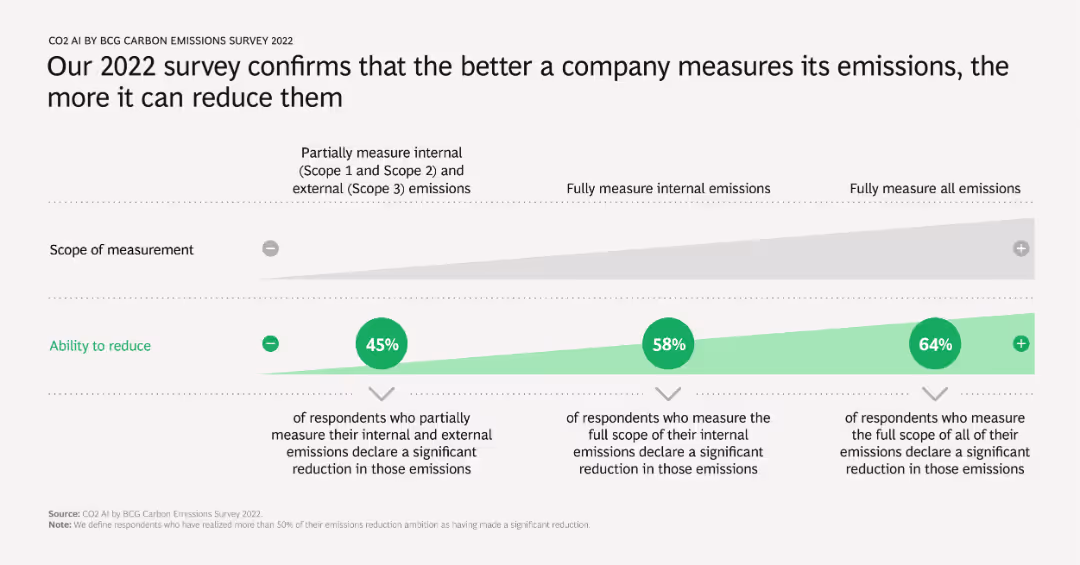
A column chart showing the correlation between the scope of emissions measurement and the ability to reduce emissions. It includes percentages of respondents who measure emissions to varying extents and their reported emission reductions.
Operational Efficiency
Environmental Services & Sustainability
Demonstrates that companies which comprehensively measure their emissions tend to achieve more significant reductions. Highlights the importance of thorough emissions tracking in achieving meaningful environmental impact.
emissions measurement, reduction, operational efficiency, scope, survey results
Table
BCG
Saved
A dark-themed slide split into two halves, one detailing businesses involved, the other outlining solutions provided by the firm, complemented by a client testimonial.
Mergers and Acquisitions
Financial Services
A case study slide showcasing how the firm’s integrated solutions across various departments contributed to a client's success story.
Case Study, Solutions, Wealth, Investment, Asset, Management, Client, Testimonial
Table
Goldman Sachs
Saved
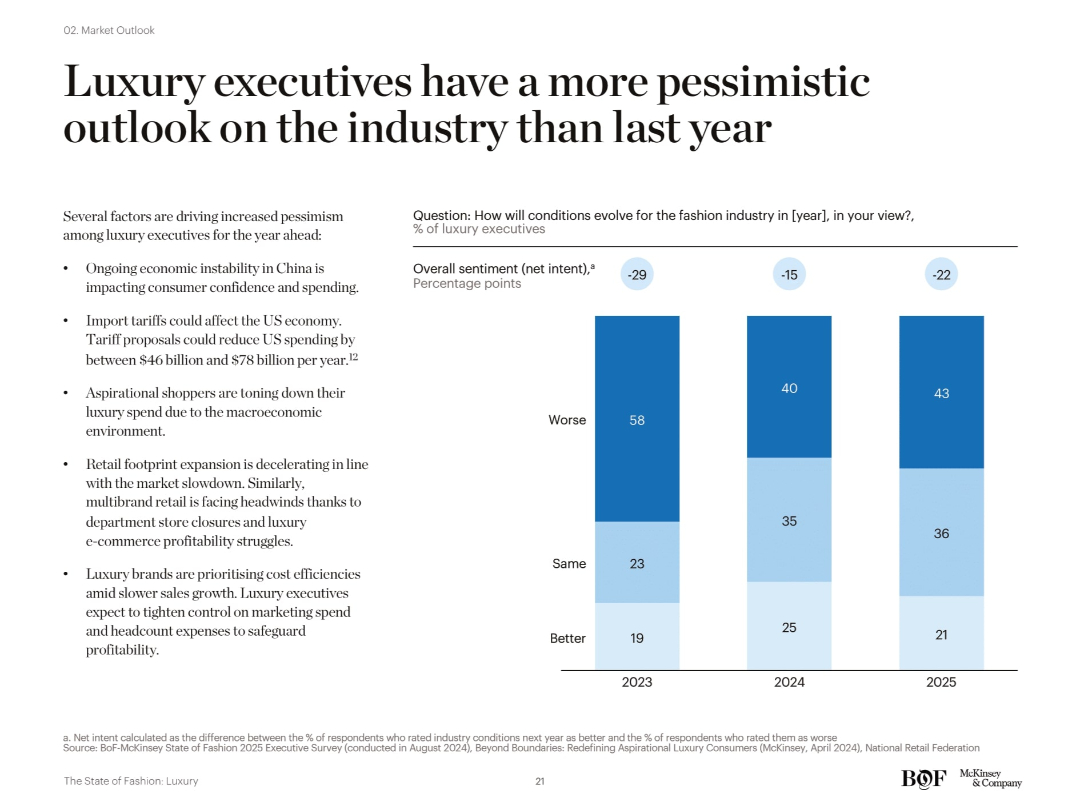
Bar chart showing net sentiment of luxury executives (better/same/worse) for 2023–2025. Accompanied by bullet points listing reasons for pessimism.
Strategic Planning
Consumer Goods
The slide illustrates declining optimism among luxury executives, with a majority expecting worse industry conditions in 2023–2025. Key concerns include macroeconomic headwinds, China’s instability, tariffs, and reduced spending from aspirational shoppers.
executive sentiment, pessimism, luxury outlook, 2024 forecast, tariffs, consumer behavior
Mixed Chart
McKinsey
Saved
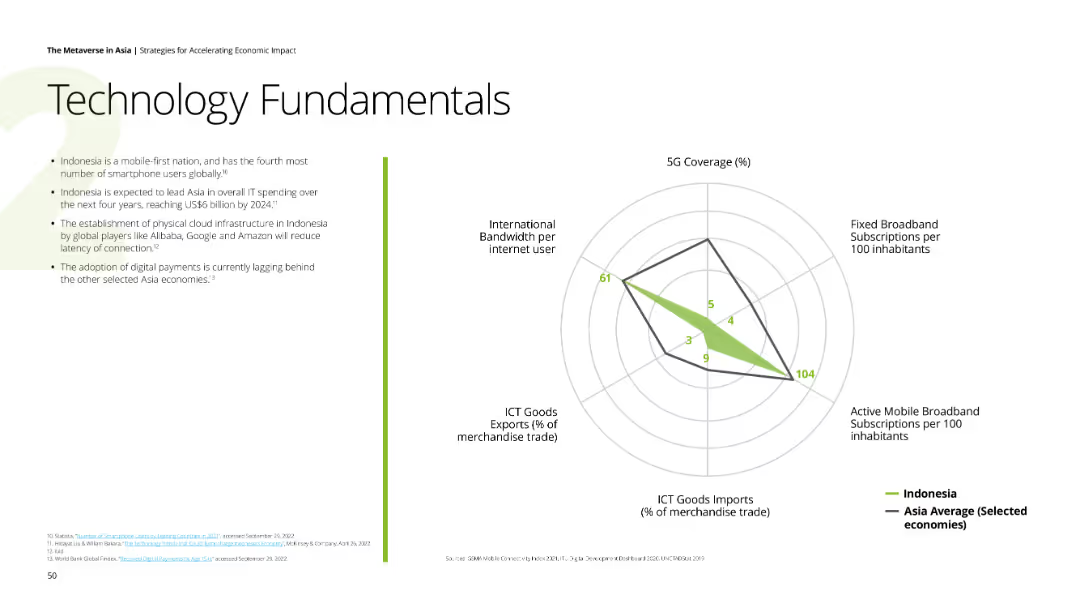
The slide contains a spider chart comparing 5G coverage, fixed broadband subscriptions, active mobile broadband subscriptions, ICT goods imports, and international bandwidth per internet user for Indonesia and Asia average. The background is white with text and charts.
Technology and Digital Transformation
Technology & Software
Discusses Indonesia's position in the ICT sector with a focus on mobile-first adoption, cloud infrastructure, digital payments, and IT spending.
Indonesia, 5G, ICT, mobile broadband, digital payments
Mixed Chart
Deloitte
Saved
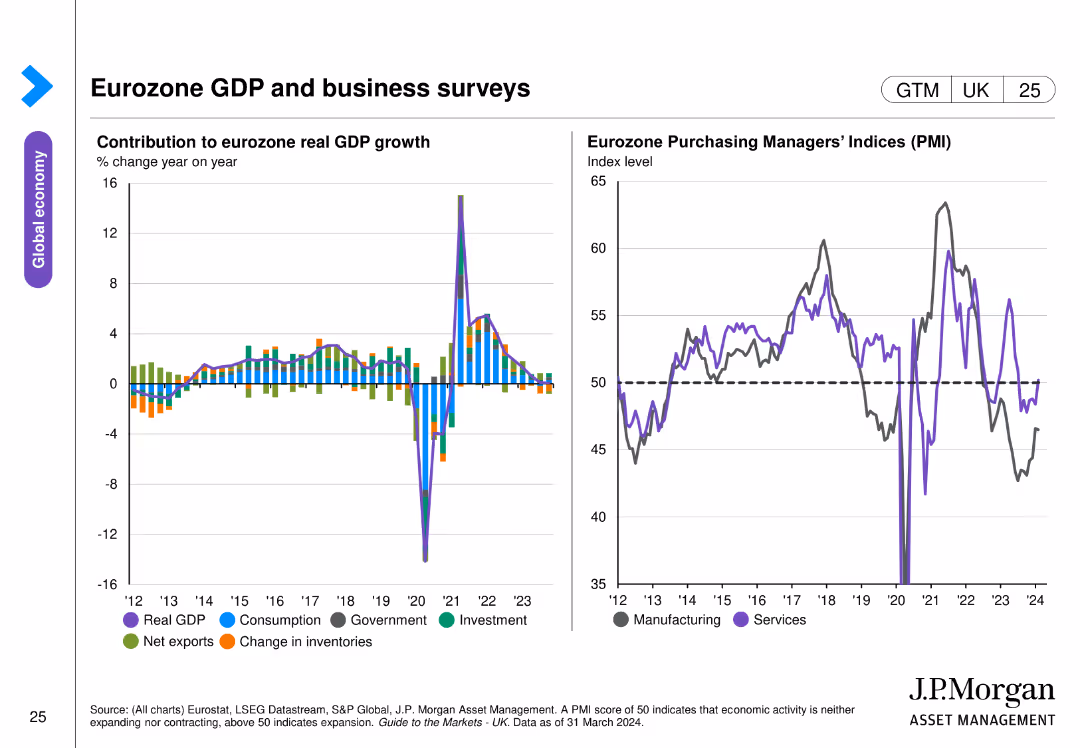
This slide contains two column charts. The left chart presents the contribution to eurozone real GDP growth by different sectors. The right chart shows Eurozone Purchasing Managers' Indices (PMI) over time. The charts are detailed and use various colors to distinguish data categories.
Market Analysis and Trends
Financial Services
The slide analyzes the eurozone's GDP growth and business activity through sector contributions and PMI trends, essential for economic analysis and business strategy.
eurozone GDP, business surveys, PMI, sector growth, economic analysis
Multiple Chart
JP Morgan
Saved
A world map marked with various investment locations, accompanied by logos representing different sectors such as private equity and real estate.
Investment Analysis
Financial Services
Elucidates on the diversity and scope of the company's alternative investment platform, indicating different sectors and regions involved in the investment strategy.
Alternative investments, private equity, real estate, global
Graphic
Goldman Sachs
Saved
Contains column charts detailing JP Morgan's market share by product and sector from 2017 to 2021, alongside strategic pillars for business growth.
Strategic Planning
Financial Services
Analyzes JP Morgan's market share strategy by product and sector, emphasizing their leadership and strategic positioning. The slide discusses four key strategic pillars focused on industry specialization, digital platforms, and regional coverage, aiming to enhance market presence and client service in diverse sectors.
market share, strategy, growth, sector
Multiple Chart
JP Morgan
Saved
Presents a column chart illustrating the podcast ad revenue percentage share by content genre between 2021 and 2022. Each genre is represented by a pair of bars for each year, with detailed annotations. The slide background and bar colors enhance readability.
Market Analysis and Trends
Media & Entertainment
Examines shifts in revenue generation across different podcast genres, noting a decrease in news content and increase in entertainment genres. Useful for content creators and advertisers to strategize genre-focused marketing efforts.
Content Genres, Revenue Share, Podcasting, Market Trends, Advertising
Mixed Chart
PwC/Strategy&
Saved
Displays a dual-axis column chart tracking client numbers and a bar chart reflecting a finance portfolio. The slide uses contrasting colors to distinguish different segments and time periods. Annotations and titles are neatly organized for legibility.
Market Analysis and Trends
Financial Services
This slide depicts the growth in client base for Commodities and Global Markets and details the Specialised and Asset Finance portfolio, useful for trend analysis and customer base evaluation in financial services.
client growth, commodities, finance, portfolio, trend analysis, financial services, asset finance, market analysis
Multiple Chart
Goldman Sachs
Saved
The slide features bullet points under the headers "ECONOMIC VIEWS FOR 2022" and "THEMATIC VIEWS FOR 2022 AND BEYOND." The text is black on a white background with a blue header. Each column contains points of analysis regarding economic forecasts and trends.
Market Analysis and Trends
Financial Services
The slide presents economic forecasts for the year 2022, discussing the expected slowdown in GDP growth and the potential performance of US Treasuries. It also highlights thematic investment opportunities, focusing on long-term market leaders, digitalization, Asian development, and central bank policies. The content is tailored for financial professionals and investors seeking to understand the upcoming economic landscape and strategic investment areas.
economic forecast, GDP, inflation, EPS, digitalization, Asian development, longevity, central bank policies
Header Horizontal
Citigroup
Saved
The slide includes a column chart illustrating the transition to renewable energy on farms and electric vehicles. It provides detailed descriptions of included actions and example initiatives.
Technology and Digital Transformation
Agriculture & Food Production
This slide outlines the transition to renewable energy and electric vehicles in agriculture. It highlights the adoption of renewable energy on farms, the transition to electric vehicles, and their impact on emissions reduction and cost savings.
Renewable energy, Electric vehicles, Agriculture, Emissions, Cost savings
Mixed Chart
EY
Saved
Previous
Next
If nothing, comes up, please save your slides first
Create a FREE account to continue browsing
Receive Instant Access to 1,000+ slides from companies like McKinsey, Google, and Goldman Sachs
First Name
Last Name
Email
Password
I agree to all
Terms & Privacy Policy
Thank you! Your submission has been received!
Oops! Something went wrong while submitting the form.
Have an account?
Sign in
Column Chart
Heatmap
Chevron
Org Chart
Infographic
Callouts
Timeline
List
Graphic
Picture
Process Flow
Diagram
Paragraph
Map
Table
Framework
Subtitle
Takeaway Box
Icon
Other Chart
Radar Chart
Waterfall Chart
Mekko Chart
Pie Chart
Scatter Plot
Line Chart
Bar chart
Bullet points