My Account
My Slides
Search by Category
Templates
Leave Feedback
Login
Logout
Get Started
Browse all Slides
Browse all Slides
Create a FREE Account
Instant access to 1,000+ real slides from top companies like McKinsey, BCG, Goldman Sachs, Google and many more!
First Name
Last Name
Email
Password
I agree to all
Terms & Privacy Policy
Thank you! Your submission has been received!
Oops! Something went wrong while submitting the form.
Have an account?
Sign in
Saved Slides
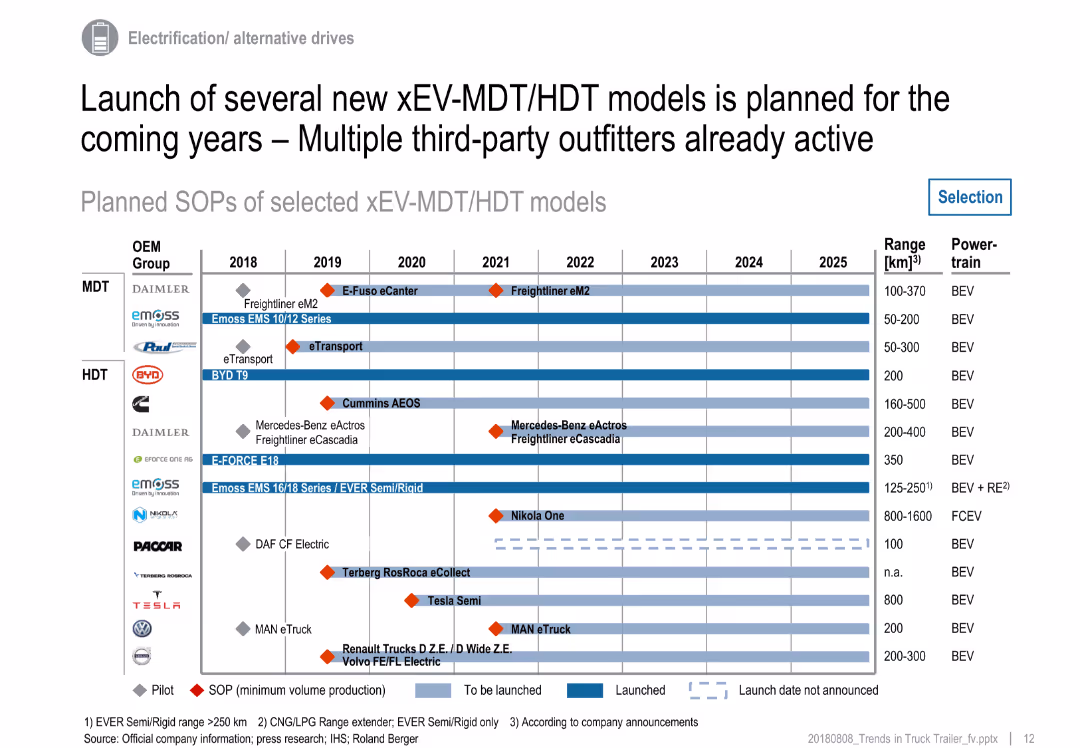
Gantt-style chart with horizontal bars across years (2018–2025) showing truck model launches; includes legend and vehicle details
Product and Service Analysis
Transportation & Logistics
This slide presents a timeline of electric medium and heavy-duty truck model launches by major OEMs. It includes BEV, FCEV, and hybrid variants with SOPs, pilot phases, and announced projects. It highlights industry readiness and growing diversity in powertrain technology.
electric trucks, OEMs, xEV, model launch, timeline, MDT, HDT, SOP, BEV, powertrain
Single Chart
Roland Berger
Saved
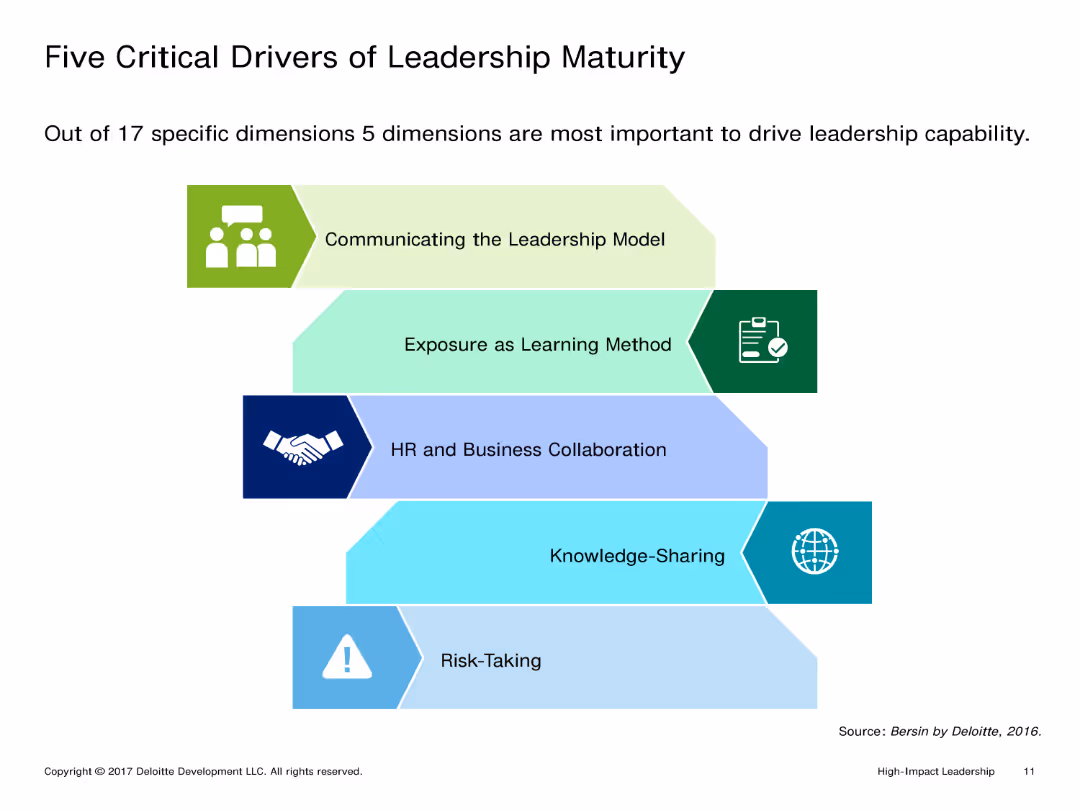
Single-column layout with text at the top and a diagram illustrating five critical drivers of leadership maturity below. Text is concise.
Market Analysis and Trends
Professional Services
Identifies and explains five key dimensions crucial for driving leadership capability: communicating the leadership model, exposure as a learning method, HR collaboration, knowledge-sharing, and risk-taking.
Leadership maturity, Critical drivers, Communication, Learning exposure, HR collaboration, Knowledge-sharing, Risk-taking
Vertical Flow
Deloitte
Saved
The slide presents a table with credit loss expenses and a column chart showing ECL coverage ratios. It uses a structured layout with clear data segmentation.
Financial Performance
Financial Services
It details credit loss expenses and impaired exposures, providing figures by business segment and the evolution of ECL coverage ratios over time.
credit loss, expenses, impaired, ECL, ratios, exposures, UBS, 2Q23, financial, release
Mixed Chart
UBS
Saved
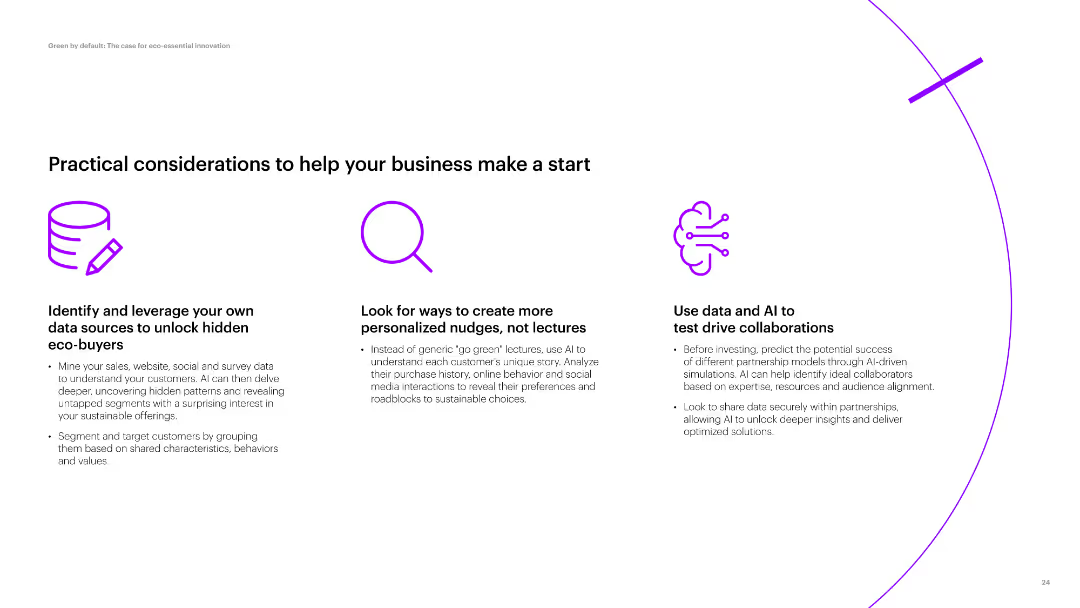
The slide has three main sections, each with an icon and descriptive text, suggesting practical steps for businesses to start with sustainability initiatives.
Operational Efficiency
Technology & Software
This slide provides practical tips for businesses to start sustainability efforts, such as leveraging data sources, creating personalized nudges, and using AI.
Practical tips, sustainability, business start, data sources, personalized nudges, AI, collaboration, operational efficiency, business strategy
Pillar
Accenture
Saved
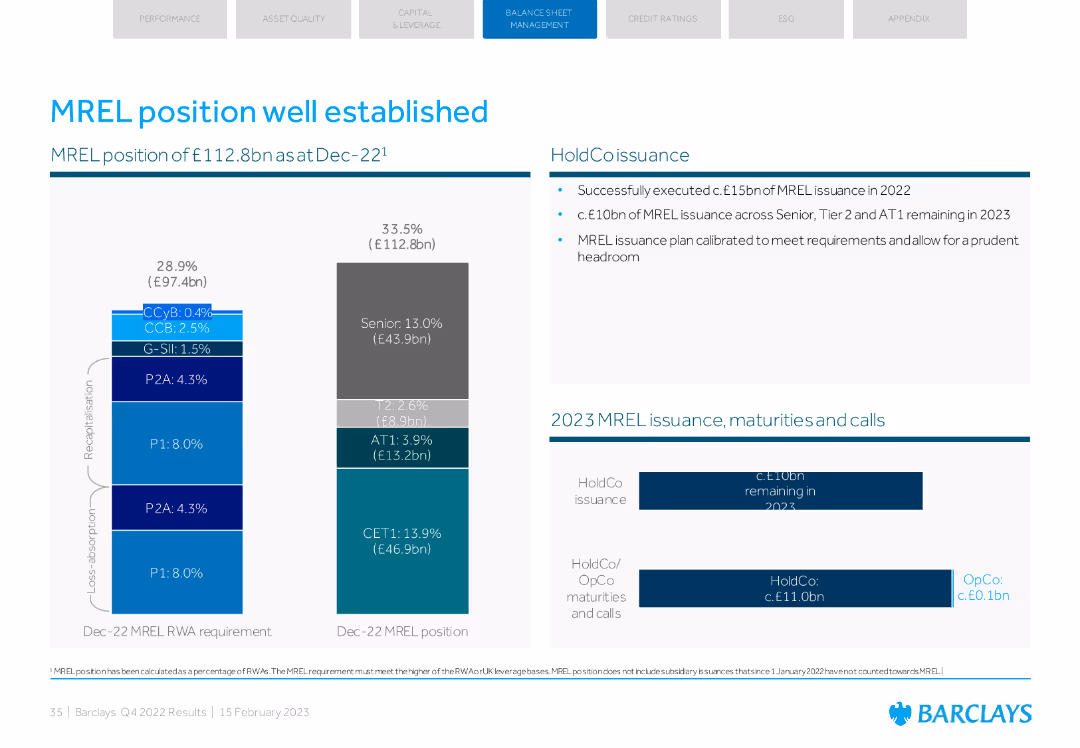
Column charts showing MREL RWA requirement and MREL position, along with text on issuance and maturities.
Risk Assessment and Management
Financial Services
Explains the MREL position and requirements, including the issuance plan for 2023. Highlights senior, Tier 2, and AT1 components.
MREL, position, issuance, Tier 2, AT1
Multiple Chart
Barclays
Saved
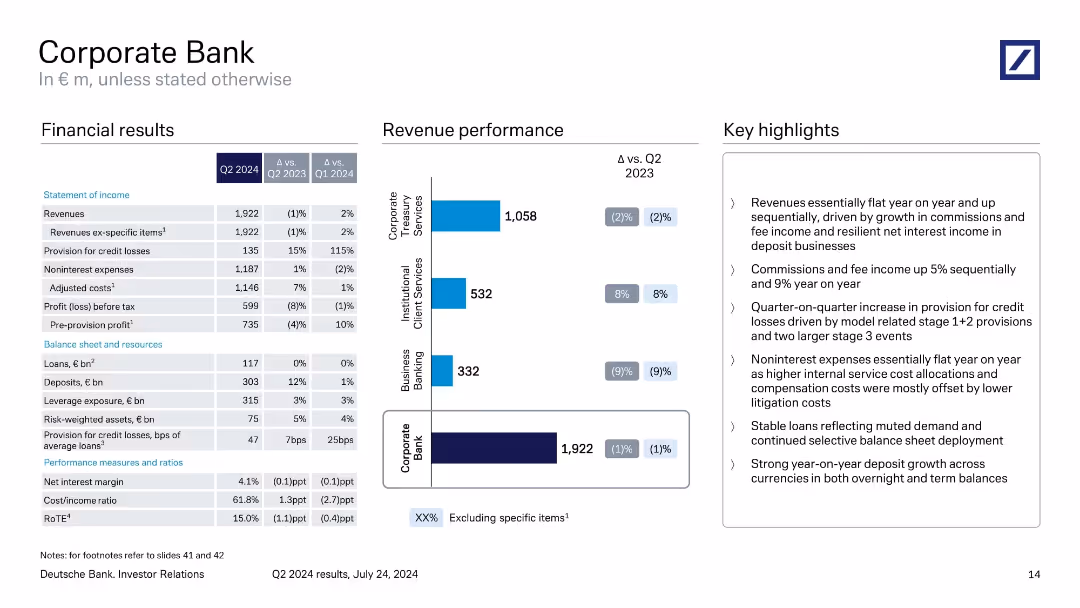
Three-column layout with financial table, revenue bar chart, and key highlights.
Product and Service Analysis
Financial Services
Reviews Q2 2024 performance of the Corporate Bank division. Highlights include flat revenue, rising provisions for credit losses, steady expenses, and growth in deposits. Segment-level revenue performance for treasury, institutional, and business banking is visualized.
Corporate Bank, Q2 2024, revenue, credit losses, business banking, Deutsche Bank
Mixed Chart
Deutsche Bank
Saved
This slide displays two column charts representing the Return on Capital Employed (ROCE) and Gearing percentages over several years, along with future targets.
Operational Efficiency
Financial Services
Designed for strategic planning, it shows past performance and future targets in capital efficiency and financial leverage.
Strategic Targets, ROCE, Gearing, Performance, Efficiency, Finance, Goals, Capital, Leverage
Multiple Chart
Goldman Sachs
Saved
An image of ADNOC’s Al Reyadah facility with accompanying descriptive captions.
Client Case Studies
Industrial & Manufacturing
Describes ADNOC's Al Reyadah facility as a self-sustaining CCUS project in the iron & steel industry.
CCUS, ADNOC, Al Reyadah, iron, steel, self-sustaining
Linear Flow
Kearney
Saved
The slide lists characteristics of an attractive business model, with each characteristic accompanied by an icon. The characteristics include real price growth, resilience, price insensitivity, long-term revenue visibility, barriers to entry, negative working capital, and high ROI.
Strategic Planning
Education & Training
This slide outlines key characteristics of an attractive business model in the education sector, highlighting factors such as resilience, long-term revenue visibility, high ROI, and barriers to entry, providing insights into the elements that make education a profitable market.
business model, education, profitability, revenue, resilience
Diagram
LEK
Saved
Presents a balanced text and image slide highlighting investor attitudes towards ESG priorities within companies. Uses iconography and a focused layout for the effective presentation of information.
Regulatory and Compliance
Financial Services
Explores the decreasing focus of investors on ESG agendas in favor of financial health, relevant for discussions on corporate governance and sustainable investing strategies.
ESG, Financial Health, Investor Focus, Corporate Governance, Sustainable Investing, Risk Management, Environmental Policy, Social Responsibility, Governance Standards, Long-term Strategy
Text Only
BCG
Saved
Contains two pie charts comparing GDP percentage and market capitalization across countries, indicating the distribution of global equity allocations.
Investment Analysis
Financial Services
Highlights the disproportionate allocation of global equity towards the U.S., illustrated by its GDP versus market capitalization share, significant for strategic investment planning.
equity allocation, GDP, market capitalization, strategic planning, investment, USA dominance, global distribution
Multiple Chart
Morgan Stanley
Saved
The slide shows a balance sheet summary with column chart for assets and liabilities, emphasizing different categories with color coding. Key highlights offer insights into the balance sheet management strategies.
Operational Efficiency
Financial Services
This slide outlines the structure of a conservatively managed balance sheet, highlighting key asset and liability segments and their implications for financial stability and growth strategies. It underscores the importance of conservative financial management practices.
balance sheet, assets, liabilities, financial, management
Multiple Chart
Deutsche Bank
Saved
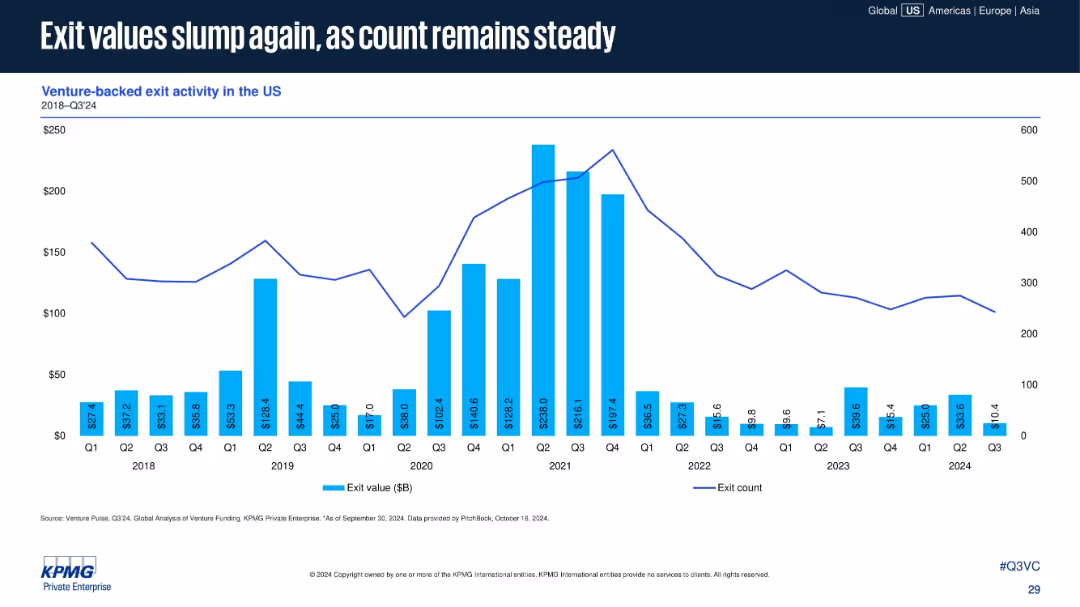
Bar-line combo chart of exit values and counts from 2018 to Q3 2024. Blue bars for value and a line for exit count.
Financial Performance
Financial Services
Exit values for venture-backed companies in the U.S. continue to decline into 2024, while the number of exits remains relatively steady. This signals reduced market valuations but persistent M&A or IPO activity.
exit value, venture-backed exits, IPO, M&A, exit count, market downturn, US exits, 2024 trends
Single Chart
KPMG
Saved
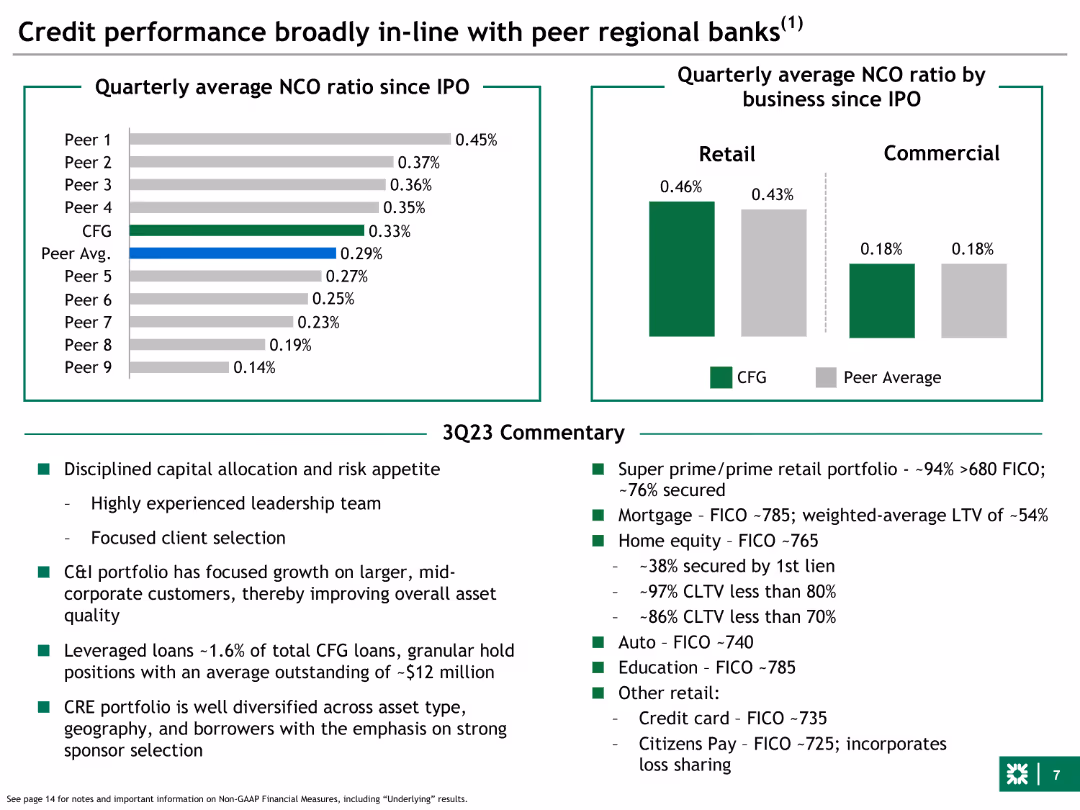
Two sets of bar charts: left side shows quarterly average NCO ratios since IPO; right side compares NCO ratios by business segment (retail and commercial) for Citizens and peers.
Financial Performance
Financial Services
Reviews credit performance of Citizens compared to peer regional banks, highlighting non-performing loan ratios and overall credit quality, segmented by retail and commercial sectors.
credit, performance, Citizens, regional banks, NCO, ratios, business segments, retail, commercial
Multiple Chart
Goldman Sachs
Saved
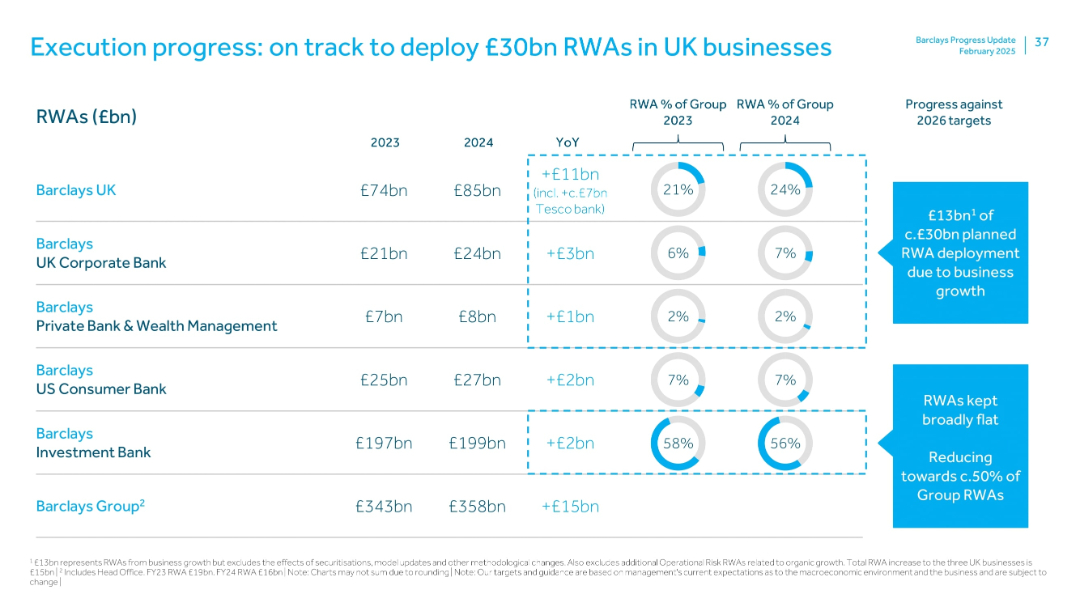
Data table listing RWA growth by Barclays business lines from 2023 to 2024, with accompanying YoY changes, group % shares, and visual callouts of key drivers.
Operational Efficiency
Financial Services
This slide shows progress in planned RWA deployment, with £13bn attributed to business growth. Barclays UK led growth with an £11bn increase. Visual cues show alignment with the 2026 strategy and aim to reduce Investment Bank’s RWA share.
RWAs, business growth, Tesco Bank, UK business, operational progress
Mixed Chart
Barclays
Saved
The slide includes a Venn diagram showing three overlapping areas: Desirability, Feasibility, and Viability, with a central section labeled "EY-P digital distribution framework analysis." Surrounding the diagram are key points related to strategic rationale, top-bottom implications, and practical aspects.
Strategic Planning
Financial Services
The slide presents the EY-Parthenon strategy framework for ensuring that the tokenization concept aligns with market needs, is financially viable, and can be executed practically, highlighting strategic rationale, cost implications, and practical aspects of distribution options.
strategy, framework, analysis, tokenization, feasibility, viability
Framework
EY
Saved
This slide includes a pie chart and a checklist. The pie chart illustrates the composition of total deposits, and the checklist outlines the characteristics of the deposits. The slide is clear and informative with a straightforward presentation of data.
Operational Efficiency
Financial Services
It breaks down the firm's deposit base, showing diversification and insurance coverage. With details on deposit types and insurance, it could be used for presentations on financial stability and deposit strategies.
Deposits, Diversification, FDIC Insured, Funding Liabilities, Deposit Composition
Mixed Chart
Goldman Sachs
Saved
Column charts comparing YTD financial results with previous years, highlighted with key financial metrics.
Financial Performance
Financial Services
Summarizes Deutsche Bank's YTD financial performance for 2023, including pre-provision profit and risk management statistics.
financial performance, YTD results, banking, revenue growth, risk management
Mixed Chart
Deutsche Bank
Saved
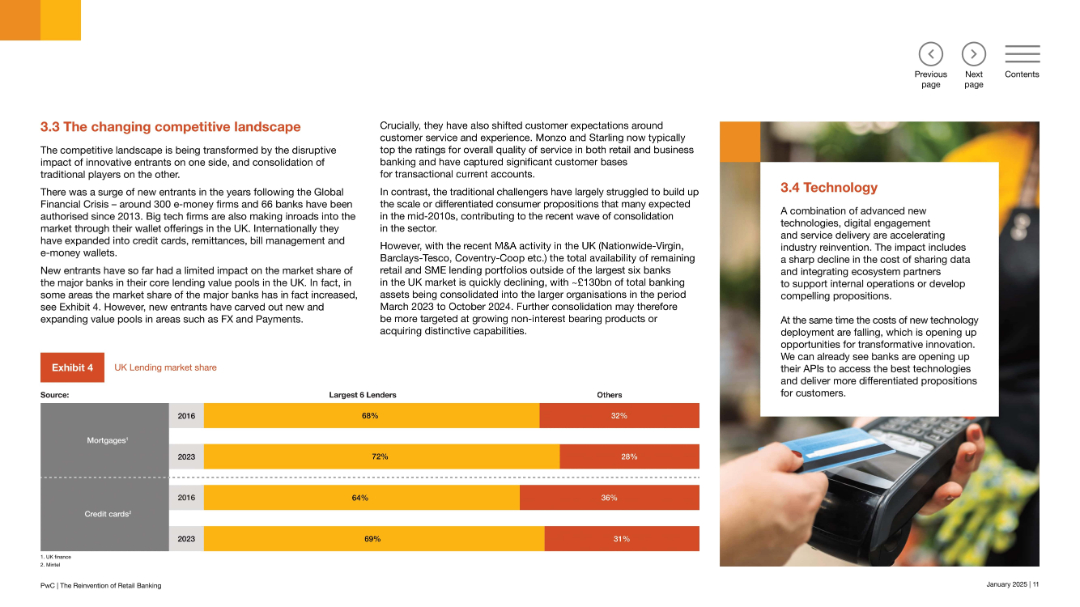
Three-column layout, text-heavy with an orange bar chart labeled “Exhibit 4” showing market share data.
Competitive Landscape
Financial Services
This slide covers the transformation of the banking competitive landscape driven by fintech entrants and M&A activity. It highlights how traditional banks maintain lending share but face disruption in areas like FX and payments. M&A trends among UK banks are noted.
market share, fintech, banking disruption, lending, consolidation, challenger banks, FX, M&A
Mixed Chart
PwC/Strategy&
Saved
Column chart showing CO2 emission differences by economic sector under baseline and LCE scenarios.
Market Analysis and Trends
Environmental Services & Sustainability
Compares CO2 emissions under different scenarios, highlighting the impact of LCE and LCE+ policies on emission reductions.
CO2 emissions, scenarios, comparison, LCE, LCE+
Mixed Chart
EY
Saved
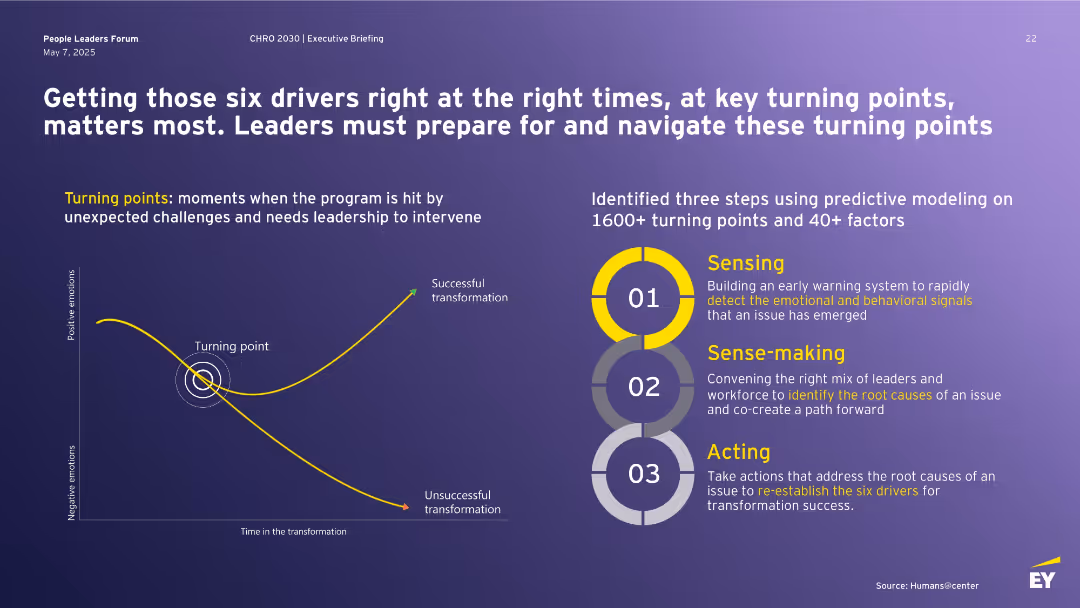
Dark background with bold white heading at top, yellow-highlighted keywords, chart on left showing turning point curve, and three-step circular graphic on right.
Strategic Planning
Professional Services
The slide emphasizes the importance of timing in leadership interventions during transformation initiatives. It introduces the concept of “turning points” and outlines a three-step model—Sensing, Sense-making, Acting—based on data analysis of over 1,600 cases. The aim is to guide leaders through critical transformation junctures.
transformation, leadership, turning point, predictive modeling, intervention, success, emotional signals, root cause, business change
Mixed Chart
EY
Saved
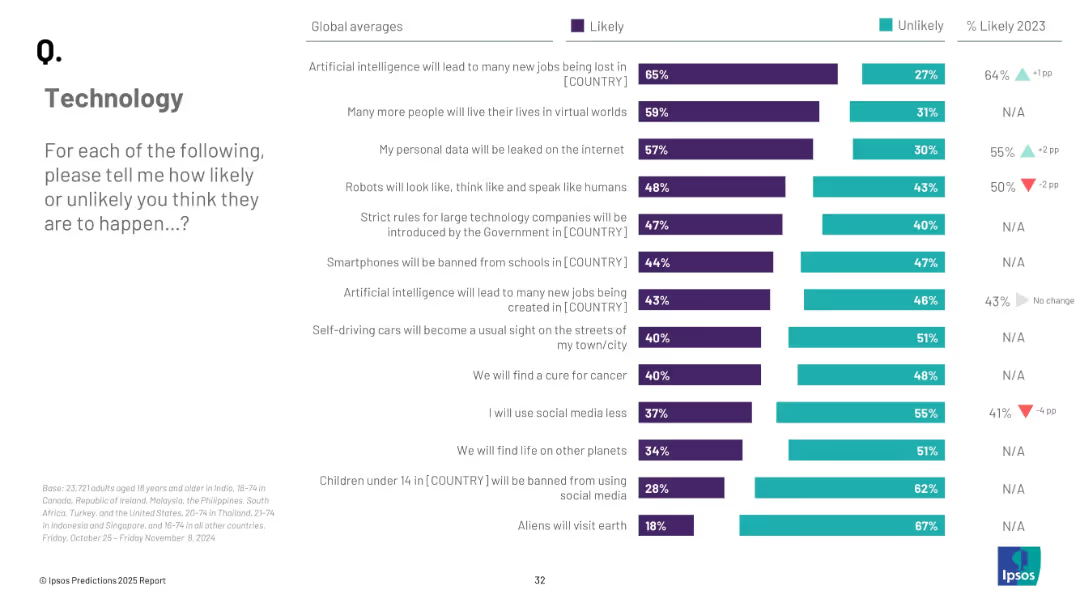
Vertical bar chart with purple (“likely”) and teal (“unlikely”) indicators showing global sentiment on 13 tech-related predictions.
Strategic Planning
Technology & Software
This global view slide presents public perceptions on technological advancements, such as AI’s impact on jobs, virtual worlds, and self-driving cars. It illustrates which innovations the global public believes are most likely to occur in 2025, with AI job loss and virtual living scoring highest in perceived likelihood.
technology, AI, virtual worlds, future predictions, innovation
Mixed Chart
IPSOS
Saved
Horizontal bar graph showing % concerned by country; countries sorted top to bottom; past year comparison included.
Market Analysis and Trends
Environmental Services & Sustainability
Reveals national concern levels about climate change impacts already occurring. Philippines, South Africa, and Indonesia rank highest in concern, while Switzerland and Sweden show lower levels.
public concern, domestic climate effects, country ranking, Ipsos, perception tracking, environmental anxiety
Mixed Chart
IPSOS
Saved
Column chart showing the planned rundown of risk-weighted assets over several years with a target for significant reduction.
Strategic Planning
Financial Services
Illustrates the reduction in risk-weighted assets excluding operational risk, outlining the approach for cost reduction and capital release.
rundown, risk-weighted, assets, cost, capital
Mixed Chart
UBS
Saved
This slide is organized with two major sections: one highlighting a line graph on global luxury market trends, and another detailing new purchasing channels and consumer behavior. The visual elements are balanced between text, icons, and the graph to maintain viewer engagement.
Market Analysis and Trends
Consumer Goods
Covers the adaptation of the luxury market to changing consumer preferences during COVID-19, such as the increase in online sales and new digital engagement methods. It also highlights the expected recovery in the market with strategic insights into new revenue models and purchase behaviors post-pandemic.
luxury market, digital transformation, COVID-19, consumer behavior, online sales, market recovery, innovative strategies
Mixed Chart
BCG
Saved
Previous
Next
If nothing, comes up, please save your slides first
Create a FREE account to continue browsing
Receive Instant Access to 1,000+ slides from companies like McKinsey, Google, and Goldman Sachs
First Name
Last Name
Email
Password
I agree to all
Terms & Privacy Policy
Thank you! Your submission has been received!
Oops! Something went wrong while submitting the form.
Have an account?
Sign in
Column Chart
Heatmap
Chevron
Org Chart
Infographic
Callouts
Timeline
List
Graphic
Picture
Process Flow
Diagram
Paragraph
Map
Table
Framework
Subtitle
Takeaway Box
Icon
Other Chart
Radar Chart
Waterfall Chart
Mekko Chart
Pie Chart
Scatter Plot
Line Chart
Bar chart
Bullet points


![How concerned are you...about climate change in [COUNTRY]](https://cdn.prod.website-files.com/654e70fb59937215cac87b19/6899c23dd3264f77333d4ac6_pdR1_8Vcqziq7pVBxC8DohIbbNS24TX5IukIgqLM9zk.jpeg)

