My Account
My Slides
Search by Category
Templates
Leave Feedback
Login
Logout
Get Started
Browse all Slides
Browse all Slides
Create a FREE Account
Instant access to 1,000+ real slides from top companies like McKinsey, BCG, Goldman Sachs, Google and many more!
First Name
Last Name
Email
Password
I agree to all
Terms & Privacy Policy
Thank you! Your submission has been received!
Oops! Something went wrong while submitting the form.
Have an account?
Sign in
Saved Slides
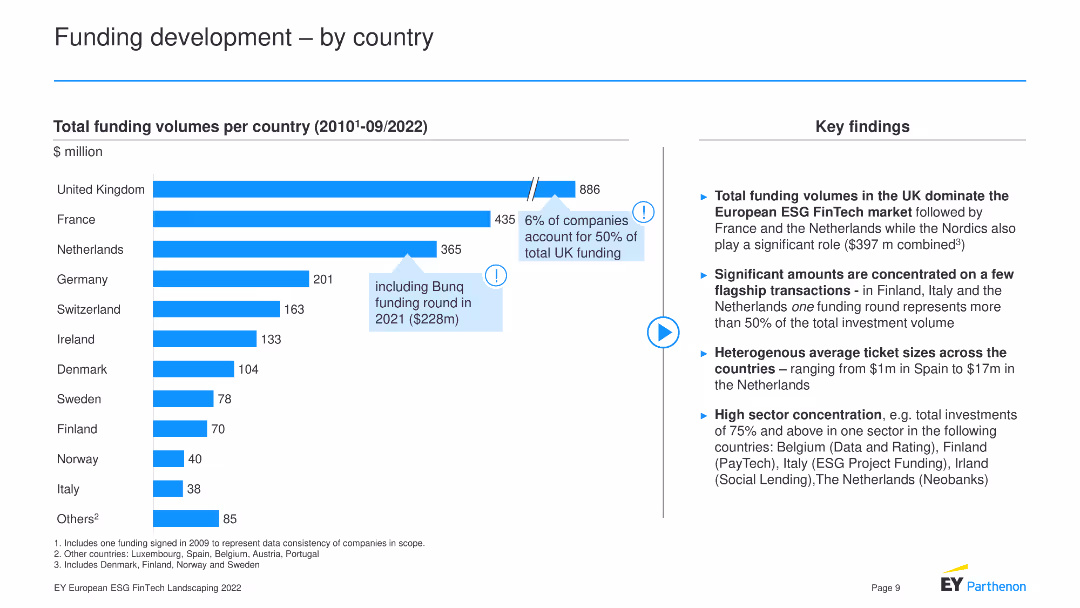
This slide features a bar chart showing funding volumes by country (2010-09/2022) and key findings.
Market Analysis and Trends
Financial Services
The slide compares total funding volumes across various countries, highlighting the UK's dominance in ESG FinTech funding, significant funding transactions in specific countries, heterogeneous average ticket sizes, and high sector concentration in certain regions.
Country Funding, ESG FinTech, Market Comparison
Mixed Chart
EY
Saved
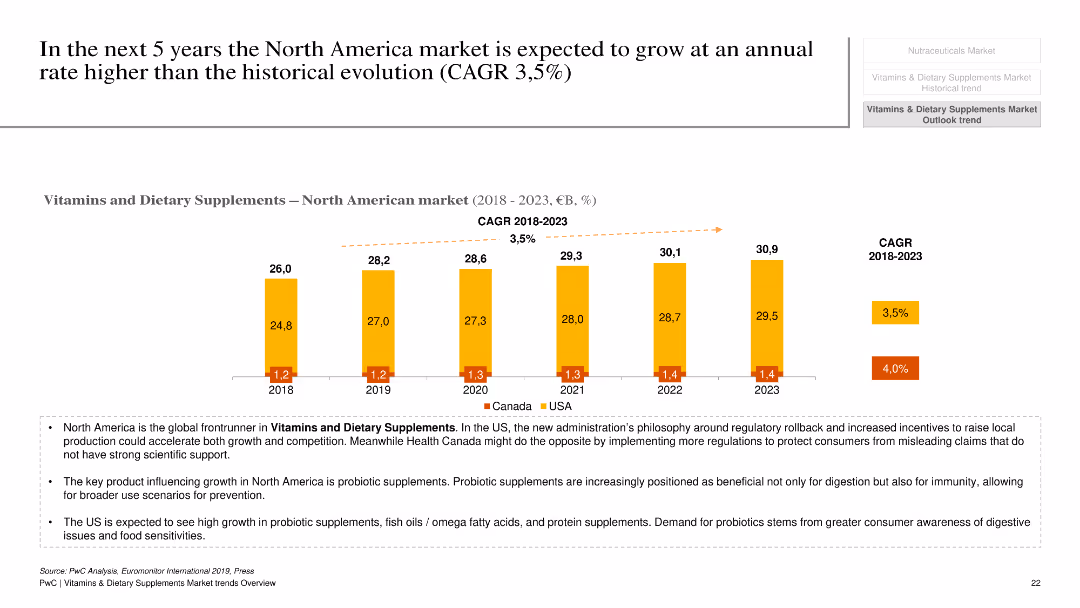
This slide contains a column chart depicting the growth of the North American market for vitamins and dietary supplements from 2018 to 2023, with separate data for the USA and Canada. Additional text provides key drivers and market dynamics.
Market Analysis and Trends
Healthcare & Pharmaceuticals
The slide forecasts the growth of the North American market for vitamins and dietary supplements, with a detailed breakdown for the USA and Canada. It discusses key drivers such as regulatory changes, consumer health awareness, and product trends, projecting a higher growth rate compared to historical trends.
North American market, vitamins, dietary supplements, growth forecast, USA, Canada
Mixed Chart
PwC/Strategy&
Saved
Visual elements include a Venn diagram linking market opportunities to franchise benefits, accompanied by a list of attributes on the right that underline the strong client value proposition.
Product and Service Analysis
Financial Services
Addressing new market opportunities, this slide illustrates how small market shares in the transaction banking sector can lead to significant economic gains. It links potential benefits to the company's broader strategy, highlighting attributes such as analytics, modern tools, and scalable customization, which align with the firm’s transaction banking offerings.
Transaction Banking, Market Opportunity, Strategy, Client Value, Innovation
Table
Goldman Sachs
Saved
The slide presents column charts comparing the anticipated changes in the use of private vehicles and trains for intercity travel, split by current vehicle ownership status.
Market Analysis and Trends
Transportation & Logistics
Analyzes anticipated changes in vehicle use for intercity travel, considering vehicle ownership.
intercity travel, vehicle usage, ownership, projections
Multiple Chart
McKinsey
Saved
The layout includes a central diagram with a circular flow and additional text sections.
Organizational Structure and Change
Financial Services
Demonstrates JPMC's cross-LOB (line of business) partnership and its global leadership reach, emphasizing the company's unique market position and offerings.
JPMC, Partnership, LOB, Global, Leadership
Framework
JP Morgan
Saved
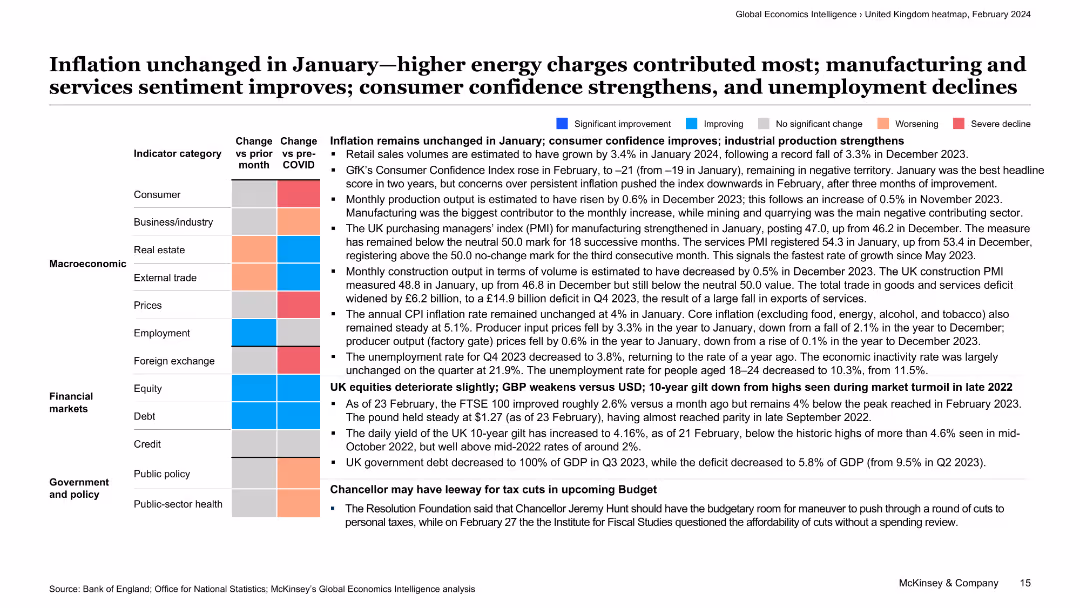
The slide features a detailed text-based content with a categorized list of economic indicators and their respective changes. Each category is color-coded to signify different levels of improvement or decline.
Market Analysis and Trends
Financial Services
This slide discusses the inflation status in January, highlighting that higher energy charges were a major factor. It provides insights into various economic indicators, including consumer confidence, industrial production, and unemployment rates.
inflation, energy charges, economic indicators, consumer confidence, unemployment
Table
McKinsey
Saved
This slide displays two column charts comparing the return percentages of different sectors within the S&P 500 and MSCI World indices over 1 month, YTD, and 1 year.
Market Analysis and Trends
Financial Services
The slide offers a comparative return analysis of various sectors in the S&P 500 and MSCI World indices, showing performance over multiple time periods.
sector returns, S&P 500, MSCI World, comparative analysis
Multiple Chart
Morgan Stanley
Saved
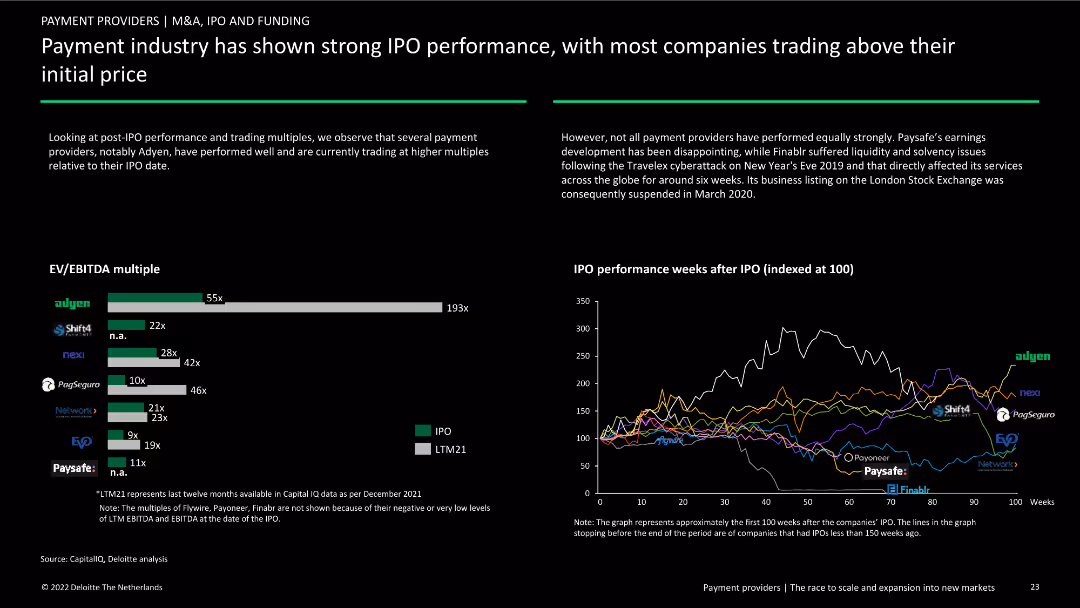
This slide features a horizontal bar chart (EV/EBITDA multiple) and a line chart (IPO performance weeks after IPO). The layout is dense with data visualizations and text sections on both sides.
Financial Performance
Financial Services
The slide analyzes the post-IPO performance and trading multiples of payment providers, highlighting companies like Adyen that are performing well, and discussing issues faced by others like Paysafe and Finablr.
IPO, performance, trading multiples, payment, analysis, Adyen, Paysafe, Finablr, EV/EBITDA, financial
Multiple Chart
Deloitte
Saved
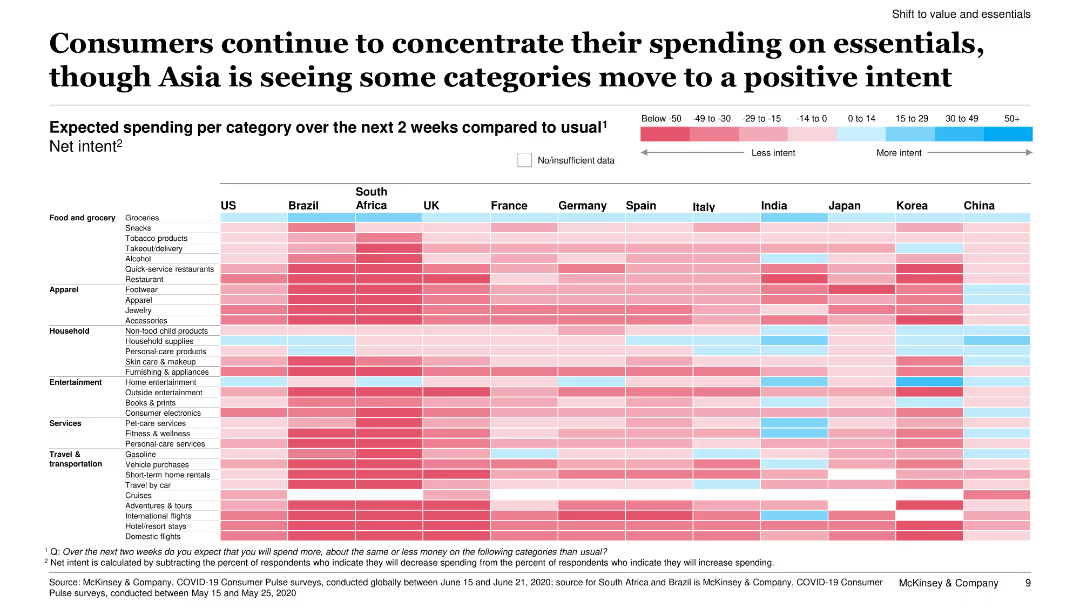
This slide features a heatmap chart showing expected spending per category over the next two weeks compared to usual, across various countries.
Market Analysis and Trends
Retail & E-commerce
The slide analyzes expected consumer spending by category over the next two weeks, noting a concentration on essentials and some positive intent in Asian countries.
consumer spending, essentials, Asia, positive intent, heatmap, spending categories, survey, next two weeks, comparison
Table
McKinsey
Saved
The slide features a large image at the top left with text on the right, including a trend assessment with bar charts.
Technology and Digital Transformation
Retail & E-commerce
Discusses voice commerce, highlighting the use of smart speakers and voice commands to enhance online shopping experiences.
Voice Commerce, Smart Speakers, Voice Commands, Retail, Shopping, AI, Personalization, Customer Interaction
Mixed Chart
Deloitte
Saved
The slide features a column chart showing the theoretical, technical, and sustainable feedstock energy potential by feedstock type for the year 2060. The chart uses various shades of purple to represent different types of feedstock, including energy crops, municipal solid waste, forestry residues, agricultural residues, and animal waste.
Market Analysis and Trends
Energy & Utilities
This slide illustrates the potential energy that could be derived from various types of biomass feedstock by 2060. It emphasizes the portion of feedstock not gathered or collected and the competition for feedstock with other uses.
feedstock, biomass, energy, potential, 2060, theoretical, technical, sustainable, agricultural residues, energy crops
Single Chart
Kearney
Saved
Scatter plot analyzing the correlation between financial performance and business & technology dimensions among companies.
Technology and Digital Transformation
Technology & Software
Evaluates how companies with strong business and technological capabilities tend to outperform in long-term profitability.
business capabilities, technology, financial performance, profitability, long-term growth, scatter plot, business dimensions, technology investment
Mixed Chart
Accenture
Saved
The slide features a diagram illustrating Ipsos's reputation and policy legislation intelligence platform, highlighting data sources, analytics, and actionable alerts.
Technology and Digital Transformation
Technology & Software
It details Ipsos’s AI and advanced analytics platforms, explaining how they help clients sense and respond in real time using various data sources and technologies.
AI, analytics, Ipsos, data, real-time response
Linear Flow
IPSOS
Saved
Column charts showing NPL ratios, loan loss provisions, and Stage 2 loans for top UK banks.
Risk Assessment and Management
Financial Services
Analyzes NPL ratios and provisions of major UK banks, highlighting risk management strategies and trends.
UK, banks, NPL, risk, management
Multiple Chart
Deloitte
Saved
The slide features a red background with white text on the left, and two pie charts with accompanying text on the right. The layout includes a quote at the bottom right. The pie charts use red and gray colors to highlight key statistics.
Risk Assessment and Management
Financial Services
The slide discusses the low levels of cyber risk maturity among companies and highlights key statistics and quotes to emphasize the importance of improving cyber risk management.
cyber risk, maturity, companies, statistics, management, improvement, challenges, future, growth
Multiple Chart
PwC/Strategy&
Saved
Column charts analyzing revenue vs. expenditure.
Financial Performance
Financial Services
Compares annual financial figures, including revenue, expenditure, and budget deficits, with visual data representation to illustrate financial trends and fiscal health.
finance, analysis, revenue, expenditure, trends
Multiple Chart
PwC/Strategy&
Saved
Presents a blue column chart with amounts of cash returned to shareholders over four fiscal years, highlighting a significant share repurchase initiative.
Financial Performance
Consumer Goods
Reviews the substantial amounts returned to shareholders through dividends and share repurchases, underscoring the company's commitment to shareholder returns.
shareholder return, dividends, share repurchase, fiscal years, investment
Single Chart
Barclays
Saved
A dark background slide with white and yellow text, and a series of column charts depicting reasons for virtual consultations.
Technology and Digital Transformation
Healthcare & Pharmaceuticals
It highlights consumer preferences for virtual consultations for minor medical matters, test results, and time-saving.
virtual care, consultations, convenience, survey, England
Mixed Chart
EY
Saved
This slide features a line chart depicting the maturity curve of CO₂ separation and capture technologies. It includes different colored lines representing various industries and technologies.
Technology and Digital Transformation
Energy & Utilities
It illustrates the maturity stages of CO₂ separation and capture technologies from lab work to widely deployed stages, highlighting the capital requirements and technology risk involved.
CO₂ capture, maturity curve, separation technologies, capture technologies, energy, utilities, capital requirements
Single Chart
Kearney
Saved
Includes a column chart showing the economic impact of Copernicus for marine environments, detailed bullet points describing the key applications and benefits, and a visual layout designed to focus on marine themes.
Regulatory and Compliance
Environmental Services & Sustainability
The slide explores the contributions of Copernicus to coastal and marine exploitation and preservation, detailing how accurate, near-real-time data supports better decision-making in marine activities. It addresses the increasing demands on marine environments due to climate change and human activities.
marine, Copernicus, environmental monitoring, coastal preservation, data utilization
Mixed Chart
PwC/Strategy&
Saved
Features a large pie chart and a vertical bar graph detailing percentages of failure reasons, in a monochromatic blue scheme. This layout efficiently presents comparative data.
Operational Efficiency
Professional Services
Analyzes specific reasons for transformation failures, focusing on employee resistance and management behavior, useful for training sessions on change management.
transformation, failure, employee resistance, management, behavior, professional services, bar graph, pie chart
Multiple Chart
McKinsey
Saved
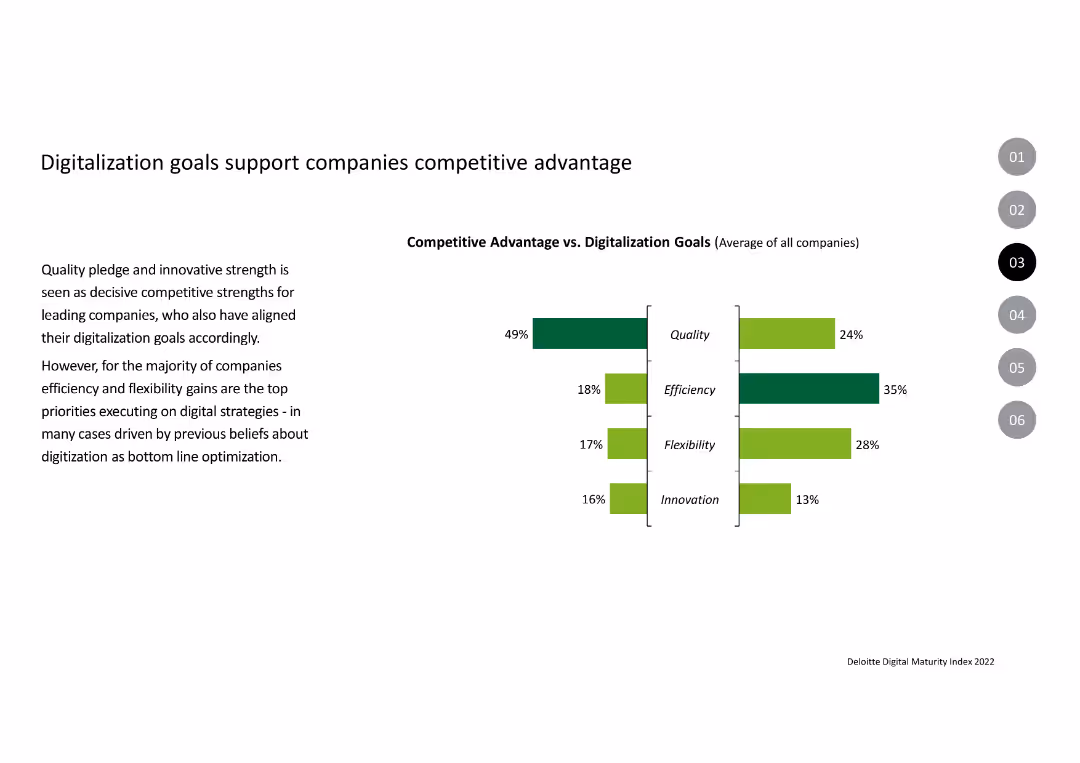
The slide contains a column chart comparing competitive advantages vs. digitalization goals across metrics like quality, efficiency, flexibility, and innovation.
Strategic Planning
Professional Services
This slide shows how companies align their digitalization goals with competitive advantages, focusing on quality, efficiency, flexibility, and innovation.
Digitalization, Competitive Advantage, Quality, Efficiency, Flexibility, Innovation
Multiple Chart
Deloitte
Saved
Column charts showing total revenues and profit before tax for different regions, with additional text explanations.
Financial Performance
Financial Services
Details the financial performance by region for Q3 2022, highlighting revenues and profits across various geographies.
Group results, regions, financial performance, UBS, 3Q22, revenues, profit, cost/income ratio
Multiple Chart
UBS
Saved
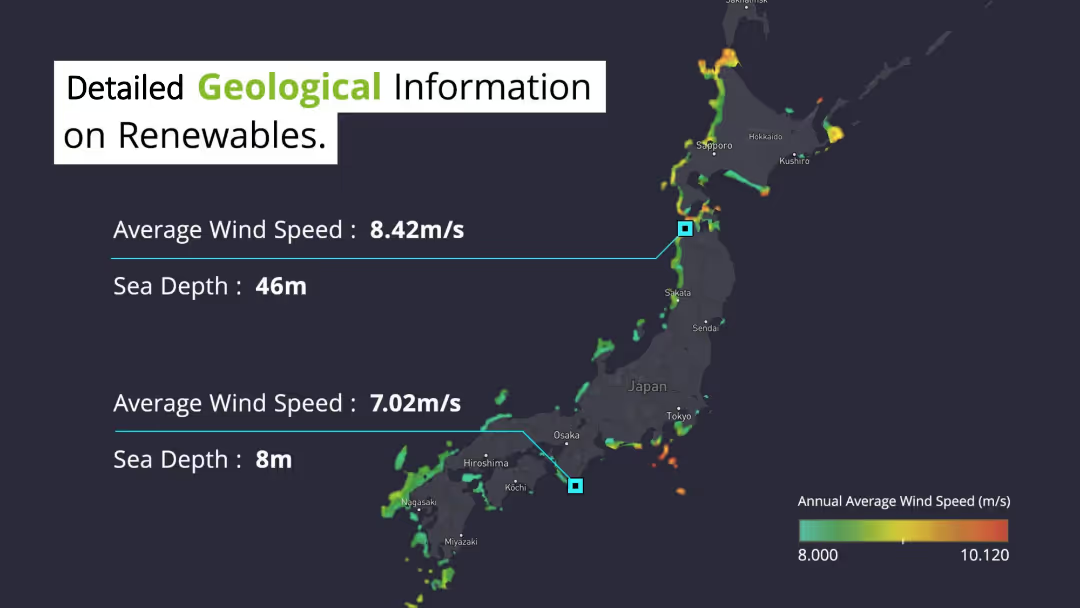
Displays a map of Japan with highlighted areas showing average wind speeds and sea depths. Text on the left and center provides specific wind speed and sea depth data for two locations. The dark background map contrasts with highlighted data points and textual information.
Market Analysis and Trends
Environmental Services & Sustainability
Shares detailed geological data on renewable energy potential in Japan, focusing on average wind speeds and sea depths in various regions. This information is crucial for planning and optimizing renewable energy projects, particularly offshore wind farms.
Renewable, Wind Speed, Sea Depth, Japan, Geological
Graphic
Deloitte
Saved
A bar extends across the slide, segmented into various client categories with associated market sizes and wealth management share, presented in a clear, hierarchical manner. The design is simple with a blue color scheme.
Financial Performance
Financial Services
Details the firm's market approach for different client segments across the wealth spectrum, from ultra-high net worth to mass affluent, indicating potential for market expansion.
Wealth Spectrum, Client Segmentation, Market Share
Table
Goldman Sachs
Saved
Previous
Next
If nothing, comes up, please save your slides first
Create a FREE account to continue browsing
Receive Instant Access to 1,000+ slides from companies like McKinsey, Google, and Goldman Sachs
First Name
Last Name
Email
Password
I agree to all
Terms & Privacy Policy
Thank you! Your submission has been received!
Oops! Something went wrong while submitting the form.
Have an account?
Sign in
Column Chart
Heatmap
Chevron
Org Chart
Infographic
Callouts
Timeline
List
Graphic
Picture
Process Flow
Diagram
Paragraph
Map
Table
Framework
Subtitle
Takeaway Box
Icon
Other Chart
Radar Chart
Waterfall Chart
Mekko Chart
Pie Chart
Scatter Plot
Line Chart
Bar chart
Bullet points