My Account
My Slides
Search by Category
Templates
Leave Feedback
Login
Logout
Get Started
Browse all Slides
Browse all Slides
Create a FREE Account
Instant access to 1,000+ real slides from top companies like McKinsey, BCG, Goldman Sachs, Google and many more!
First Name
Last Name
Email
Password
I agree to all
Terms & Privacy Policy
Thank you! Your submission has been received!
Oops! Something went wrong while submitting the form.
Have an account?
Sign in
Saved Slides
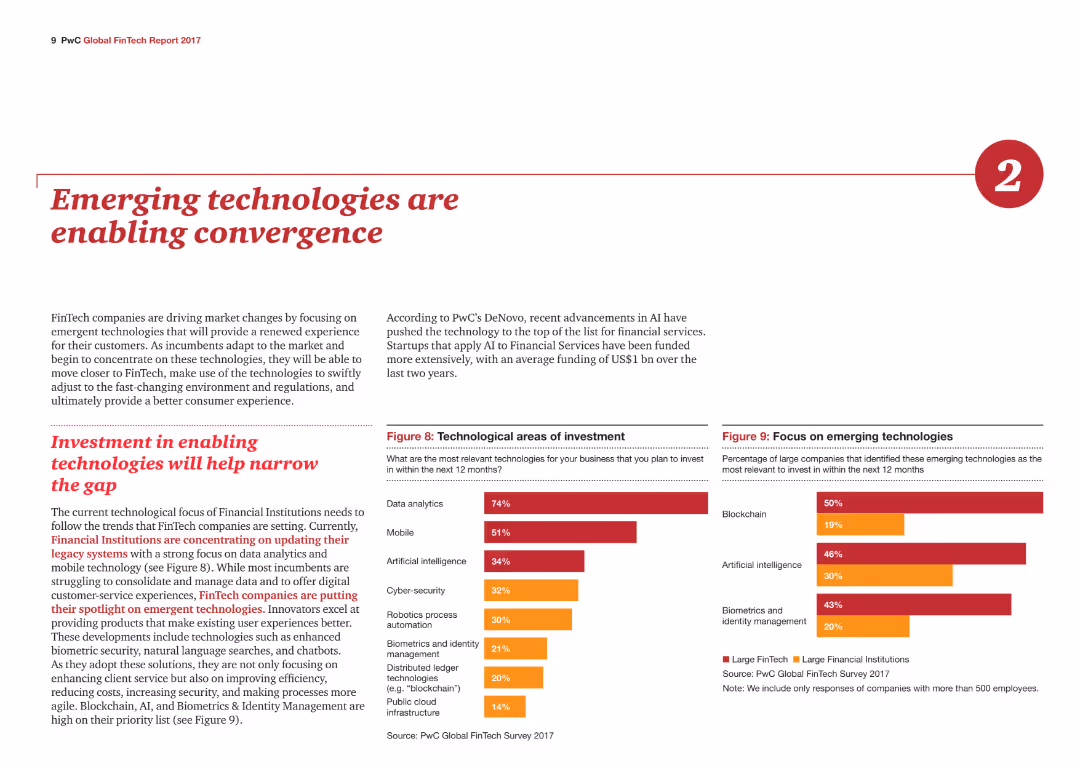
Two column charts show technological areas of investment and focus on emerging technologies, with different colors representing large FinTech and financial institutions.
Technology and Digital Transformation
Financial Services
The slide highlights how emerging technologies like AI and blockchain are driving changes in FinTech, with investment trends in data analytics, mobile, and artificial intelligence.
Emerging technologies, Investment, FinTech, AI, Blockchain
Multiple Chart
PwC/Strategy&
Saved
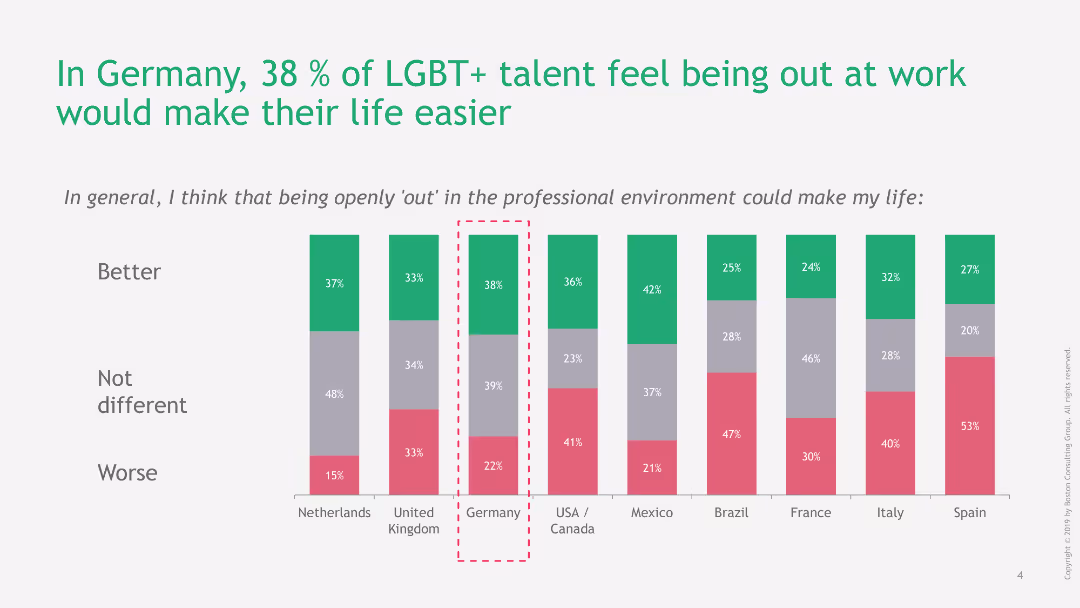
Column chart showing percentages of LGBT+ talents' opinions on how being out would affect their work life. Green, gray, and red bars represent different impacts.
Regulatory and Compliance
Professional Services
The slide presents data on the perceived impact of being openly out at work among LGBT+ talents, with a focus on Germany where 38% feel it would improve their life.
LGBT+, Germany, workplace, diversity, life impact
Single Chart
BCG
Saved
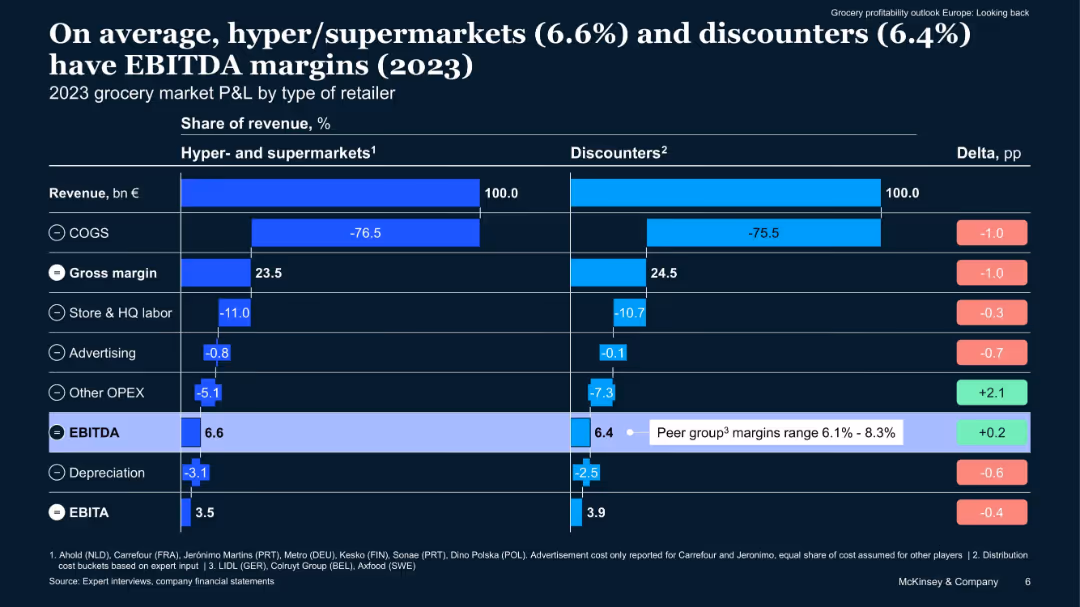
Bar chart comparing cost structures of hypermarkets and discounters, with percentage breakdowns of revenue allocation (COGS, labor, EBITDA, etc.). Clear delta column compares differences.
Financial Performance
Retail & E-commerce
Breakdown of EBITDA margins for hypermarkets and discounters, showing near parity. Includes details on cost of goods sold, operational expenses, and EBITDA levels. Highlights cost management and profitability levers for grocery players.
cost structure, EBITDA, discounters, hypermarkets, grocery profitability
Multiple Chart
McKinsey
Saved
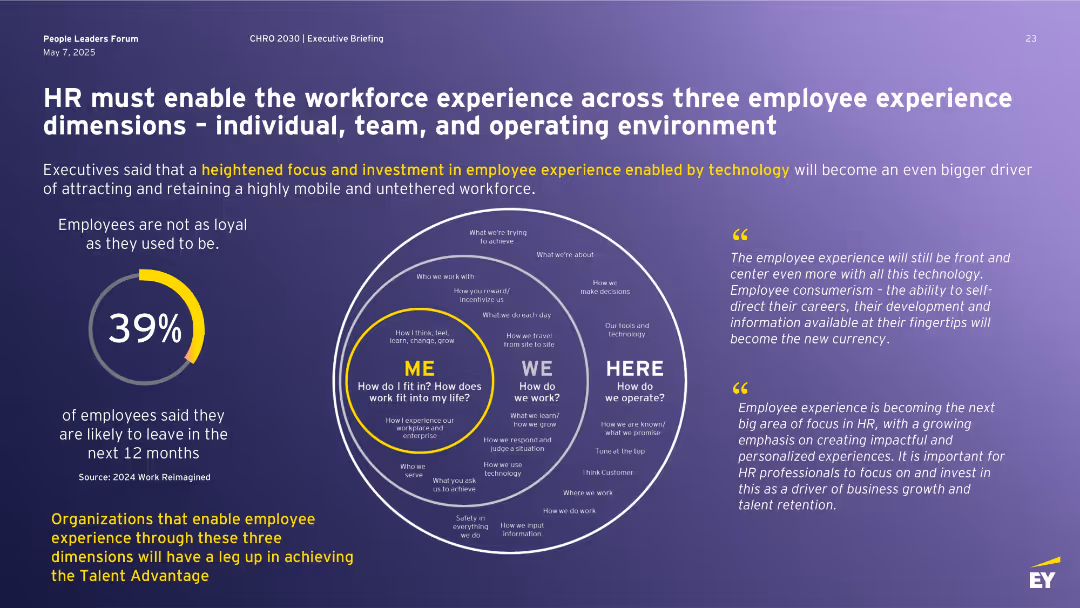
Purple theme with white bold heading, donut chart (39%) on left, central Venn-style model showing ME–WE–HERE, and two yellow quote boxes on the right.
Human Resources and Talent Management
Professional Services
This slide focuses on enhancing employee experience through three dimensions—individual (ME), team (WE), and environment (HERE). It highlights employee mobility, loyalty trends, and the importance of technology in improving HR experiences. Key statistics and quotes underscore the significance of this strategy.
employee experience, retention, HR, individual/team/environment, workforce mobility, technology, engagement
Mixed Chart
EY
Saved
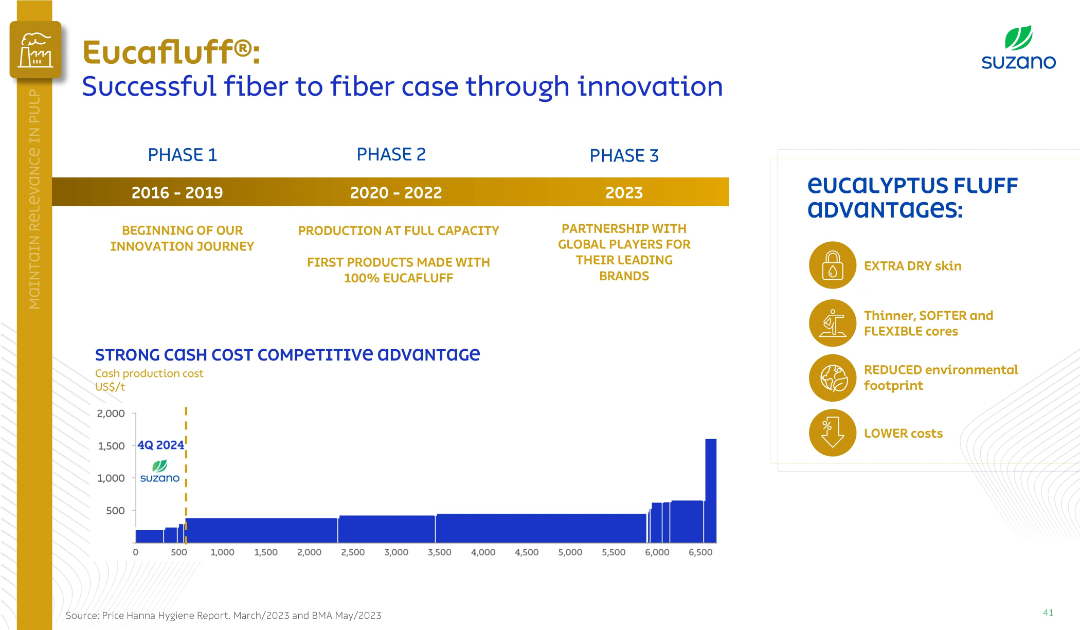
Timeline with three phases (2016–2023), bar chart of production costs, and a list of product advantages.
Product and Service Analysis
Consumer Goods
Showcasing Eucafluff® development, the slide highlights its innovation journey across three phases, production scalability, and cost competitiveness. Key advantages like softness, lower cost, and eco-friendliness are visually presented.
Eucafluff, product innovation, cost advantage, eucalyptus, hygiene
Mixed Chart
Goldman Sachs
Saved
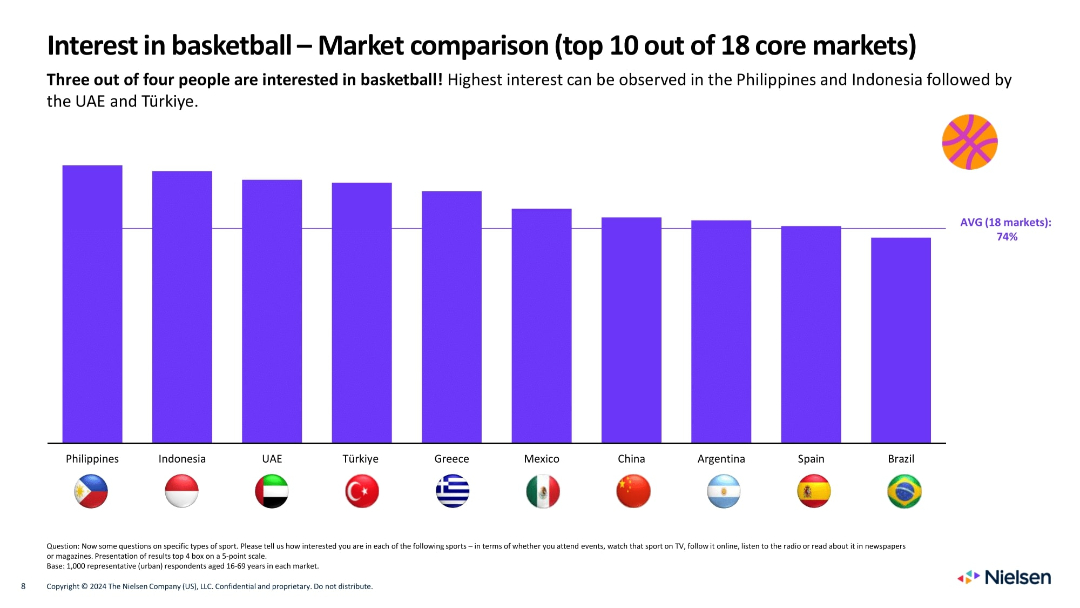
Horizontal bar chart comparing basketball interest across top 10 countries.
Market Analysis and Trends
Media & Entertainment
Compares interest in basketball across 10 key global markets, with the Philippines and Indonesia showing the highest engagement. Emphasizes that 3 out of 4 people in these markets are interested in the sport, highlighting strong regional enthusiasm for basketball.
basketball, market comparison, interest, countries, global sports
Single Chart
Nielsen
Saved
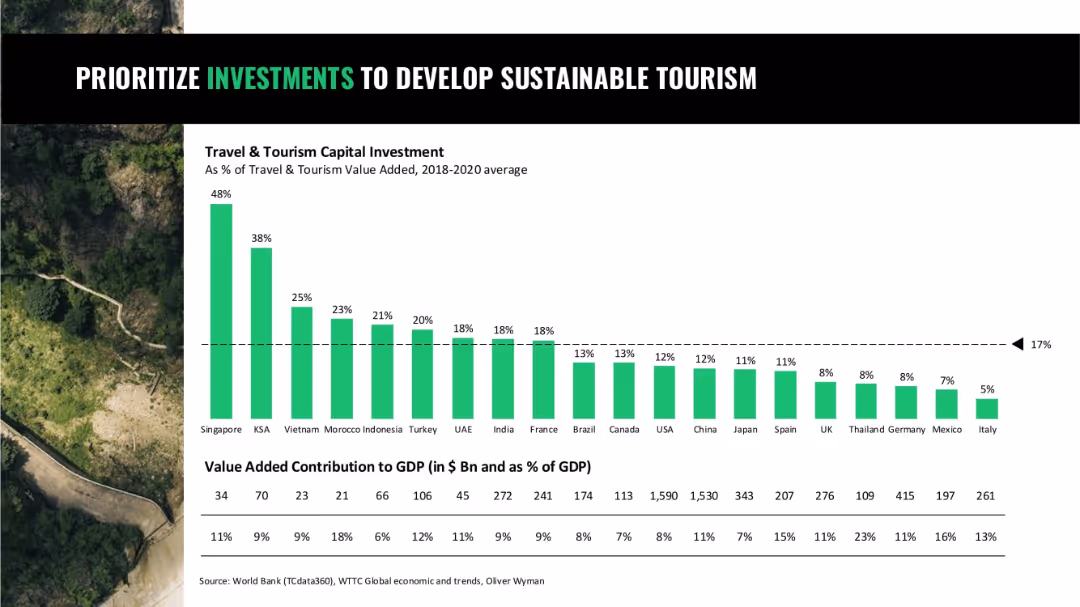
Bar chart comparing travel and tourism capital investment as % of GDP by country; background nature imagery
Strategic Planning
Hospitality & Tourism
A comparison of how countries invest in sustainable tourism relative to GDP, highlighting Singapore, Saudi Arabia, and Vietnam as leaders, and showing a global average benchmark.
tourism investment, sustainable development, travel, capital allocation, GDP share
Single Chart
Oliver Wyman
Saved
The slide has a clear column chart with historical data for 2015 & 2019 and projected for 2020 & 2025. Minimal text is present with a source citation at the bottom. Colors are used to distinguish between years, and percentage growth is indicated above columns.
Market Analysis and Trends
Technology & Software
The slide represents the growth of Thailand's internet economy, showing a significant increase from 2015 to a forecast for 2025. The focus is on the e-commerce sector's contribution to the economy with a CAGR indication.
Thailand, Internet Economy, Growth, E-commerce, CAGR, Projection, Analysis, 2015, 2025, Bain Analysis
Single Chart
Bain
Saved
The slide features bar charts ranking stock exchanges by the number of IPOs and proceeds for YTD 2023, with a focus on Mainland China and India leading in global fundraising.
Market Analysis and Trends
Financial Services
This slide provides a comparative analysis of global stock exchanges, highlighting Mainland China's dominance in fundraising and India's leading position in deal count for YTD 2023.
IPO, stock exchange, China, India, fundraising
Multiple Chart
EY
Saved
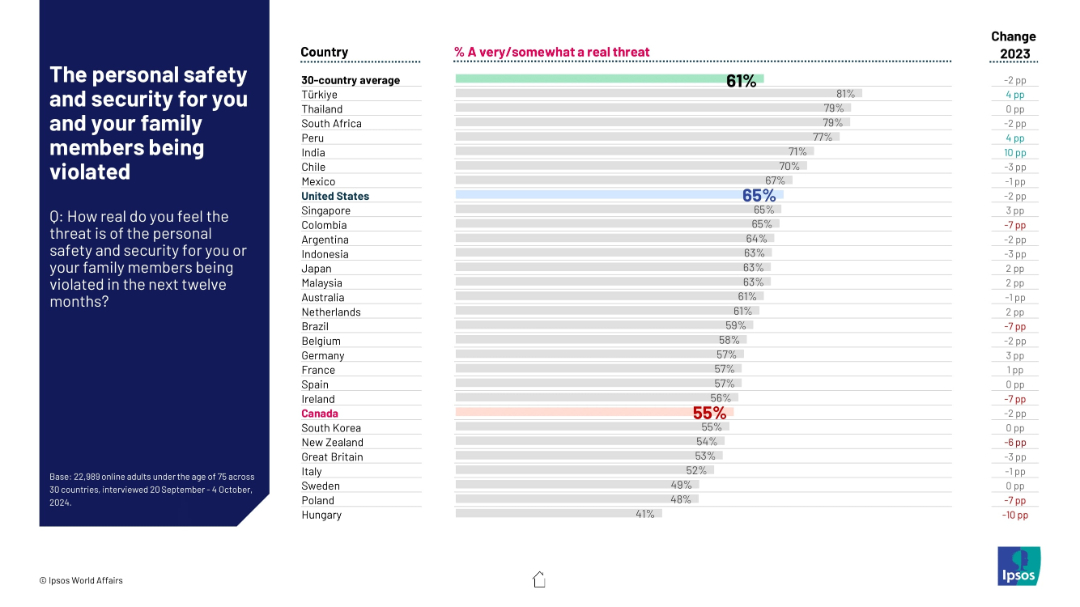
Horizontal bar chart ranking countries by concern over personal safety violations; Canada and U.S. highlighted.
Risk Assessment and Management
Government & Public Sector
The slide presents public perceptions of the threat to personal and family safety across countries. U.S. respondents show relatively high concern (65%), while Canada’s perception is lower (55%).
personal safety, threat, global perception, survey results, 2024, Canada, U.S., Ipsos, risk, family security
Mixed Chart
IPSOS
Saved
The slide includes text descriptions alongside icons representing various agricultural applications of solar power, arranged in a clean, easy-to-follow layout.
Strategic Planning
Agriculture & Food Production
Provides an overview of how solar power supports various agricultural processes beyond cold storage, such as water pumps and crop drying, outlining their developmental impacts.
solar power, agriculture, crop production, water pumps, sustainable energy
Table
BCG
Saved
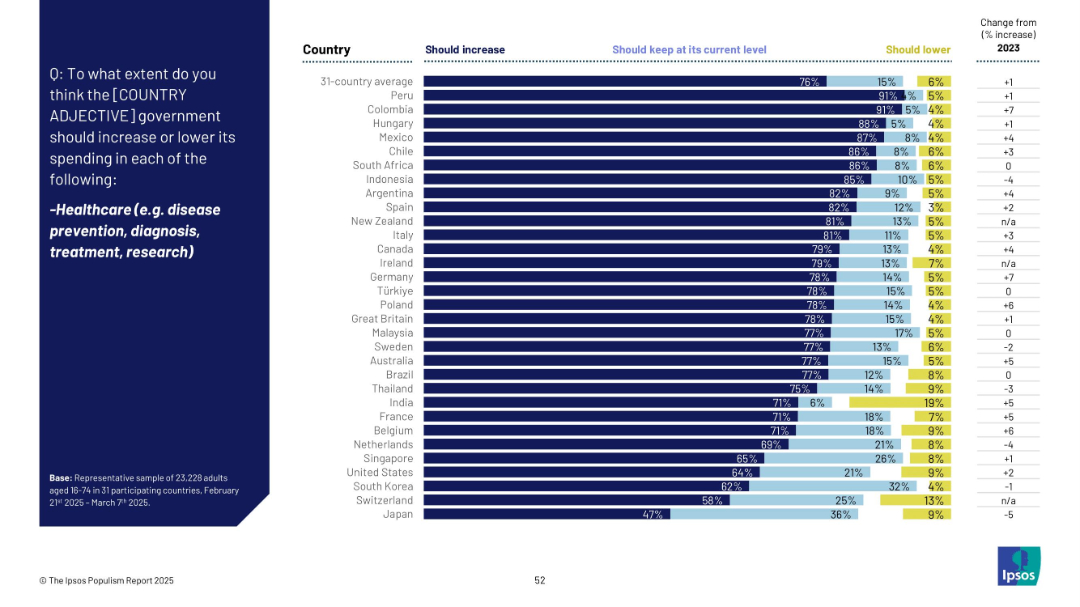
Horizontal bar chart showing public opinion on whether healthcare spending should be increased, maintained, or lowered, with % change from 2023.
Strategic Planning
Healthcare & Pharmaceuticals
The majority of respondents in most countries (76% avg) favor increased government spending on healthcare. Support is highest in Peru, Colombia, and Hungary. Japan and Switzerland have lower percentages, possibly reflecting different national contexts.
healthcare, disease prevention, spending, public services, medical care, Ipsos, global, bar chart
Mixed Chart
IPSOS
Saved
Matrix arrangement of icons representing digital adoption enablers against a grayscale backdrop. Organized and digestible presentation of key elements.
Market Analysis and Trends
Technology & Software
Evaluates Indonesia's digital ecosystem, identifying enablers for digital adoption. Useful for stakeholders to assess capabilities and strategize on improving digital infrastructure and policy.
Digital Adoption, Infrastructure, Access to Capital, Regulatory, Talent Development, Consumer Education, Ecosystem
Pillar
Kearney
Saved
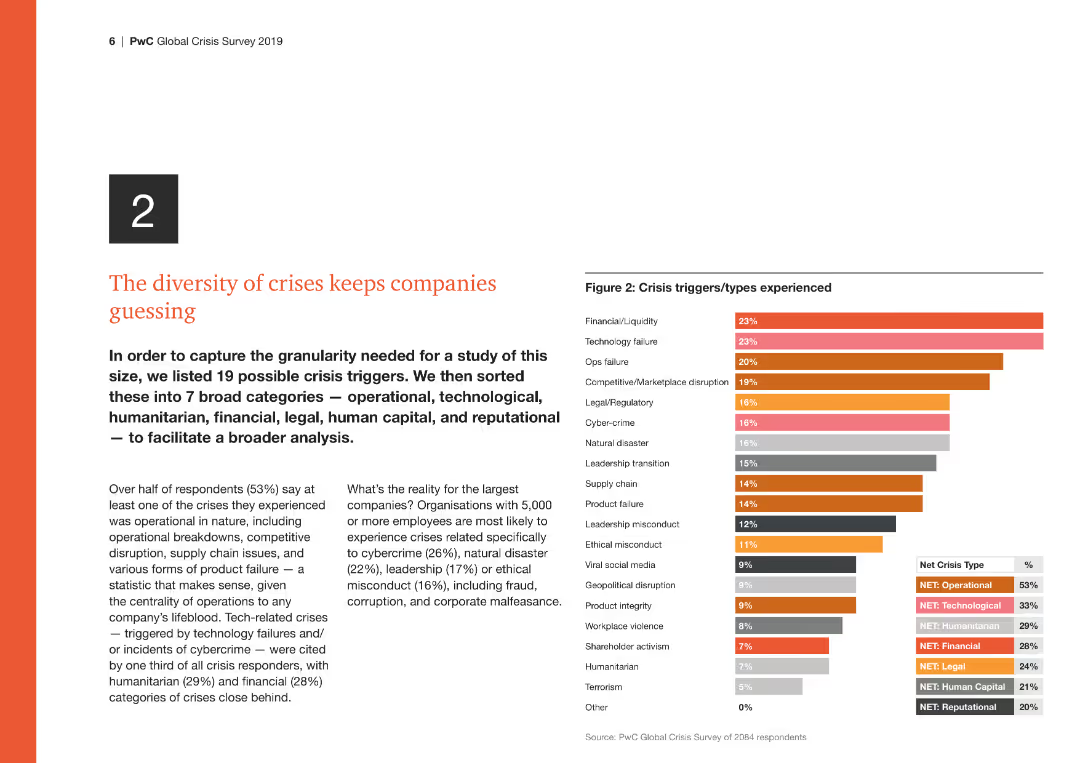
The slide includes a column chart on the right side showing different crisis triggers/types experienced, with financial/liquidity and technology failure at the top.
Risk Assessment and Management
Financial Services
This slide lists 19 possible crisis triggers categorized into seven broad categories for comprehensive analysis, highlighting the importance of diverse crisis preparedness.
Crisis triggers, financial, operational, technology, human capital, reputational
Mixed Chart
PwC/Strategy&
Saved
Two main sections each containing tables and a summary box. The slide has a clear and clean layout, emphasizing the comparative financial data with blue highlights.
Market Analysis and Trends
Financial Services
Summarizes FICC and equities net revenues with annual and quarterly comparisons, accompanied by highlights discussing the financial trends and market conditions.
FICC, equities, net revenues, financial trends, market analysis, Goldman Sachs, performance review, market conditions, investment strategy, year-over-year comparison
Header Vertical
Goldman Sachs
Saved
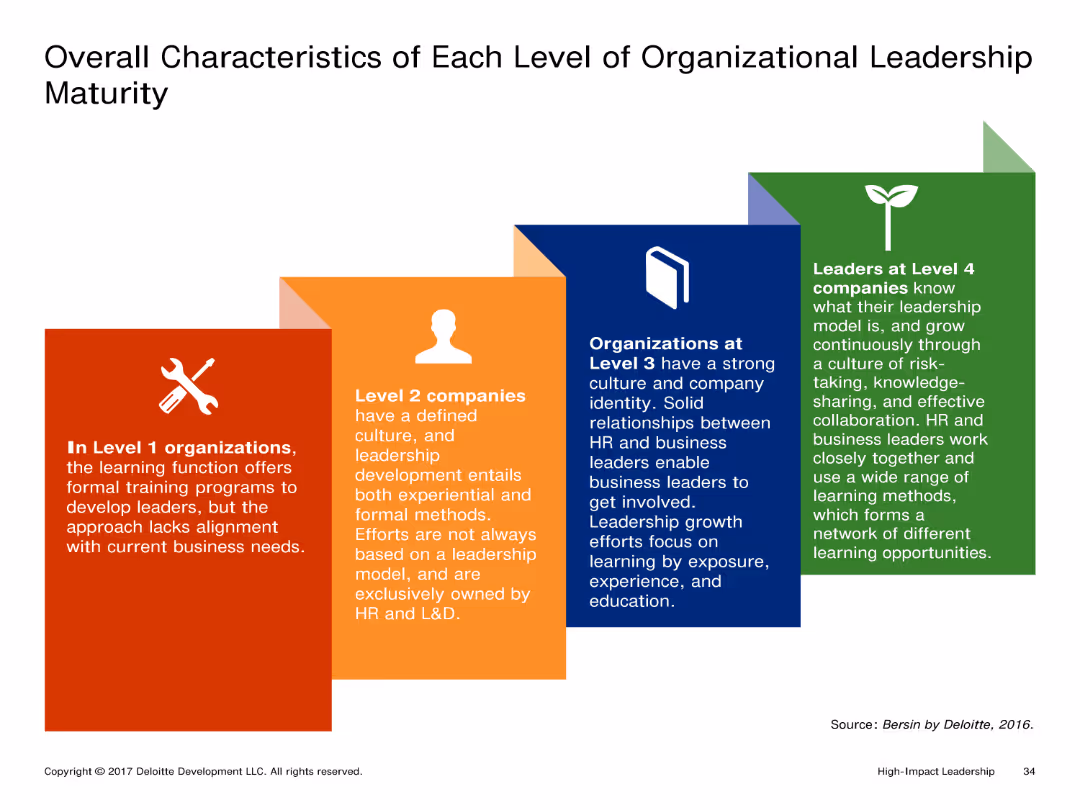
The slide shows a visual representation of different levels of organizational leadership maturity with distinct boxes for each level. Each box contains detailed text describing the characteristics of that level.
Market Analysis and Trends
Professional Services
It outlines the characteristics of organizations at different levels of leadership maturity, from Level 1 to Level 4. Each level's description highlights the leadership development approach and involvement of HR and business leaders.
Leadership, Organizational Maturity, Levels, Characteristics, Development
Pillar
Deloitte
Saved
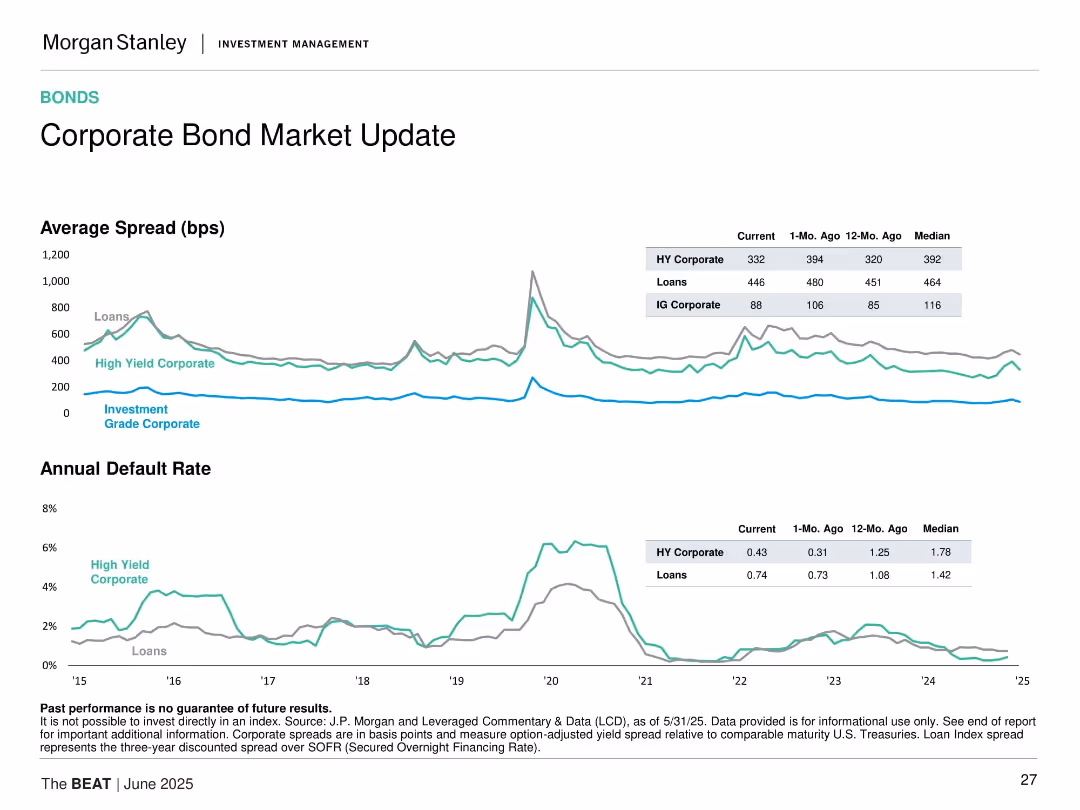
Two line charts showing spread and default rate trends for HY and IG corporates and loans; includes supporting table.
Performance Metrics and KPIs
Financial Services
Presents spread trends and annual default rates for high yield, investment grade corporates, and loans. Highlights changes in spreads and default risks.
corporate bonds, spreads, default rate, loans, high yield, investment grade, performance, market trends
Multiple Chart
Morgan Stanley
Saved
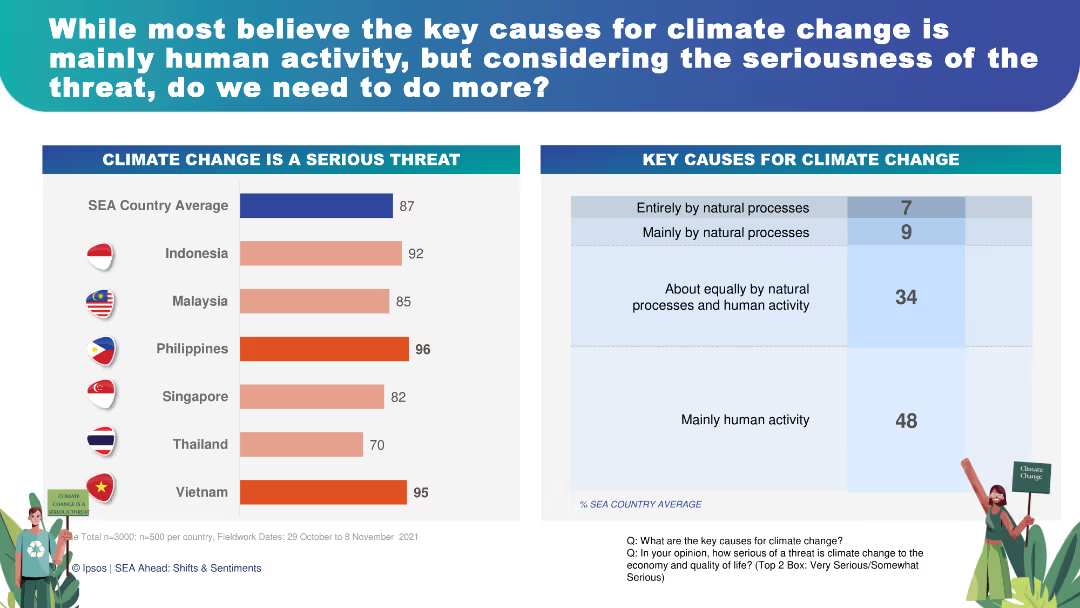
This slide features a combination of horizontal and vertical bar charts showing perceptions of climate change as a serious threat and its key causes. The charts are color-coded for easy interpretation, with accompanying text for clarity.
Risk Assessment and Management
Environmental Services & Sustainability
The slide presents survey results showing 87% of respondents consider climate change a serious threat, with 48% attributing it mainly to human activity. This can be used to discuss the urgency of climate action, public opinion on environmental issues, and strategies for risk management and mitigation.
climate change, public opinion, environmental risk, human activity, sustainability
Multiple Chart
IPSOS
Saved
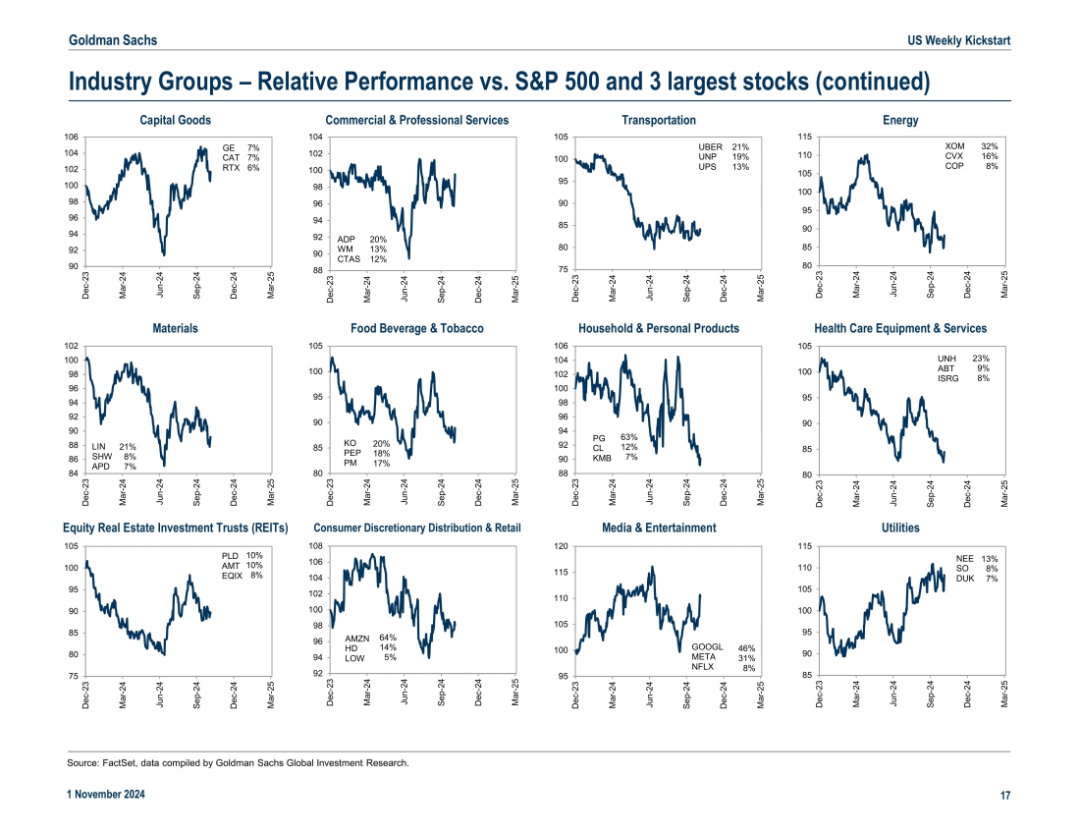
Continuation of slide 17946 with 15 additional industry group charts and key stock annotations
Market Analysis and Trends
Financial Services
Continuation of sector drill-down, covering additional industries like Utilities, Transportation, REITs, and Food & Beverage. Emphasizes leading stocks and relative strength vs. S&P 500.
sector breakdown, REITs, food & beverage, transportation, key stocks, relative trends
Multiple Chart
Goldman Sachs
Saved
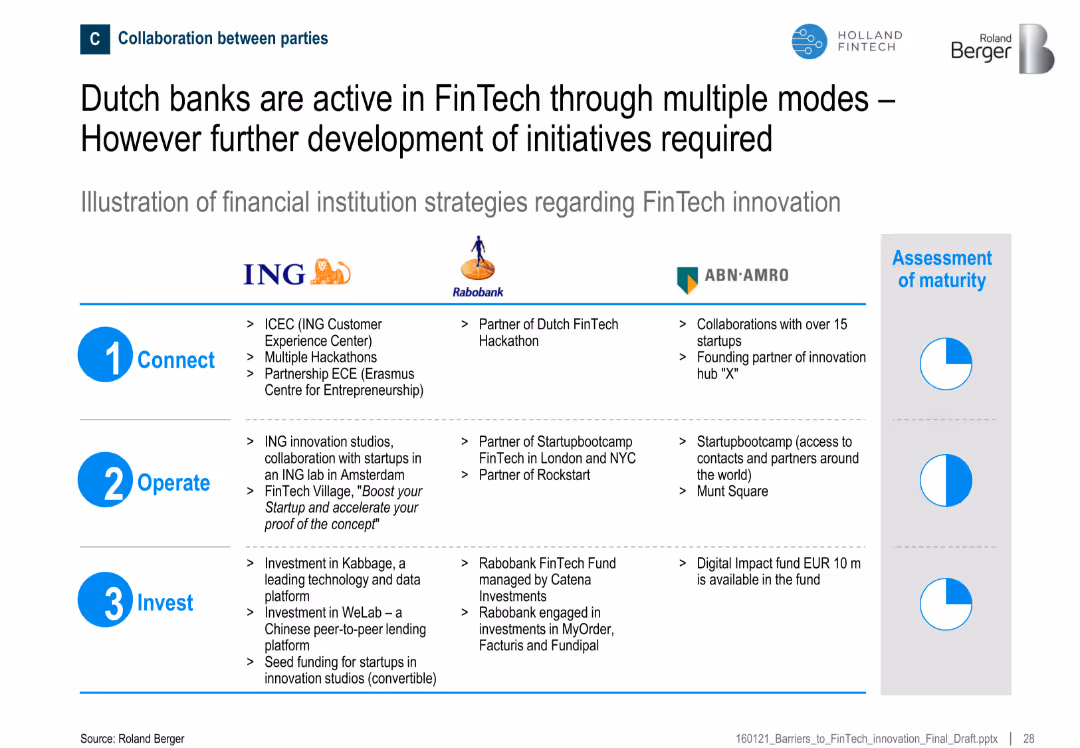
Tabular comparison of ING, Rabobank, and ABN-AMRO across Connect, Operate, and Invest categories; maturity indicators shown
Strategic Planning
Financial Services
Provides a comparative overview of Dutch banks’ FinTech engagement activities, highlighting varying levels of initiative maturity across connection, operation, and investment categories.
Dutch banks, FinTech, ING, Rabobank, ABN-AMRO, investment, innovation
Mixed Chart
Roland Berger
Saved
Comparative charts detailing monthly sales changes for passenger vehicles in multiple countries, using color-coded bars.
Market Analysis and Trends
Transportation & Logistics
Reviews the recovery in passenger vehicle sales post-pandemic, useful for market analysis and predicting future consumer behavior in the auto industry.
auto sales, market recovery, pandemic impact, consumer behavior, sales analysis
Multiple Chart
BCG
Saved
Pie chart showing liquidity pool composition; column charts show LCR trends and TF SME impacts.
Regulatory and Compliance
Financial Services
Discusses liquidity coverage ratios and balance sheet management strategies over the coming years.
liquidity, regulations, balance sheet, cash management, LCR
Multiple Chart
Barclays
Saved
The slide displays a table and a bar chart showing adjusted net revenues, operating expenses, and pre-tax income/loss for Credit Suisse divisions for 2Q23, with percentage changes quarter-on-quarter.
Financial Performance
Financial Services
The slide provides an overview of Credit Suisse's adjusted financial results for the second quarter of 2023, highlighting revenue, expenses, and pre-tax income/loss for different divisions, indicating financial health and performance.
adjusted results, Credit Suisse, 2Q23, net revenues, operating expenses
Mixed Chart
UBS
Saved
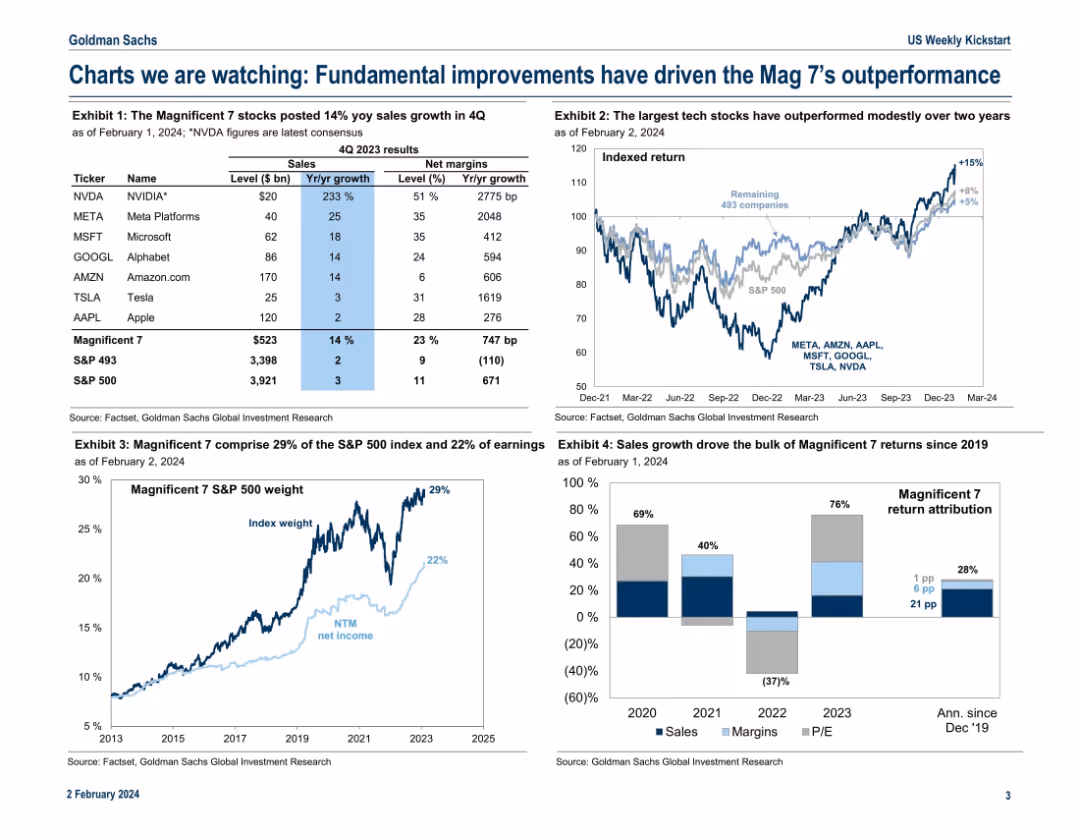
Grid layout of four exhibits; includes tables, line charts, and stacked bar charts to highlight performance and earnings contribution of the “Magnificent 7”.
Performance Metrics and KPIs
Technology & Software
The slide analyzes the top 7 tech-driven companies in the S&P 500, showing their sales growth, net margins, stock returns, and contribution to index weight and earnings. It emphasizes their outperformance and attributes it to fundamentals like revenue growth, with comparisons to the broader index.
Magnificent 7, sales growth, net margins, S&P 500, tech stocks, index weight, earnings, performance
Multiple Chart
Goldman Sachs
Saved
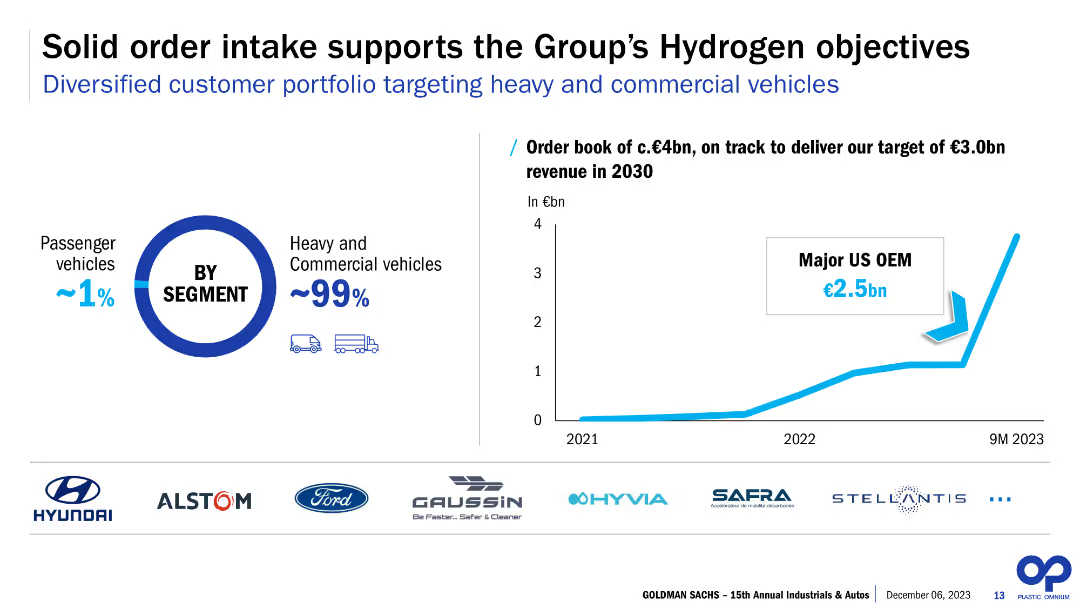
The slide features a column chart illustrating the order book from 2021 to 9M 2023, and a pie chart showing the segment distribution between passenger and commercial vehicles. It also lists logos of major clients and shows a projected revenue target for 2030.
Strategic Planning
Energy & Utilities
The slide discusses the solid order intake supporting Plastic Omnium’s hydrogen objectives, with a focus on heavy and commercial vehicles. It highlights major clients and sets a revenue target of €3.0bn by 2030, indicating strong future prospects and strategic planning in the hydrogen sector.
Hydrogen, order intake, commercial vehicles, passenger vehicles, revenue target, major clients, strategic planning, future prospects, Plastic Omnium, 2030
Multiple Chart
Goldman Sachs
Saved
Previous
Next
If nothing, comes up, please save your slides first
Create a FREE account to continue browsing
Receive Instant Access to 1,000+ slides from companies like McKinsey, Google, and Goldman Sachs
First Name
Last Name
Email
Password
I agree to all
Terms & Privacy Policy
Thank you! Your submission has been received!
Oops! Something went wrong while submitting the form.
Have an account?
Sign in
Column Chart
Heatmap
Chevron
Org Chart
Infographic
Callouts
Timeline
List
Graphic
Picture
Process Flow
Diagram
Paragraph
Map
Table
Framework
Subtitle
Takeaway Box
Icon
Other Chart
Radar Chart
Waterfall Chart
Mekko Chart
Pie Chart
Scatter Plot
Line Chart
Bar chart
Bullet points